
Abstract
Introduction
This study was conducted in order to investigate the diversity of respiratory physiology, including the respiratory impedance and reversibility of airway obstruction, based on quantitative computed tomography (CT) in patients with COPD.
Patients and methods
Medical records of 174 stable COPD patients were retrospectively reviewed to obtain the patients’ clinical data, including the pulmonary function and imaging data. According to the software-based quantification of the degree of emphysema and airway wall thickness, the patients were classified into the “normal by CT” phenotype, the airway-dominant phenotype, the emphysema-dominant phenotype, and the mixed phenotype. The pulmonary function, including the respiratory impedance evaluated by using the forced oscillation technique (FOT) and the reversibility of airway obstruction in response to inhaled short-acting β2-agonists, was then compared among the four phenotypes.
Results
The respiratory system resistance at 5 and 20 Hz (R5 and R20) was significantly higher, and the respiratory system reactance at 5 Hz (X5) was significantly more negative in the airway-dominant and mixed phenotypes than in the other phenotypes. The within-breath changes of X5 (ΔX5) were significantly greater in the mixed phenotype than in the “normal by CT” and emphysema-dominant phenotypes. The FOT parameters (R5, R20, and X5) were significantly correlated with indices of the degree of airway wall thickness and significantly but weakly correlated with the reversibility of airway obstruction. There was no significant correlation between the FOT parameters (R5, R20, and X5) and the degree of emphysema.
Conclusion
There is a diversity of respiratory physiology, including the respiratory impedance and reversibility of airway obstruction, based on quantitative CT in patients with COPD. The FOT measurements may reflect the degree of airway disease and aid in detecting airway remodeling in patients with COPD.
Introduction
COPD can be classified into various phenotypes morphologically based on the findings of chest computed tomography (CT) according to the presence of emphysema and/or the presence of airway wall thickness.Citation1–Citation5 The morphological phenotypes of COPD show distinct clinical characteristics and responsiveness to treatment with bronchodilators and inhaled corticosteroids.Citation4,Citation5 Recently, a software-based quantification of the degree of emphysema and airway wall thickness on chest CT, known as quantitative CT, is available and has been used increasingly.Citation6–Citation8
Forced oscillation technique (FOT) is a simple method for assessing the oscillatory flow resistance of the respiratory system and has provided important findings in respiratory physiology.Citation9–Citation11 FOT is theoretically sensitive to the peripheral airway function and is easy to administer because it is an effort-independent method of evaluating lung mechanics.Citation12,Citation13 The real part of impedance is called the respiratory system resistance (Rrs), whereas the imaginary part is called the respiratory system reactance (Xrs), which is supposed to reflect elastic and inertial properties of lungs. The FOT parameters of Rrs and Xrs are parameters of the airway caliber and of the elastic properties of the respiratory system, respectively, and they reflect the properties of both small and large airways.Citation11 In patients with pulmonary obstructive diseases, the oscillatory flow resistance of the respiratory system tends to increase with the degree of airway obstruction, resulting in an increase in the Rrs and negative values in the Xrs. The Rrs increased, and the Xrs fell to a more negative level in patients with COPD and asthma in a severity-dependent fashion, regardless of respiratory phase.Citation9,Citation10,Citation14 Xrs is sensitive and specific to the presence of expiratory flow limitation in patients with COPD.Citation15 The within-breath changes of the Xrs at 5 Hz (ΔX5), which is an oscillatory parameter of difference in respiratory reactance between inspiratory and expiratory phases, were significantly higher in patients with COPD than in those with asthma and in control subjects.Citation16,Citation17
However, it is unclear whether values of the FOT parameters vary among patients with COPD or not, when they are classified by CT-based phenotype. We hypothesized that differences in morphological changes among phenotypes are associated with differences in pulmonary function, including the respiratory impedance and reversibility of airway obstruction. This study was conducted in order to investigate diversity of respiratory physiology, including the respiratory impedance and reversibility of airway obstruction, based on quantitative CT in patients with COPD.
Patients and methods
Subjects
Medical records of 174 stable COPD patients with forced expiratory volume in 1 second (FEV1)/forced vital capacity (FVC) <70% and FEV1 <80% of the predicted value after inhalation of short-acting β2-agonists (moderate-to-very severe COPD) who were first seen at the outpatient clinic of Shinshu University Hospital from April 2012 to October 2016 were retrospectively reviewed to obtain the patients’ clinical data, including the diagnosis, age, gender, body weight, body height, and smoking history. All patients underwent chest CT and pulmonary function tests, including respiratory impedance and reversibility of airway obstruction. No patient had received treatment for COPD before the examinations. The diagnosis of COPD was based on the patients’ clinical history and symptoms, including dyspnea on exertion and the pulmonary function characterized by persistent airflow obstruction (FEV1/FVC <70% after inhalation of short-acting β2-agonists), in accordance with the Global Initiative for Chronic Obstructive Lung Disease (GOLD) guidelines.Citation18 All patients had a smoking history of >10 pack-years. No patients had a history of asthma.
This study was approved by the institutional research ethics committee of Shinshu University School of Medicine, and all patients gave their written informed consent to participate (the approval number: 3911).
Pulmonary function tests
Spirometry, measurements of the diffusion capacity of the lung for carbon monoxide (DLCO) and closing volume, and a global measure of ventilation heterogeneity (the slope of Phase III of the single breath nitrogen washout test [delta N2]) were performed by using a pulmonary function testing system (Chestac-8900®; Chest Co., Ltd., Tokyo, Japan). FEV1 was measured before and 20 minutes after inhalation of short-acting β2-agonists (200 μg of salbutamol sulfate) by aerosol (metered-dose inhaler) with a spacer to evaluate the reversibility of airflow obstruction. The functional residual capacity was measured by using a body plethysmograph (Body Box; MGC Diagnostics, Ann Arbor, MI, USA), after which the patients immediately inspired to the total lung capacity (TLC) and expired maximally to the residual volume (RV).
The respiratory impedance was measured by using a commercially available multifrequency FOT device (Most-Graph-01®; Chest Co., Ltd.) as previously reported,Citation16,Citation19,Citation20 following the standard recommendations.Citation21 We evaluated Rrs at 5 Hz (R5), Rrs at 20 Hz (R20), Xrs at 5 Hz (X5), resonant frequency (Fres), and low-frequency reactance area (ALX). The difference between the inspiratory and expiratory phases was calculated for each oscillatory parameter. These FOT measurements were performed prior to other pulmonary function tests.
Evaluation of the degree of emphysema and airway wall thickness
Chest CT was performed in the supine position at suspended full inspiration by using a 64-row multi-detector CT (Light-Speed VCT; GE Healthcare, Buckinghamshire, UK). The scanning parameters were as follows: collimation, 64×0.625 mm; tube voltage, 120 kV; tube current, variable; rotation time, 0.4 s. Images were reconstructed by using a standard reconstruction algorithm for the lung by using a slice thickness of 1.25 mm. To evaluate the degree of emphysema, CT images were analyzed automatically by using an image-analyzing software (INTAGE Station LungVision® Version 3.0; Cybernet, Inc., Tokyo, Japan) and as the percentage of low attenuation volume (LAV%). The LAV% was defined as percent lung tissue ≤−950 Hounsfield Unit (HU) on inspiratory CT, as in previous studies.Citation1–Citation3 To evaluate the degree of airway wall thickness, CT images were analyzed by using an image-analyzing software (ZioCube®; Ziosoft, Inc., Tokyo, Japan) and presented as a standardized measure for airway wall thickness (AWT-Pi10) and percentage of airway wall area (WA%) as previously described.Citation6,Citation7,Citation22 AWT-Pi10 is the standardized airway wall thickness at an internal perimeter of 10 mm and is calculated by using linear regression in which the square root of wall area of each measured segment is plotted against its internal perimeter to avoid potential bias issues surrounding different distribution of airway sizes among the subjects.Citation6,Citation7,Citation22 All visible bronchial images up to the sixth generation (the segmental, subsegmental, and subsubsegmental bronchi on inspiratory CT), which were cut in cross-section (short to long axis >2:3), were identified in whole lung fields for each patient. Only segments with an internal perimeter of 6–20 mm were selected for the estimation of AWT-Pi10.Citation22
Classification of COPD into four phenotypes
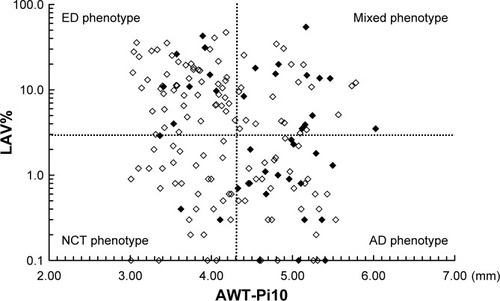
We defined the upper limits of “normal” for the CT measurements of LAV% and AWT-Pi10 as the mean + 2 SD for these measurements in 20 non-COPD smokers as previously described.Citation3,Citation23 The upper limit of AWT-Pi10 was found to be 4.30 and that of LAV% was 3.0%. Based on these cutoff values, patients with COPD were classified into four phenotypes as follows: 1) normal by CT phenotype (NCT; low LAV% and low AWT-Pi10), 2) airway-dominant phenotype (AD; low LAV% and high AWT-Pi10), 3) emphysema-dominant phenotype (ED; high LAV% and low AWT-Pi10), and 4) mixed phenotype (high LAV% and high AWT-Pi10) ().
Figure 1 Correlation between AWT-Pi10 and percentage of low attenuation volume (LAV%) in 174 patients with COPD.
Abbreviations: NCT, normal by computed tomography; AD, airway-dominant; ED, emphysema-dominant; FEV1, forced expiratory volume in 1 second; AWT, airway wall thickness.
Statistical analyses
The values shown in the figures and tables represent the mean ± standard error of the mean. The data distribution of the variables in various groups was first assessed by using Bartlett’s test. If the data for the variables showed a normal distribution, they were compared using one-way analysis of variance, followed by multiple comparisons according to the Tukey–Kramer method. If the data for the variables did not show a normal distribution, the variables were compared by using the Kruskal–Wallis test, followed by multiple comparisons among groups with the nonparametric Tukey–Kramer method. Simple correlations between variables were examined by calculating Pearson correlation coefficients for parametric data and Spearman correlation coefficients for nonparametric data. All statistical analyses were performed by using a software StatFlex® Version 6.0 (Artech, Osaka, Japan). p-values of <0.05 were considered to indicate statistical significance in all the statistical analyses.
Results
Clinical characteristics and pulmonary function
shows the correlation between AWT-Pi10 and LAV%. The proportion of patients who showed the reversibility of airflow obstruction, defined as an increase in FEV1 by >12% and 200 mL from baseline values in response to short-acting β2-agonists, was significantly higher in the AD phenotype than in the NCT (38.8% vs 11.1%, p<0.05) and ED phenotypes (38.8% vs 13.8%, p<0.05). The proportion of those patients also tended to be higher in the mixed phenotype (35.5%), but not statistically significant.
There were no significant differences in age, gender, or Brinkman index among the four phenotypes (). Body mass index was significantly lower in the ED phenotype than in the NCT and AD phenotypes. There was no significant difference in VC among the four phenotypes. FVC was significantly higher in the ED phenotype than in the other phenotypes. FEV1 was significantly lower in the mixed phenotype than in the other phenotypes. FEV1/FVC was significantly lower in the ED and mixed phenotypes than in the NCT and AD phenotypes. RV and TLC were significantly higher in the ED and mixed phenotypes than in the other phenotypes. DLCO and DLCO/VA were significantly lower in the ED and mixed phenotypes than in the other phenotypes. Delta N2 was significantly higher in the ED phenotype and tended to be higher in the mixed phenotype than in NCT and AD phenotypes.
Table 1 Clinical characteristics of patients with the NCT, AD, ED, and mixed phenotypes
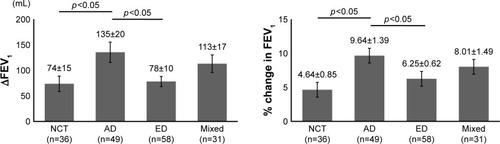
shows the reversibility of airflow obstruction in response to short-acting β2-agonists, which was expressed by an increase in FEV1 from the baseline value. The increases in FEV1 and % change in FEV1 were significantly greater in the AD phenotype than in the NCT and ED phenotypes.
Figure 2 Response to short-acting β2 agonists in patients with the NCT, AD, ED, and mixed phenotypes.
Abbreviations: NCT, normal by computed tomography; AD, airway-dominant; ED, emphysema-dominant; FEV1, forced expiratory volume in 1 second.
Respiratory impedance
Regardless of respiratory phase, R5, R20, and ALX were significantly higher, and X5 was significantly more negative in the AD and mixed phenotypes than in the NCT and ED phenotypes (). ΔX5 was significantly greater in the mixed phenotype and tended to be greater in the AD phenotype than in the NCT and ED phenotypes. ΔALX was significantly more negative in the mixed phenotype and tended to be more negative in the AD phenotype than in the NCT and ED phenotypes.
Table 2 Respiratory impedance in patients with the NCT, AD, ED, and mixed phenotypes
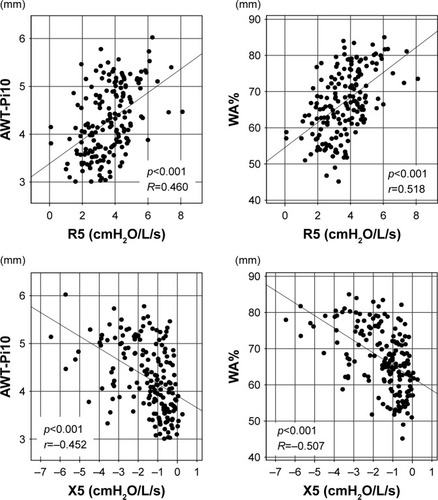
There were significant correlations between the FOT parameters (R5, R20, and X5) and indices of the degree of airway wall thickness (AWT-Pi10 and WA%) (; ). There were significant but weak correlations between the FOT parameters (R5, R20, and X5) and the reversibility of airway obstruction (increases in FEV1 and % change in FEV1). There was no significant correlation between the FOT parameters (R5, R20, and X5) and the degree of emphysema (LAV%).
Table 3 Correlation between the respiratory impedance and the degree of airway wall thickness, emphysema, and reversibility of airway obstruction in patients with COPD (n=174)
Figure 3 Correlation between respiratory impedance and the degree of airway wall thickness on chest CT in patients with COPD (n=174).
Discussion
This is the first report to focus on the diversity of respiratory impedance according to the software-based quantification of the degree of emphysema and airway wall thickness on chest CT in patients with COPD. We showed that R5 and R20 were significantly higher in the phenotypes with airway wall thickness, that is, the AD and mixed phenotypes, than in the other phenotypes. Furthermore, X5 was significantly more negative, regardless of respiratory phase, in the AD and mixed phenotypes than in the other phenotypes. In addition, the within-breath changes of X5 (ΔX5) were significantly greater in the mixed phenotype than in the NCT and ED phenotypes. We also showed that these FOT parameters were significantly correlated with indices of the degree of airway wall thickness (AWT-Pi10 and WA%) and significantly but weakly correlated with the reversibility of airway obstruction.
A previous study revealed that Rrs and Xrs parameters were significantly correlated with FEV1 and FEV1/FVC.Citation16 R5 is particularly frequently interpreted as a parameter of the airway caliber.Citation11 In the present study, there were significant correlations between the FOT parameters (R5, R20, and X5) and indices of the degree of airway wall thickness (AWT-Pi10 and WA%). However, there were no significant correlations between the FOT parameters (R5, R20, and X5) and the degree of emphysema (LAV%). These findings suggest that the FOT parameters reflect the degree of airway disease and aid in detecting airway remodeling both physiologically and morphologically in patients with COPD. In addition, we found that there were significant but weak correlations between the FOT parameters (R5, R20, and X5) and the reversibility of airway obstruction. These findings suggest that the FOT parameters may predict the reversibility of airway obstruction to some extent, but not strongly. This may be because the reversibility of airway obstruction is associated not only with physiological factors due to airway obstruction but also with pharmacological factors due to susceptibility to bronchodilators, which may reflect airway remodeling.
We found that ΔX5 varied among morphological phenotypes based on quantitative CT in patients with COPD. Previous studies revealed that, when airflow obstruction is present, the oscillatory signal cannot pass through the choke points to reach the alveoli,Citation24 resulting in a marked reduction in apparent compliance; thus, X5 changes to be more physiologically negative in patients with COPD.Citation25 ΔX5 has been suggested to reflect the number and distribution of choke points within the bronchial tree, representing the overall distribution of expiratory flow limitations during tidal breathing in patients with COPD.Citation15,Citation26,Citation27 Thus, ΔX5 was useful for discriminating between patients with COPD and asthma.Citation16,Citation17 However, this approach may not be applicable to all patients with COPD due to this diversity of ΔX5 among morphological phenotypes in patients with COPD.
Regarding within-breath changes in Rrs (ΔR5, ΔR20, and ΔR5–R20), in the present study, there were no significant correlations between these ΔRrs parameters and LAV%; only ΔR5–R20 was significantly but very weakly correlated with indices of the degree of airway wall thickness (AWT-Pi10 and WA%). In contrast, Hasegawa et al revealed that the degree of emphysema on chest CT was significantly correlated with ΔR5 and ΔR5−R20.Citation28 The WA% in B10 was also significantly correlated with ΔR5 and ΔR5−R20.Citation28 One possible reason for the differences between our present and Hasegawa et al’s results may be differences in the patient population and methodology for evaluating the degree of airway wall thickness. The proportion of patients with the ED phenotype may have been higher in the study of Hasegawa et al than in the present study, as the percentage of low attenuation area in their study was much higher (34.3%) and their cutoff level of low attenuation area was lower (−960 HU) than ours.Citation28 We evaluated AWT-Pi10 and WA% by identifying and measuring all visible bronchi of the third to sixth generations which were cut in cross-section in whole lung fields for each patient, not a single bronchus.
Karayama et al revealed that the FOT parameters and FEV1 were correlated with airway luminal areas, not airway wall thickness.Citation29 In the present study, we evaluated AWT-Pi10 and WA%, which are the standard indices of airway wall thicknessCitation1,Citation2,Citation7,Citation23 and showed that these indices were significantly correlated with the FOT parameters. One possible reason for the differences between our present study and Karayama et al’s results may be differences in the methodology of evaluating the degree of airway wall thickness. We evaluated AWT-Pi10 and WA% but did not evaluate the absolute values of airway luminal areas and airway wall thickness. In patients with COPD, airway wall area is increased with a decrease in airway luminal area;Citation23 when patients with COPD develop airway wall thickness, their airway luminal area decreases, suggesting that high values of AWT-Pi10 and WA% are associated with a decrease in airway luminal area in patients with COPD. Therefore, our findings are consistent with the results of Karayama et al’s study,Citation29 although the methodology was different.
A quantitative CT imaging analysis is more effective for evaluating the degree of emphysema and airway wall thickness than a visual scoring method because of the reproducibility of software-based quantification. In addition, our present and Higami et al’s results show that the morphological phenotype based on quantitative CT is associated with the clinical characteristics and pulmonary function.Citation3 Therefore, a quantitative CT imaging analysis is believed to be helpful in distinguishing phenotypes. Interestingly, the AD phenotype showed an increase in the Rrs and more negative values in the Xrs, suggesting severe physiological impairment, although the AD phenotype showed little emphysema on chest CT. The AD phenotype also had a better response to short-acting β2 agonists. Therefore, the AD phenotype may have more clinical implications than the other phenotypes in patients with COPD. On the other hand, FOT is easy to administer because it is an effort-independent method of evaluating lung mechanicsCitation12,Citation13 and may also reflect the degree of airway disease and the reversibility of airway obstruction in the present study, suggesting that FOT is useful for deciding on treatment with bronchodilators in clinical practice.
Limitations
There were several limitations in the present study. First, this was a single-center, uncontrolled-design retrospective study. Further prospective study is required to confirm these results. Second, generalizability is a potential problem in the present study. Shinshu University Hospital, which was the site of patient recruitment, is a major hospital and may treat greater numbers of older patients with high disease severity than other general hospitals, resulting in a potential selection bias. Third, the resolution of CT was too low to evaluate the peripheral airways more distal than sixth-generation bronchi. Major sites of airway obstruction in COPD are small airways <2 mm in diameter. We evaluated third- to sixth-generation bronchi, but more distal airways (eg, terminal bronchioles) are also important in COPD.Citation29,Citation30
Conclusion
There is a diversity of respiratory physiology, including the respiratory impedance and reversibility of airway obstruction, according to the software-based quantification of the degree of emphysema and airway wall thickness on chest CT in patients with COPD. The measurement of respiratory impedance using FOT may reflect the degree of airway disease and aid in detecting airway remodeling in patients with COPD.
Disclosure
The authors report no conflicts of interest in this work.
References
- JohannessenASkorgeTDBottaiMMortality by level of emphysema and airway wall thicknessAm J Respir Crit Care Med2013187660260823328525
- ThoNVTrang leTHMurakamiYAirway wall area derived from 3-dimensional computed tomography analysis differs among lung lobes in male smokersPLoS One201495e9833524865661
- HigamiYOgawaERyujinYIncreased epicardial adipose tissue is associated with the airway dominant phenotype of chronic obstructive pulmonary diseasePLoS One2016112e014879426866482
- KitaguchiYFujimotoKKuboKHondaTCharacteristics of COPD phenotypes classified according to the findings of HRCTRespir Med2006100101742175216549342
- FujimotoKKitaguchiYKuboKHondaTClinical analysis of chronic obstructive pulmonary disease phenotypes classified using high-resolution computed tomographyRespirology200611673174017052301
- GrydelandTBDirksenACoxsonHOQuantitative computed tomography: emphysema and airway wall thickness by sex, age and smokingEur Respir J200934485886519324952
- NakanoYWongJCde JongPAThe prediction of small airway dimensions using computed tomographyAm J Respir Crit Care Med2005171214214615516531
- FernandesLFernandesYMesquitaAMQuantitative computed tomography imaging in chronic obstructive pulmonary diseaseLung India201633664665227890994
- GrimbyGTakishimaTGrahamWMacklemPMeadJFrequency dependence of flow resistance in patients with obstructive lung diseaseJ Clin Invest1968476145514655653219
- OhishiJKurosawaHOgawaHIrokawaTHidaWKohzukiMApplication of impulse oscillometry for within-breath analysis in patients with chronic obstructive pulmonary disease: pilot studyBMJ Open201112e000184
- ShiraiTKurosawaHClinical application of the forced oscillation techniqueIntern Med201655655956626984069
- LutchenKRGillisHRelationship between heterogeneous changes in airway morphometry and lung resistance and elastanceJ Appl Physiol (1985)1997834119212019338428
- ThorpeCWBatesJHEffect of stochastic heterogeneity on lung impedance during acute bronchoconstriction: a model analysisJ Appl Physiol (1985)1997825161616259134912
- CavalcantiJVLopesAJJansenJMMeloPLDetection of changes in respiratory mechanics due to increasing degrees of airway obstruction in asthma by the forced oscillation techniqueRespir Med2006100122207221916713226
- DellacaRLSantusPAlivertiADetection of expiratory flow limitation in COPD using the forced oscillation techniqueEur Respir J200423223224014979497
- MoriKShiraiTMikamoMColored 3-dimensional analyses of respiratory resistance and reactance in COPD and asthmaCOPD20118645646322149407
- KandaSFujimotoKKomatsuYYasuoMHanaokaMKuboKEvaluation of respiratory impedance in asthma and COPD by an impulse oscillation systemIntern Med2010491233020045997
- Global Initiative for Chronic Obstructive Lung Disease [homepage on the Internet]Global Strategy for the Diagnosis, Management, and Prevention of Chronic Obstructive Pulmonary Disease NHLBI/WHO Workshop ReportBethesdaNational Heart, Lung and Blood Institute2001 [Updated 2018]. Available from: http://www.goldcopd.comAccessed January 1, 2018
- MoriKShiraiTMikamoMRespiratory mechanics measured by forced oscillation technique in combined pulmonary fibrosis and emphysemaRespir Physiol Neurobiol2013185223524023117106
- ShiraiTMoriKMikamoMRespiratory mechanics and peripheral airway inflammation and dysfunction in asthmaClin Exp Allergy201343552152623600542
- OostveenEMacLeodDLorinoHERS Task Force on Respiratory Impedance Measurements. The forced oscillation technique in clinical practice: methodology, recommendations and future developmentsEur Respir J20032261026104114680096
- PatelBDCoxsonHOPillaiSGAirway wall thickening and emphysema show independent familial aggregation in chronic obstructive pulmonary diseaseAm J Respir Crit Care Med2008178550050518565956
- NakanoYMüllerNLKingGGQuantitative assessment of airway remodeling using high-resolution CTChest20021226 Suppl271S275S
- DawsonSVElliottEAWave-speed limitation on expiratory flow – a unifying conceptJ Appl Physiol Respir Environ Exerc Physiol1977433498515914721
- O’DonnellDEVoducNFitzpatrickMWebbKAEffect of salmeterol on the ventilatory response to exercise in chronic obstructive pulmonary diseaseEur Respir J2004241869415293609
- DellacaRLRotgerMAlivertiANavajasDPedottiAFarreRNoninvasive detection of expiratory flow limitation in COPD patients during nasal CPAPEur Respir J200627598399116446315
- DellacaRLDuffyNPompilioPPExpiratory flow limitation detected by forced oscillation and negative expiratory pressureEur Respir J200729236337417079262
- HasegawaKSatoSTanimuraKEmphysema and airway disease affect within-breath changes in respiratory resistance in COPD patientsRespirology201520577578125824559
- KarayamaMInuiNMoriKRespiratory impedance is correlated with morphological changes in the lungs on three-dimensional CT in patients with COPDSci Rep201774170928176815
- McDonoughJEYuanRSuzukiMSmall-airway obstruction and emphysema in chronic obstructive pulmonary diseaseN Engl J Med2011365171567157522029978