

Abstract
Purpose
Pulmonary rehabilitation (PR) enhances exercise tolerance in patients with COPD; however, improvements in physical activity (PA) are not guaranteed. This study explored the relationship between baseline exercise tolerance and changes in PA after PR.
Materials and methods
Patient data from prospective clinical trials in the PR settings of Athens and Leuven (2008–2016) were analyzed. Validated PA monitors were worn for 1 week before and after a 12-week program. The proportion of patients who improved PA levels ≥1,000 steps/day (“PA responders”) after PR was compared between those with initial 6-minute walk distance [6MWDi] <350 m and ≥350 m. Baseline predictors of PA change were evaluated via univariate and multivariate logistic regression analyses.
Results
Two hundred thirty-six patients with COPD (median [IQR] FEV1 44 [33–59] % predicted, age 65±8 years, 6MWDi 416 [332–486] m) were included. The proportion of “PA responders” after PR was significantly greater in those with higher vs lower 6MWDi (37.9% vs 16.4%, respectively; P<0.001). 6MWDi group classification was the strongest baseline independent predictor of PA improvement (univariate OR 3.10, 95% CI 1.51–6.36).
Conclusion
The likelihood of improving PA after PR is increased with greater 6MWDi. Baseline exercise tolerance appears as an important stratification metric for future research in this field.
Video abstract
Point your SmartPhone at the code above. If you have a QR code reader the video abstract will appear. Or use:
Supplementary materials
Sensitivity analyses
For the purpose of sensitivity analysis, chi-squared analyses were repeated for the primary outcome using 1) the same 1,000 steps/day definition of a physical activity (PA) responder but cardiopulmonary exercise test (CPET)-derived measures of relative peak oxygen consumption (VO2peak adjusted for weight) instead of initial 6-minute walk distance (6MWDi) (groups defined by cutoff at the 28th percentile – corresponding to the proportions obtained via 6MWDi); 2) the lower and upper limits of the minimally important difference [MID] for PA change after pulmonary rehabilitation (PR) (cutoffs of 600 and 1,100 steps/day, respectively); and 3) exclusion of the top 5% extreme PA values. Mean change in PA was also compared across groups defined according to 6MWDi quartiles and evaluated via one-way ANOVA.
In line with findings of the 6MWDi, 16.7% of patients with a low baseline weight-adjusted VO2peak (<13.042 mL/min/kg, derived from maximal incremental cycle CPET [corresponding to the 28th percentile of 6MWDi]), achieved an improvement of ≥1,000 steps/day compared with 37.9% of patients who had a more preserved baseline VO2peak (P=0.002). This pattern was weaker when VO2peak was expressed in absolute units (28th percentile corresponding to <0.930 L/min), with the proportion of responders being 27.3% vs 33.7% for the low and high groups, respectively (P=0.34).
The proportion of patients who improved PA by the suggested lower (600 steps/day) and upper limit (1,100 steps/day) of the MID in PA at 3 months increased significantly with increased 6MWDi (respectively, 25.4% vs 50.9% for 6MWDi <350 m; P<0.001 and 4.9% vs 36.1% for 6MWDi ≥350 m; P=0.001).
The sensitivity analysis relating to the exclusion of the top 5% outlying PA data resulted in proportions of responders in the 6MWDi <350 m vs 6MWDi ≥350 m of 16% and 35%, respectively (P=0.005).
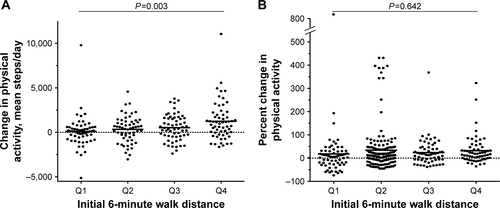
The mean [SD] magnitude of change in PA (steps/day) across the groups defined according to 6MWDi quartiles increased significantly with increasing 6MWDi (99 [1,750], 336 [1,468], 525 [1,444], 1,245 [2,152] for Q1–4, respectively; P=0.003). In contrast to the principal analysis, when PA change was expressed as a percentage change from baseline, no significant differences were observed in the magnitude of PA change across either the two 6MWDi groups (18.3 [109], 31.4 [78.7] for <350 m and ≥350 m groups; P=0.306) or the groups defined according to 6MWDi quartiles (17.9 [114.8], 37.2 [104.7], 23.7 [58.6], 32.2 [61.1] for Q1–4, respectively; P=0.642; Figures S4 and S5). All chi-squared analyses conducted using different thresholds of relative PA improvement (10%, 15%, 20% change from baseline) for the two 6MWDi groups were nonsignificant.
Table S1 Pulmonary rehabilitation responses
Figure S1 Pearson correlation between 6MWDi and change in PA (steps/day).
Notes: Proportion of PA responders, according to 6MWDi groups (vertical dashed line), denoted by the ratio of dots above vs below the horizontal dashed line. The horizontal dashed line represents a change in PA of more than 1,000 steps/day.
Abbreviations: 6MWDi, initial 6-minute walk distance; PA, physical activity.
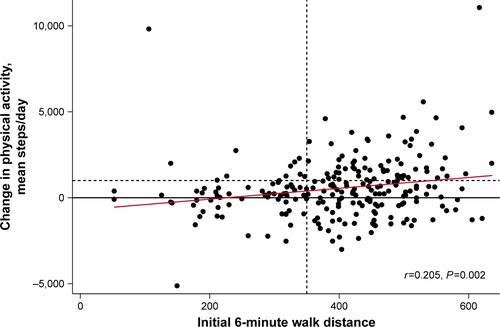
Figure S2 Pearson correlation between changes in PA levels and changes in exercise tolerance at 3 months.
Notes: Closed circles represent patients with 6MWDi of <350 m; open circles represent patients with 6MWDi of at least 350 m. Horizontal dashed line represents the proposed minimally important difference threshold for improvement in PA after PR (1,000 steps/day).
Abbreviations: 6MWDi, initial 6-minute walk distance; PA, physical activity; PR, pulmonary rehabilitation.
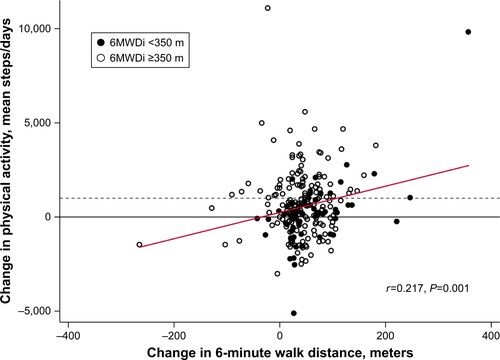
Figure S3 ROC curve of 6MWDi cutoff to identify PA responder.
Notes: Arrow denotes 350 m cutoff reference value corresponding with 85.33% sensitivity; 34.78% specificity; 50.85% correctly classified; +ve likelihood ratio 1.308; -ve likelihood ratio 0.422.
Abbreviations: 6MWDi, initial 6-minute walk distance; PA, physical activity; ROC, receiver operator curve.
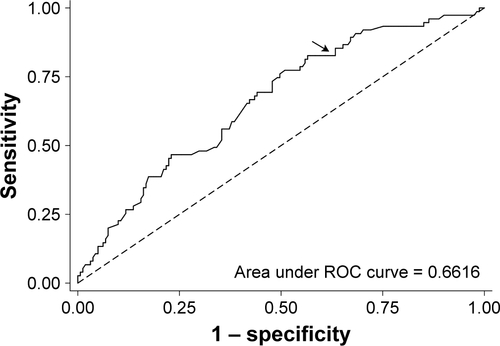
Figure S4 Changes in physical activity across the two 6MWDi groups, expressed as percent change from baseline.
Notes: Horizontal bars denote group means. Percentage change derived from mean steps/day weekly count. Horizontal dashed lines represent the point of zero change.
Abbreviation: 6MWDi, initial 6-minute walk distance.
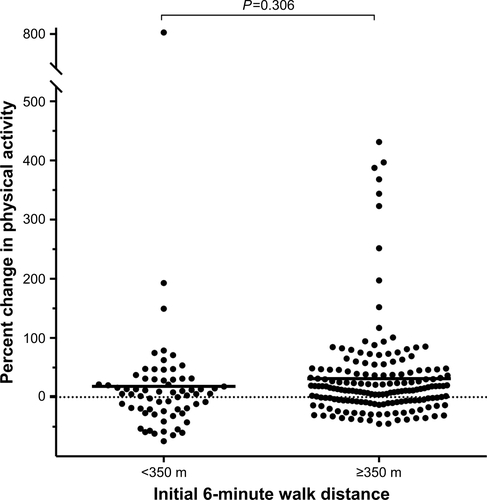
Figure S5 Changes in physical activity across 6MWDi quartiles.
Notes: (A) Change in physical activity expressed as steps/day. (B) Change in physical activity expressed as percent change from baseline, derived from mean steps/day weekly count. Horizontal dashed lines represent the point of zero change. P-value denotes result from one-way ANOVA test.
Abbreviation: 6MWDi, initial 6-minute walk distance.
Disclosure
CRO was the recipient of a European Respiratory Society fellowship, grant number LTRF 2014-3132. ZL was the recipient of a European Respiratory Society Fellowship, grant number LTRF 2016-6686 and is a postdoctoral fellow of the FWO-Flanders (Fellowship number 12U5618N). HD was the recipient of a joint ERS/SEPAR Fellowship (LTRF 2015-5099) and is a postdoctoral research fellow of the FWO-Flanders (12H7517N). FMR was supported by The National Council for Scientific and Technological Development (CNPq), Brazil (249579/2013-8). TT is supported by the Flemish Research Foundation (FondsWetenschappelijk Onderzoek), grant number FWO G·0871·13. The authors report no other conflicts of interest in this work.