
Abstract
Purpose
The purpose of this study was to measure changes in lung density and airway dimension in smokers in the lateral position using four-dimensional dynamic-ventilation computed tomography (CT) during free breathing and to evaluate their correlations with spirometric values.
Materials and methods
Preoperative pleural adhesion assessments included dynamic-ventilation CT of 42 smokers (including 22 patients with COPD) in the lateral position, with the unoperated lung beneath (dependent lung). The scanned lungs’ mean lung density (MLD) and the bilateral main bronchi’s luminal areas (Ai) were measured automatically (13–18 continuous image frames, 0.35 seconds/frame). Calculations included cross-correlation coefficients (CCCs) between the MLD and Ai time curves, and correlations between the quantitative measurements and spirometric values were evaluated by using Spearman’s rank coefficient.
Results
The ΔMLD1.05 (from the peak inspiration frame to the third expiratory frame, 1.05 seconds later) in the nondependent lung negatively correlated with FEV1/FVC (r=−0.417, P<0.01), suggesting that large expiratory movement of the nondependent lung would compensate limited expiratory movement of the dependent lung due to COPD. The ΔAi1.05 negatively correlated with the FEV1/FVC predicted in both the lungs (r=−0.465 and −0.311, P<0.05), suggesting that early expiratory collapses of the main bronchi indicate severe airflow limitation. The CCC correlated with FEV1/FVC in the dependent lung (r=−0.474, P<0.01), suggesting that reduced synchrony between the proximal airway and lung occurs in patients with severe airflow limitation.
Conclusion
In COPD patients, in the lateral position, the following abnormal dynamic-ventilation CT findings are associated with airflow limitation: enhanced complementary ventilation in the nondependent lung, early expiratory airway collapses, and reduced synchrony between airway and lung movements in the dependent lung.
Introduction
Recently, multiple researchers have focused on lung and thoracic movements visualized by continuous scanning by using a 320-row computed tomography (CT) scanner with 160-mm coverage.Citation1–Citation5 By applying an iterative reconstruction algorithm, it has been demonstrated that ultra-low-dose (ULD) CT (0.16–0.29 mSv) has similar diagnostic capability to low-dose CT (0.92–1.74 mSv) in the field of lung cancer (nodule) screening.Citation6–Citation10 These ULD settings have gradually been applied to four-dimensional (4D) dynamic-ventilation CT, which enables the observation of a longer respiratory cycle with acceptable radiation exposure (~2.4 mSv) for the evaluation of direct invasion by lung tumors into adjacent structures and localized pleural adhesion.Citation11,Citation12
It has already been reported that an airway point can be tracked and automatically measured using a commercially available software.Citation13 Furthermore, mean lung density (MLD) values at each image frame of a dynamic-ventilation CT scan can be measured, although the scanned area does not always include the whole lung.Citation14 Among variable quantitative CT indices, airway luminal area (Ai) and MLD have been shown to be useful for the prediction of airway flow limitation severity in COPD.Citation15–Citation18 In addition, based on a strong positive association between MLD and lung volume (LV),Citation15,Citation19 changes in MLD values can be a surrogate for changes in LV on the dynamic-ventilation CT. By analyzing dynamic-ventilation CT images using these quantitative parameters, a new perspective for airway and lung movements has been recognized: the synchrony between proximal airway Ai and MLD values, which is limited and correlated with airflow limitation in COPD.Citation14 This phenomenon may reflect abnormal proximal tracheal/bronchial collapse in association with rapid tension loss in the surrounding structures during early expiration, which is followed by delayed and restricted ventilation in patients with COPD. However, as these previous studies utilized 4D CT data in the supine position only, the effects of gravity or body position on airway/lung movements remain unclear.
The effect of gravity and body position on ventilation has been investigated using apparent diffusion coefficient (ADC) values measured by hyperpolarized Citation3 He MRI, which can be a useful indicator of inflation level.Citation20 Based on the observation, ADC values are similar in nondependent (upside) and dependent (downside) regions at volumes of 100% of vital capacity (VC), whereas the dependent–nondependent vertical gradient in ADC values is observed at VC volumes of both 20% and 60% in nonsmokers, indicating that predominant ventilation occurs in the dorsal regions in the supine position.Citation20 Based on the observation, a change in body posture from supine to lateral/prone positions must make a great influence on ventilation and perfusion during the whole respiration in the lung field. With patients in the lateral position, ventilation is also regarded as predominant in the dependent lung in a physiological state, compared with the nondependent lung.Citation21 To the best of our knowledge, no previous information on continuous measurements of MLD or Ai of patients in the lateral position has been reported. Based on our observation of dynamic-ventilation CT image, strange airway/lung movements may appear, and impairment in the synchrony between proximal airway and lung movements may occur in the lateral position.
Thus, the purpose of this study was to measure continuous changes in Ai of the proximal airways and MLD using dynamic-ventilation CT with patients in the lateral position and to assess their correlations with spirometric values.
Materials and methods
The Institutional Review Board of the Shiga University of Medical Science approved this study. Written informed consent was obtained from all the enrolled patients. This retrospective study was planned as a supplementary analysis after our previous research, which aimed at evaluating the potential of dynamic-ventilation CT for the preoperative detection of pleural adhesion.Citation12 All scan data were anonymized and stored in a research computer. This study was also arranged as part of the Area-Detector Computed Tomography for the Investigation of Thoracic Diseases (ACTIve) study, an ongoing multicenter research project in Japan.
Patient population
Among 85 consecutive patients who underwent dynamic-ventilation CT within a week prior to lung surgery between November 2015 and November 2016 and had no or slight pleural adhesions confirmed at surgery, 33 patients were excluded as some part of the main bronchi was located outside of the scanning area. Ten nonsmokers were also excluded because the influence of airflow limitation on lung movement for smokers in the lateral position was focused on in this study. Finally, 42 smokers with both main bronchi completely present in the scanning area were included in this study. All the enrolled subjects had resectable lung cancer or benign pulmonary lesions that were proved pathologically afterward. Among them, 22 were diagnosed with COPD. summarizes the patient characteristics.
Table 1 Patient characteristics
Dynamic-ventilation CT
Dynamic-ventilation CT was implemented after the routine preoperative protocol for CT examination. The scanning field was set in the lateral position with the unilateral affected lung field placed on the upper side (nondependent lung), mainly because of comparison in the detection performance of pleural adhesion around the targeted lung with transthoracic ultrasound at the operation.
Before the dynamic-ventilation CT, all the patients were instructed to inhale and exhale following a spoken command to give a constant respiratory rhythm, and their breathing was monitored by a radiological technologist. After each patient’s breathing was confirmed visually to be synchronized with the spoken command, dynamic scanning of the fixed scanning field was performed for 5.43±0.28 seconds, covering at least one respiratory cycle using a 320-row CT scanner (Aquilion ONE™, Canon Medical Systems, Otawara, Tochigi, Japan). Scanning and reconstruction parameters for the dynamic-ventilation CT were as follows: tube current, 20 mA; tube voltage, 120 kVp; rotation time, 0.35 seconds; imaging field of view, 320 mm; collimation, 0.5 mm; slice thickness, 0.5 mm; reconstruction kernel, FC13 (for mediastinum); reconstruction interval, 0.35 seconds/frame; and reconstruction method, full reconstruction. Eventually, a total of 13–18 continuous image frames were created from the scan data.
CT dose index volumes (CTDIvol) were defined based on each patient’s body habitus. The effective dose was calculated by multiplying the dose-length product (DLP) values based on CTDIvol by a factor of 0.014.Citation22
Image analysis: lung density measurement on dynamic-ventilation CT
Using a commercially available software (Lung Volume Measurement; Canon Medical Systems), the MLD was measured automatically in each frame, and the time curve of the MLD on the dynamic-ventilation CT scans was created. On the time curve, the peak inspiratory (minimum) MLD, peak expiratory (maximum) MLD, ΔMLDEI values (defined as the subtracted value of the peak expiratory MLD from the peak inspiratory MLD divided by the peak inspiratory MLD), and the ΔMLD1.05 values (defined as the subtracted value of the MLD at the third frame [1.05 seconds] after the peak inspiration divided by the peak inspiratory MLD) were obtained ().
Figure 1 Example of continuous measurements of MLD and Ai in the dependent lung field.
Abbreviations: Ai, luminal area; MLD, mean lung density.
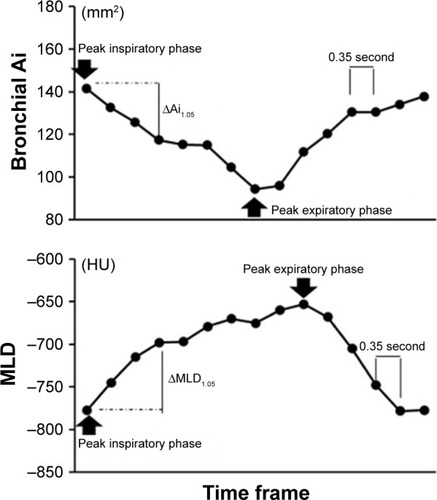
Image analysis: quantitative airway measurement on dynamic-ventilation CT
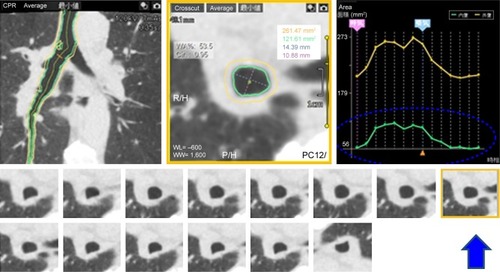
The following procedures were performed using a commercially available research software (4D Airways Analysis; Canon Medical Systems). First, the continuous image data (320 images/frame× total 13–18 frames, every 0.35 seconds) were synthesized for a Cine-CT series. Second, a tree of the centerlines was created automatically from the trachea to all traceable peripheral bronchi throughout the Cine-CT, on which the anatomical information of the measurement point was sustained and reproduced in each frame. Third, once the operator set a measurement point on the airway centerline in a single frame, the corresponding measurement points in other frames were determined simultaneously (). Airway Ai was measured continuously at a single point of the main bronchi of both the nondependent and dependent lungs. An operator (YN, 17 years’ experience in thoracic radiology) selected the middle point of each bronchus in each frame, and the time curve of the Ai on the dynamic-ventilation CT scans was created. On the time curve, the peak inspiratory (maximum) Ai, peak expiratory (minimum) Ai, ΔAiEI values (defined as the subtracted value of the peak expiratory Ai from the peak inspiratory Ai divided by the peak inspiratory Ai), and the ΔAi1.05 values (defined as the subtracted value of the Ai at the third frame [1.05 seconds] after the peak inspiration divided by the peak inspiratory Ai) were obtained ().
Figure 2 Example image of continuous airway measurement using the “4D Airways Analysis” software.
Abbreviation: Ai, luminal area.
Spirometric evaluation
Within 1 month of the dynamic-ventilation CT date, all the patients underwent spirometry, including FEV1 and FVC, in accordance with the American Thoracic Society standards.Citation23
Statistical analyses
Cross-correlation coefficients (CCC; −1<R<1) were calculated between the time curves of the MLD and airway Ai of the main bronchus. If the two time curves were completely opposite in direction over time, the coefficient approached −1. Spearman’s rank correlation analyses were performed to assess the associations of the CT indices with the FEV1/FVC, the FEV1 predicted, and a cumulative smoking index. Correlations were compared using the Meng–Rosenthal–Rubin method with Fisher’s r-to-z transformation.Citation24 Measured values for the MLD and Ai were compared between the nondependent and dependent lung fields, between peak inspiration and peak expiration, and between the right and left lateral positions at the peak inspiration, in each of the nondependent and dependent lung fields. A P-value of 0.05 was considered significant. All statistical analyses were performed using SPSS software Version 22 (IBM Corporation, Chicago, IL, USA).
Results
Patient characteristics
summarizes the characteristics of the enrolled patients, including spirometric values. There were no significant differences between two patient groups of the right and left lateral positions ().
Radiation dose assessment for dynamic-ventilation CT
For a single gantry rotation of 160 mm (0.35 seconds), the CTDIvol was 0.504 mGy. The DLP value for a single rotation was 8.06 mGy⋅cm. The total estimated radiation exposure for dynamic-ventilation CT for 4.55–6.3 seconds varied from 1.78 to 2.46 mSv (2.12±0.11 mSv).
Dynamic MLD measurements
MLD at end expiration was higher than that at end inspiration in both the dependent and nondependent lung fields (P<0.001). During a respiratory cycle, the MLD changed by the mean values of 88.5 and 32.4 HU in the dependent and nondependent lungs, respectively. MLD at peak expiration in the nondependent lung field was lower than that in the dependent lung field (P<0.001). Both ΔMLDEI and ΔMLD1.05 in the dependent lung field were larger than those in the nondependent lung field (P<0.001). At the peak inspiration, MLD in the dependent lung (right: −809.7±32.4 vs left: −812.3±30.8; P=0.646) and that in the nondependent lung (right: −849.8±33.4 vs left: −851.5±19.6; P=0.703) were similar between the right and left lateral position. The ΔMLD1.05 did not correlate with FEV1/FVC in the dependent lung but did negatively correlate with FEV1/FVC in the nondependent lung (r=−0.417, P=0.006). The nondependent/dependent ratio of the ΔMLD1.05 also showed a negative correlation with FEV1/FVC (r=−0.476, P=0.001). ΔMLDEI also correlated with FEV1/FVC in the nondependent lung (r=−0.344, P=0.026); however, its correlation was weaker compared with that between ΔMLD1.05 and FEV1/FVC. In the dependent lung, peak inspiratory MLD had a mild positive correlation with FEV1/FVC (r=0.448, P=0.003), whereas in the nondependent lung neither peak inspiratory nor expiratory MLD correlated with FEV1/FVC or FEV1 predicted ().
Table 2 Lung density measurements and correlations to clinical indices
Dynamic bronchial Ai measurements
In total, 1,310 middle points of the main bronchi were analyzed for Ai measurements. Among them, 255 points (19.5%) were minimally modified by the operator. Ai at the peak inspiration was smaller than that at the peak expiration in both the dependent and nondependent lungs. Ai at the peak inspiration in the nondependent lung field was larger than that in the dependent lung field (P=0.019). Both ΔAiEI and ΔAi1.05 in the dependent lung field were larger than those in the nondependent lung field (P<0.001). At the peak inspiration, right Ai (154.0±50.6) was larger than left Ai (117.1±38.6) in the dependent lung (P=0.001), and right Ai (165.6±52.0) was larger than left Ai (136.8±54.3) in the nondependent lung (P=0.002). The mean ΔAiEI values of the main bronchi were 18.5% in the dependent lung and 10.5% in the nondependent lung. In the nondependent lung, both ΔAiEI and ΔAi1.05 correlated with FEV1/FVC (r=−0.431, P=0.004; r=−0.465, P=0.002). In the dependent lung, ΔAiEI did not show any correlation with FEV1/FVC (r=−0.232, P=0.140), whereas ΔAi1.05 showed a negative correlation with FEV1/FVC (r=−0.311, P=0.045; and ). These data indicate that the early expiratory collapses of the main bronchi are associated with airflow limitation in COPD ().
Table 3 Airway dimension measurements and correlations to clinical indices
Figure 3 Measurements of cross-correlation coefficients between the two time curves from the MLD and the airway Ai in the dependent lung (A) and nondependent lung (B) of a male smoker without COPD (FEV1/FVC=0.70).
Notes: The two time curves of the MLD and the main bronchial Ai movement in the right dependent lung are in almost opposite directions, suggesting that the tracheal dilation and the lung inflation occurred simultaneously. The cross-correlation coefficient between the two time curves was large and negative (−0.84) (A). The two time curves of the MLD and the main bronchial Ai movement in the left nondependent lung moved independently of each other (cross-correlation coefficient=−0.14) (B). Change in the main bronchial Ai in the left nondependent lung (B) was much smaller than that in the right dependent lung (A). The nondependent/dependent ratio in the ΔMLD1.05 value was 0.264.
Abbreviations: Ai, luminal area; MLD, mean lung density; HU, Hounsfield unit.
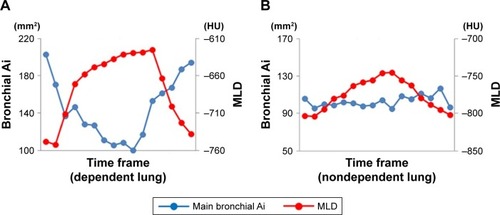
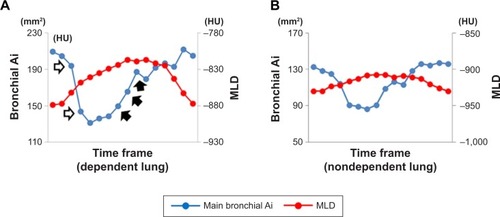
Figure 4 Measurements of cross-correlation coefficients between the two time curves from the MLD and the airway Ai in the dependent lung (A) and nondependent lung (B) of a male smoker with COPD (FEV1/FVC=0.544).
Abbreviations: Ai, luminal area; MLD, mean lung density; HU, Hounsfield unit.
Relationship between MLD and main bronchial Ai
In the nondependent lung, the ΔMLD1.05 correlated positively with the ΔAi1.05 (r=0.465, P=0.002), whereas in the dependent lung field the ΔMLD1.05 did not correlate with the ΔAi1.05 (r=0.243, P=0.122).
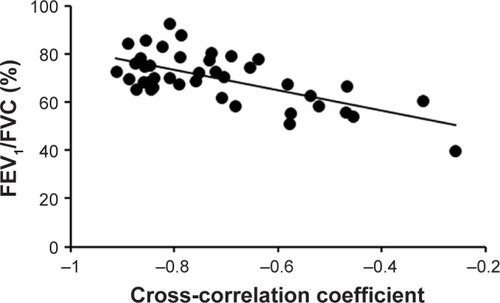
In the dependent lung, the CCC between the main bronchial Ai and MLD correlated with the FEV1/FVC (r=−0.474, P=0.002), whereas in the nondependent lung no significant association was found between the CCC and airflow limitation. These findings suggested that the synchrony between the airway and lung movements was attenuated in association with the degree in the airflow limitation in the dependent lung only (; –; Videos S1 and S2). The CCC in the dependent lung had associations with FEV1/FVC in both the right lateral position (r=−0.657, P=0.008) and the left lateral position (r=−0.400, P=0.038; ). In the right lateral position, the CCC had a negative association with FEV1 predicted in the dependent lung field (r=−0.545, P=0.036) and a positive association with FEV1 predicted in the nondependent lung (r=0.559, P=0.030; ).
Table 4 CCCs (between main bronchial Ai and MLD) and correlations to clinical indices
Figure 5 Scatter plots of the cross-correlation coefficient between two time curves of MLD and the main bronchial Ai movement in the dependent lung for the total study population (n=42) with FEV1/FVC.
Discussion
In this study, we quantitatively assessed dynamic-ventilation CT performed in the lateral position and found the following: 1) although the MLD change in the early expiratory phase (within 1.05 seconds) did not correlate with the airflow limitation in the dependent lung, that in the nondependent lung negatively correlated with the airflow limitation, suggesting that larger early expiratory movements in the nondependent lung are found in patients with more severe airflow limitation; 2) early expiratory collapse of the main bronchus was associated with airflow limitation in both the nondependent and dependent lungs, which has been reported by a few previous studies and was first demonstrated as reproducible quantitative data; and 3) reduced synchrony in the dependent lung between the main bronchial and lung movements was associated with the severity of airflow limitation. Based on these observations, we strongly believe that continuous respiratory movements of the lung and central airways depicted by the dynamic-ventilation CT in the lateral position can bring novel insights into the pathophysiology of COPD, particularly regarding the impact of gravity and body position in ventilation.
In this study, the MLD change in the early expiratory phase in the dependent lung did not correlate with airflow limitation. This result seems to be discordant with the excellent positive correlation in the supine position.Citation14 In addition, as MLD is considered to be a good predictor of airflow limitation and air trapping on static CT scansCitation18,Citation25–Citation28 and the changes in MLD in respiratory cycles can be considered as changes in LV,Citation14,Citation19 the insignificant correlations between the MLD changes in the early expiratory phase and spirometric parameters seem to be strange. This phenomenon may be attributable to a decrease in VC of the dependent lung in the lateral position, which can be associated with the mediastinum located upward, compared with the supine or prone positions, or to the presumed physiological difference between the unilateral dependent lung in the lateral position and the bilateral lungs in the sitting position for spirometry. Interestingly, in the nondependent lung, the increase in MLD in the early expiratory phase negatively correlated with FEV1/FVC, suggesting that the proximal airway closure is delayed in COPD to obtain larger expiratory lung movements. This was also supported by the nondependent/dependent ratio of MLD change in the early-expiratory phase, which was larger in patients with more severe airflow limitation. In addition, the MLD change in the total expiratory phase also correlated negatively with FEV1/FVC. These observations suggest the existence of complementary ventilation in the nondependent lung, which would appear to compensate insufficient ventilation in the dependent lung in patients with COPD to some extent. This indicates that the less affected lung may be placed uppermost in COPD patients in the lateral position to improve ventilation in part when the patient has large atelectasis or pneumonia. If this result is validated by other large study populations in the future, this knowledge would also be applicable to pulmonary rehabilitation in the lateral position and important for better understanding of the pathogenesis of COPD.
Another interesting finding of the current study is that the changes in the main bronchial Ai in the early expiratory phase negatively correlated with FEV1 predicted in the nondependent and dependent lungs. Moreover, these correlations were stronger compared with ΔAiEI from the total expiratory phase. The meaning of highly collapsed proximal airways observed on conventional CT in COPD patients still remains unclear and controversial.Citation29–Citation35 For instance, while the collapsed trachea in the well-collapsed lung on (static) expiratory CT often indicates good lung function,Citation34,Citation35 the expiratory/inspiratory ratio of middle-sized bronchial Ai positively correlates with airflow limitation.Citation17 These inconsistent results may be due to differences in respiration levels corresponding to the “suspected” end-expiratory phase. In fact, for the assessment of lobar air trapping, MLD changes from end inspiration to end expiration corrected with the LV decrease were reported to be important.Citation36 Compared with the previous reports using static inspiratory and expiratory CT scans, the abnormal collapse of the proximal airway during early expiration on dynamic-ventilation CT was first correlated with the airflow limitation in this study. The rapid decrease in proximal bronchial Ai during early expiration detected on dynamic-ventilation CT may be a new indicator for COPD severity. This collapse of the proximal bronchi in COPD would cause a delay in expiration in the peripheral bronchi and result in time lags in the movement among different pulmonary regions. Such early expiratory collapse of the proximal bronchi may be a target for future therapeutic strategies for COPD.
In the dependent lung in the lateral position, reduced synchrony between the main bronchial and lung movements was associated with airflow limitation, which was compatible with the results of a previous study analyzing bilateral lung fields using dynamic-ventilation CT in the supine position.Citation14 In addition, ΔMLDEI in the dependent lung was demonstrated to be larger as compared with the nondependent lung. In the lateral position, it was demonstrated that gravity affects ventilation– perfusion matching, which is independent from the hypoxic pulmonary vasoconstrictive response.Citation37–Citation39 In a previous study addressing the role of gravity in the vascular flow redistribution in the lung during one-lung ventilation for COPD patients, the partial pressure of arterial oxygen during one-lung ventilation in the dependent lung in the lateral position decreased by only about 10% compared with bilateral lung ventilation in the supine position.Citation38 Although the association of the synchrony between the main bronchial and lung movements with ventilation–perfusion relationship has not been evaluated, reduced synchrony in COPD may lead to partial ventilation– perfusion imbalance in the dependent lung field and generate complementary lung movement in the nondependent lung. We speculate that a similar phenomenon might be found in the dorsal region in the lower lung field in the supine position, and disconnection between airway and lung movements would prevent effective gas exchange in the lung.
At the end inspiration, more Ai reduction in the dependent lung based on the nondependent lung for the left main bronchus (117.1±38.6 in the dependent and 136.8±54.3 in the nondependent lungs) was observed as compared with the right main bronchus (154.0±50.6 in the dependent and 165.6±52.0 in the nondependent lungs).
Considering the positional relationship between the heart and main bronchus, this result may be probably due to more compression and direct pulsation effects of the heart to the main bronchus in the left dependent lung field. Therefore, in the left lateral position, CCC between the main bronchial Ai and MLD at the left lateral position may be attenuated in the dependent lung field, and complimentary ventilation may occur in the nondependent lung field even for some smokers without airflow limitation, resulting in the attenuated correlation between CCC and FEV1/FVC or FEV1 predicted in the nondependent and dependent lung fields. On the other hand, in the right lateral position, main bronchi in the nondependent lung field may not be affected so much by the heart, which is supported by the result that there was a positive correlation of CCC between main bronchial Ai and MLD with FEV1 predicted. These issues relevant to the influence of the heart on the proximal bronchial and lung mechanics are crucial and should be assessed in detail in our future study.
There were several limitations in this study. First, because this study was performed as a preliminary study to evaluate the association of the synchrony in MLD and Ai with airflow limitation severity on dynamic-ventilation CT, the total number of enrolled patients was small. Thus, the results of this study should be evaluated further in a larger study population without lung tumors. Second, the scanning area could not include the whole thorax. Although we believed that it was best to substitute the MLD measurement as a surrogate for LV measurement, actual respiratory changes in LV could not be measured. Third, we did not measure the trachea and more peripheral bronchi, mainly because we focused on the comparison of the proximal bronchi between the nondependent and dependent lungs. It has been widely accepted that the airway dimensions or wall thickening in the more peripheral airways has been demonstrated to reflect airflow limitation more precisely. Improvement in the software will enable us to measure more peripheral airways on the dynamic-ventilation CT. Fourth, extra radiation exposure for the dynamic-ventilation CT (~2.1 mSv in this study) may lead to concerns about the application of this method in routine clinical examinations. Although the tube current was fixed at 20 mA in this study, a reduced tube current, such as 10 mA, may be feasible in future studies, particularly in combination with more powerful iterative reconstruction techniques. Fifth, the influence of dose reduction on lung densitometry could not be an ignorable issue in this study. However, in a previous study, MLD measured on chest CT image at considerably reduced dose (10 mA) was demonstrated to be almost equivalent to that at standard dose (240 mA) in identical cases.Citation40 Therefore, considering the tube current adopted in dynamic-ventilation CT was 20 mA, measurement errors in the lung densitometry are thought to be actually too small to bring a crucial problem to our evaluation. Sixth, the severity of airflow limitation in most of the COPD patients was mild (FEV1 predicted >80%). Whether or not similar results are obtained in patients with severe degree of COPD is unknown and should be examined in a future study for larger study population of patients with more severe airflow limitation.
Conclusion
In conclusion, dynamic-ventilation CT in the lateral position demonstrated that airflow limitation was associated with reduced synchrony between the proximal airway and lung movement in the dependent lung and enhanced complimentary ventilation in the nondependent lung, in addition to early expiratory, pathological, proximal airway collapse in both the lungs.
Acknowledgments
The authors acknowledge the great assistance of Ms Ayumi Uranishi (Canon Medical Systems Corporation) for her technical support and important suggestions. The ACTIve study group currently consists of the following institutions: Osaka Medical College, Takatsuki, Osaka, Japan (Mitsuhiro Koyama); Osaka University, Suita, Osaka, Japan (Masahiro Yanagawa, Osamu Honda, and Noriyuki Tomiyama); Kobe University, Kobe, Hyogo, Japan (Yoshiharu Ohno); Ohara General Hospital, Fukushima, Fukushima, Japan (Kotaro Sakuma and Hiroshi Moriya); Saitama Medical University International Medical Center, Hidaka, Saitama, Japan (Fumikazu Sakai); Tenri Hospital, Tenri, Nara, Japan (Yuko Nishimoto and Satoshi Noma); University of the Ryukyus, Nishihara, Okinawa, Japan (Maho Tsubakimoto, Tsuneo Yamashiro, and Sadayuki Murayama); and Shiga University of Medical Science, Otsu, Shiga, Japan (Shigetaka Sato, Yukihiro Nagatani, Norihisa Nitta, and Kiyoshi Murata). Shiga University of Medical Science, University of the Ryukyus, and Ohara General Hospital received a research grant from Canon Medical Systems.
Supplementary materials
Video S1 The dynamic-ventilation computed tomography of a non-COPD smoker. It is clear that the dependent (downside) right lung mainly respires, comparing with the nondependent (upside) left lung.
Video S2 The dynamic-ventilation computed tomography of a COPD patient. The dependent (downside) right lung and nondependent (upside) left lung move similarly, suggesting that the nondependent lung respires largely comparing with the non-COPD smoker in Video 1.
Disclosure
Dr Tsukagoshi and Mr Kimoto are employees of Canon Medical Systems Corporation. The other authors report no conflicts of interest in this work.
References
- LeeEYZuckerEJRestrepoRDaltroPBoisellePMAdvanced large airway CT imaging in children: evolution from axial to 4-D assessmentPediatr Radiol201343328529723417254
- ChoongCKPasrichaSSLiXDynamic four-dimensional computed tomography for preoperative assessment of lung cancer invasion into adjacent structuresEur J Cardiothorac Surg201547223924325082145
- TroupisJMPasrichaSSNarayananHRybickiFJPickAW4D CT and lung cancer surgical resectability: a technical innovationJ Med Imaging Radiat Oncol201458446947124581083
- TanJZCrossettMDitchfieldMDynamic volumetric computed tomographic assessment of the young paediatric airway: initial experience of rapid, non-invasive, four-dimensional techniqueJ Med Imaging Radiat Oncol201357214114823551770
- FujimotoRSatoMMiyataRSuccessful resection of recurrent mediastinal liposarcoma using preoperative evaluation of organ invasion by four-dimensional computed tomographyGen Thorac Cardiovasc Surg201664848849125528654
- NagataniYTakahashiMMurataKLung nodule detection performance in five observers on computed tomography (CT) with adaptive iterative dose reduction using three-dimensional processing (AIDR 3D) in a Japanese multicenter study: comparison between ultra-low-dose CT and low-dose CT by receiver-operating characteristic analysisEur J Radiol20158471401141225892051
- NeroladakiABotsikasDBoudabbousSBeckerCDMontetXComputed tomography of the chest with model-based iterative reconstruction using a radiation exposure similar to chest X-ray examination: preliminary observationsEur Radiol201323236036622892722
- NagataniYTakahashiMIkedaMSub-solid nodule detection performance on reduced-dose computed tomography with iterative reduction: comparison between 20 mA (7 mAs) and 120 mA (42 mAs) regarding nodular size and characteristics and association with size-specific dose estimateAcad Radiol2017248995100728606593
- KatsuraMMatsudaIAkahaneMModel-based iterative reconstruction technique for ultralow-dose chest CT: comparison of pulmonary nodule detectability with the adaptive statistical iterative reconstruction techniqueInvest Radiol201348420621223344517
- NagataniYMoriyaHNomaSAssociation of focal radiation dose adjusted on cross sections with subsolid nodule visibility and quantification on computed tomography images using AIDR 3D: comparison among scanning at 84, 42, and 7 mAsAcad Radiol20182591156116629735355
- SakumaKYamashiroTMoriyaHMurayamaSItoHParietal pleural invasion/adhesion of subpleural lung cancer: quantitative 4-dimensional CT analysis using dynamic-ventilatory scanningEur J Radiol201787364428065373
- HashimotoMNagataniYOshioYPreoperative assessment of pleural adhesion by four-dimensional ultra-low-dose computed tomography (4D-ULDCT) with adaptive iterative dose reduction using three-dimensional processing (AIDR-3D)Eur J Radiol201898117918629279160
- YamashiroTTsubakimotoMNagataniYAutomated continuous quantitative measurement of proximal airways on dynamic ventilation CT: initial experience using an ex vivo porcine lung phantomInt J Chron Obstruct Pulmon Dis20151012045205426445535
- YamashiroTMoriyaHTsubakimotoMMatsuokaSMurayamaSContinuous quantitative measurement of the proximal airway dimensions and lung density on four-dimensional dynamic-ventilation CT in smokersInt J Chron Obstruct Pulmon Dis201611175576427110108
- KunduSGuSLeaderJKAssessment of lung volume collapsibility in chronic obstructive lung disease patients using CTEur Radiol20132361564157223494492
- HasegawaMNasuharaYOnoderaYAirflow limitation and airway dimensions in chronic obstructive pulmonary diseaseAm J Respir Crit Care Med2006173121309131516556695
- MatsuokaSKuriharaYYagihashiKHoshinoMNakajimaYAirway dimensions at inspiratory and expiratory multisection CT in chronic obstructive pulmonary disease: correlation with airflow limitationRadiology200824831042104918710993
- CamiciottoliGCavigliEGrassiLPrevalence and correlates of pulmonary emphysema in smokers and former smokers. A densitometric study of participants in the ITALUNG trialEur Radiol2009191586618690451
- YamashiroTMatsuokaSBartholmaiBJCollapsibility of lung volume by paired inspiratory and expiratory CT scans: correlations with lung function and mean lung densityAcad Radiol201017448949520060751
- HalaweishAFHoffmanEAThedensDRFuldMKSierenJPvan BeekEJEffect of lung inflation level on hyperpolarized 3He apparent diffusion coefficient measurements in never-smokersRadiology2013268257258023592768
- KriegSAlisonJAMccarrenBCowellSPosition affects distribution of ventilation in the lungs of older people: an experimental studyAust J Physiother200753317918417725475
- ShrimptonPCHillierMCLewisMADunnMNational survey of doses from CT in the UK: 2003Br J Radiol20067994896898017213302
- VestboJHurdSSAgustíAGGlobal strategy for the diagnosis, management, and prevention of chronic obstructive pulmonary disease: GOLD executive summaryAm J Respir Crit Care Med2013187434736522878278
- JohnsBRAbbasiFReavenGMEstimates of insulin secretory function in apparently healthy volunteers vary as a function of how the relevant variables are quantifiedClin Chem201157462763221296973
- LeeYKOhYMLeeJHQuantitative assessment of emphysema, air trapping, and airway thickening on computed tomographyLung2008186315716518351420
- O’DonnellRAPeeblesCWardJARelationship between peripheral airway dysfunction, airway obstruction, and neutrophilic inflammation in COPDThorax2004591083784215454648
- KuboKEdaSYamamotoHExpiratory and inspiratory chest computed tomography and pulmonary function tests in cigarette smokersEur Respir J199913225225610065664
- KunduSGuSLeaderJKAssessment of lung volume collapsibility in chronic obstructive lung disease patients using CTEur Radiol20132361564157223494492
- BoisellePMO’DonnellCRBankierAATracheal collapsibility in healthy volunteers during forced expiration: assessment with multi-detector CTRadiology2009252125526219420322
- EderleJRHeusselCPHastJEvaluation of changes in central airway dimensions, lung area and mean lung density at paired inspiratory/expiratory high-resolution computed tomographyEur Radiol200313112454246112811503
- OchsRAPetkovskaIKimHJAbtinFBrownMGoldinJPrevalence of tracheal collapse in an emphysema cohort as measured with end-expiration CTAcad Radiol2009161465319064211
- ThirietMMaarekJMChartrandDATransverse images of the human thoracic trachea during forced expirationJ Appl Physiol1989673103210402793697
- SverzellatiNRastelliAChettaAAirway malacia in chronic obstructive pulmonary disease: prevalence, morphology and relationship with emphysema, bronchiectasis and bronchial wall thickeningEur Radiol20091971669167819205703
- CamiciottoliGDiciottiSBigazziFIs intrathoracic tracheal collapsibility correlated to clinical phenotypes and sex in patients with COPD?Int J Chron Obstruct Pulmon Dis20151084385225960647
- YamashiroTSan José EstéparRMatsuokaSIntrathoracic tracheal volume and collapsibility on inspiratory and end-expiratory CT scans correlations with lung volume and pulmonary function in 85 smokersAcad Radiol201118329930521215660
- NagataniYMurataKTakahashiMA new quantitative index of lobar air trapping in chronic obstructive pulmonary disease (COPD): comparison with conventional methodsEur J Radiol201584596397425681134
- SzegediLLD’HollanderAAVermassenFEDeryckFWoutersPFGravity is an important determinant of oxygenation during one-lung ventilationActa Anaesthesiol Scand201054674475020397977
- BardoczkyGISzegediLLD’HollanderAAMouresJMde FrancquenPYernaultJCTwo-lung and one-lung ventilation in patients with chronic obstructive pulmonary disease: the effects of position and F(IO)2Anesth Analg2000901354110624972
- ArboreliusMLundinGSvanbergLDefaresJGInfluence of unilateral hypoxia on blood flow through the lungs in man in lateral positionJ Appl physiol19601559559713794044
- NishioMKoyamaHOhnoYEmphysema quantification using ultralow-dose CT with iterative reconstruction and filtered back projectionAJR Am J Roentgenol201620661184119227058307