
Abstract
Three-dimensional (3D) cell cultivation is a powerful technique for monitoring and understanding diverse cellular mechanisms in developmental cancer and neuronal biology, tissue engineering, and drug development. 3D systems could relate better to in vivo models than two-dimensional (2D) cultures. Several factors, such as cell type, survival rate, proliferation rate, and gene and protein expression patterns, determine whether a particular cell line can be adapted to a 3D system. The 3D system may overcome some of the limitations of 2D cultures in terms of cell–cell communication and cell networks, which are essential for understanding differentiation, structural organization, shape, and extended connections with other cells or organs. Here, the effect of the anticancer drug cisplatin, also known as cis-diamminedichloroplatinum (II) or CDDP, on adenosine triphosphate (ATP) generation was investigated using 3D spheroid-forming cells and real-time monitoring for 7 days. First, 12 cell lines were screened for their ability to form 3D spheroids: prostate (DU145), testis (F9), embryonic fibroblast (NIH-3T3), muscle (C2C12), embryonic kidney (293T), neuroblastoma (SH-SY5Y), adenocarcinomic alveolar basal epithelial cell (A549), cervical cancer (HeLa), HeLa contaminant (HEp2), pituitary epithelial-like cell (GH3), embryonic cell (PA317), and osteosarcoma (U-2OS) cells. Of these, eight cell lines were selected: NIH-3T3, C2C12, 293T, SH-SY5Y, A549, HeLa, PA317, and U-2OS; and five underwent real-time monitoring of CDDP cytotoxicity: HeLa, A549, 293T, SH-SY5Y, and U-2OS. ATP generation was blocked 1 day after addition of 50 μM CDDP, but cytotoxicity in HeLa, A549, SH-SY5Y, and U-2OS cells could be visualized only 4 days after treatment. In 293T cells, CDDP failed to kill entirely the culture and ATP generation was only partially blocked after 1 day. This suggests potential CDDP resistance of 293T cells or metabolic clearance of the drug. Real-time monitoring and ATP measurements directly confirmed the cytotoxicity of CDDP, indicating that CDDP may interfere with mitochondrial activity.
Video abstract
Point your SmartPhone at the code above. If you have a QR code reader the video abstract will appear. Or use:
Introduction
Cells are usually grown as two-dimensional (2D) cultures, which are reliable and convenient for the majority of developmental biology, tissue engineering, tissue formation, disease mechanism, drug development, and especially large-scale therapeutic protein production studies.Citation1 The recent development of three-dimensional (3D) culture systems has offered a model closer to in vivo conditions and promised to advance our understanding of cell survival, proliferation, differentiation, and gene and protein expression.Citation2 Morphological and other properties exhibited by cells in 3D cultures may be better suited for studies of structural organization, cell–cell communication, cell–extracellular matrix interaction, drug sensitivity, cell death, cancer cell survival, and neighboring cell networks.Citation3 The ensuing results could have a profound influence on studies in cancer biology, drug toxicity tests, stem cell applications, and tissue engineering. For example, 3D culture systems could be applied to the study of vasculogenic mimicry, which is currently severely limited in 2D cultures.Citation4 In terms of drug testing and cancer research, growth rates, shapes, and responses are likely different in 3D cultures, compared to 2D cultures, and bear greater resemblance to in vivo models of gene expressions.Citation5,Citation6
According to Mikhail et al, 3D cultures could represent an intermediate step between 2D cultures and in vivo models and would be especially useful for monitoring initial cellular responses, such as cytotoxicity and drug resistance. Results may help improve planning of animal studies.Citation5 The first step in developing a 3D culture system would be to determine the ability of cell lines to form 3D spheroids. At present, more than 380 cell lines have been tested for their potential to form and maintain 3D spheroids, among these: SF268, SH-SY5Y, U-2OS, MDA-MB-231, MCF-7, HCT116, and an additional 40 cell lines.Citation7 In another study, A2780, OV2008, SKOV-3, plus 32 other cell lines were tested and a dozen were confirmed to form 3D spheroids.Citation8 Each cell line produced spheroids of varying shape and size, which could be classified as tight, compact, or loose aggregates. The following cell lines were unable to form spheroids: 1847, A2780, CaOV3, COV644, EFO27, ES-2, FUOV1, HEY, IGROV1, JAMA-2, LK2, OAWA42, OC316, OV2008, OVCAR429, OV-MZ-15, PXN94, SKOV-3, TOV112D, and UWB1.289.Citation8
Cis-diamminedichloridoplatinum (II) (known as cisplatin or CDDP) is a well-known alkylating agent with anticancer properties. By binding to guanine nucleotide bases, it blocks DNA replication causing DNA damage and cell cycle arrests.Citation9 CDDP was reported to be effective against lung, ovarian, and prostate cancers.Citation10 However, several cell lines have shown resistance to CDDPCitation11,Citation12 and several side effects have been documented, such as nephrotoxicity, infertility, ototoxicity, and neurotoxicity, which would limit its long-term usage.Citation13 Previous studies reported that cancer cell lines Hep3B, HepJ5, ES-2, SKOV-3, OVCAR-3, and MCF-7 suffered a significant loss in cell viability upon CDDP treatment in 2D cultures.Citation9,Citation14–Citation16 Contrary to 2D cultures, when uterus/endometrium cell lines, such as Ishikawa, RL95-2, KLE, and the colon carcinoma cell line HCT116 were used to assess the effect of CDDP, no significant loss of viability was observed in 3D systems.Citation17,Citation18 Instead, cell viability was greatly reduced upon CDDP treatment of 3D bone osteosarcoma cell lines (Saos-2, HOS).Citation19 Therefore, variations to drug sensitivity and tolerance could be better understood with a 3D cell culture system.
In this study, the effect of the anticancer drug CDDP was investigated using 3D spheroid-forming HeLa, A549, 293T, SH-SY5Y, and U-2OS cell lines. In addition, adenosine triphosphate (ATP) production and morphological changes of 3D spheroids were monitored in real-time over 7 days.
Materials and methods
Materials
The following cell lines were obtained from NanoEnTek Inc. (Seoul, Korea): prostate (DU145), testis (F9), embryonic fibroblast (NIH-3T3), muscle (C2C12), embryonic kidney (293T), neuroblastoma (SH-SY5Y), adenocarcinomic alveolar basal epithelial cell (A549), cervical cancer (HeLa), HeLa contaminant (HEp2), pituitary epithelial-like cell (GH3), embryonic cell (PA317), and osteosarcoma (U-2OS). Dulbecco’s Modified Eagle’s Medium (DMEM), Roswell Park Memorial Institute (RPMI) medium, fetal bovine serum (FBS), penicillin-streptomycin, Dulbecco’s phosphate-buffered saline (DPBS), and Trypsin-EDTA solution (1X: 0.05% porcine trypsin [1:250], 0.53 mM EDTA, and phenol red in HBSS without Ca2+ and Mg2+) were from WelGENE Inc. (Seoul, Korea). For the 2D cell viability assay, 96-well microplates from Thermo Scientific™ Nunc™ (C.165305, Waltham, MA, USA) was used. Corning® 96-well spheroid microplates (C.4520; Corning Inc., Corning, NY, USA) were used for 3D spheroid formation assays. CDDP and DMSO were obtained from Sigma Aldrich Co. (St Louis, MO, USA). Cell counting was performed with an automated fluorescence cell counter (Arthur; NanoEnTek). CellTiter-Glo® reagent for measuring ATP levels was purchased from Promega Corporation (Fitchburg, WI, USA). 3D spheroid cell cultures were monitored using the JuLI Stage real-time cell history recorder (NanoEnTek). 3D cell viability was measured using the Infinite Elisa Reader (Tecan Trading AG., Männedorf, Switzerland).
All cells were commercially available, approval from the ethics committee therefore, was not required.
Cell culture
Cells were cultured in RPMI (U-2OS) or DMEM medium (HeLa, SH-SY5Y, C2C12, GH3, NIH-3T3, DU145, F9, A549, 293T, HEp2, and PA317) supplemented with 10% FBS and penicillin-streptomycin (1% 100 units/mL). Medium was replaced two to three times per week. Cells were washed with DPBS pH 7.0; adherent cells were treated with trypsin (0.05%)–EDTA (0.002%), collected, and centrifuged. Cells were aliquoted and 14 to 20 mL were transferred to 75-mL flasks, after which they were passaged every 2 to 4 days.
Spheroid formation assay
HeLa, SH-SY5Y, C2C12, GH3, NIH-3T3, DU-145, F9, A549, 293T, HEp2, and PA317 cells were plated (200 μL) at 5×10³ to 3×10⁴ cells per well into Corning® 96-well spheroid microplates. These were centrifuged at 1,000 rpm for 5 minutes, incubated for 72 hours in a CO2 incubator at 37°C, and then transferred to the JuLI stage to confirm spheroid formation.Citation19
3D spheroid antiproliferation screening
U-2OS (2×10⁴), HeLa (2×10³), SH-SY5Y (2×10³), C2C12 (1.5×10⁴), NIH-3T3 (1.5×10⁴), A549 (2×10³), 293T (2×10³), and PA317 (5×10³) cells per well were plated (100 μL) into microplates as mentioned earlier. These were centrifuged at 1,000 rpm for 5 minutes, incubated for 72 hours in a CO2 incubator at 37°C, and then treated with either 100 μL CDDP (50 mM in DMSO and medium, for a final 20 to 320 μM concentration) or 100 μL DMSO in medium (control, 0 μM). Next, plates were centrifuged at 1,000 rpm for 5 minutes at 37°C and transferred to the JuLI stage in a CO2 incubator at 37°C for antiproliferation screening. Cells were photographed and viability was measured every 30 minutes over 7 days.Citation20,Citation21
3D spheroid antiproliferation assay
U-2OS (1×10⁴), HeLa (2×10³), SH-SY5Y (2×10³), A549 (2×10³), and 293T (2×10³) cells per well were plated (100 μL) into microplates as mentioned earlier. These were centrifuged at 1,000 rpm for 5 minutes, incubated for 72 hours in a CO2 incubator at 37°C, and then treated with 100 μL CDDP (50 mM in DMSO and medium). The final concentration was 50 to 250 μM for U-2OS, HeLa, SH-SY5Y, and A549 cells and 20 to 100 μM for 293T cells. Next, plates were centrifuged at 1,000 rpm for 5 minutes at 37°C and transferred to the JuLI stage in a CO2 incubator at 37°C for the antiproliferation assay. Cells were photographed and viability was measured every 30 minutes over 7 days.
3D cell viability assay
U-2 OS (1×10⁴), HeLa (2×10³), SH-SY5Y (2×10³), A549 (2×10³), and 293T (2×10³) cells per well were plated (100 μL) into microplates as mentioned earlier. These were centrifuged at 1,000 rpm for 5 minutes, incubated for 72 hours in a CO2 incubator at 37°C, and treated with either 100 μL CDDP (50 mM in DMSO and medium) or 100 μL DMSO in medium (control, 0 μM). The final concentration of CDDP was 50 to 250 μM for U-2OS, HeLa, SH-SY5Y, and A549 cells; and 20 to 100 μM for 293T cells. Next, plates were centrifuged at 1,000 rpm for 5 minutes at 37°C and experiments were performed in triplicate. After 1, 4, and 7 days, 100 μL medium was removed from each well and replaced with 100 μL luminescence reagent (3D CellTiter-Glo®) following the manufacturer’s protocol. Plates were incubated for 30 minutes at room temperature and luminescence was measured.Citation22,Citation23
Results and discussion
Spheroid formation assay
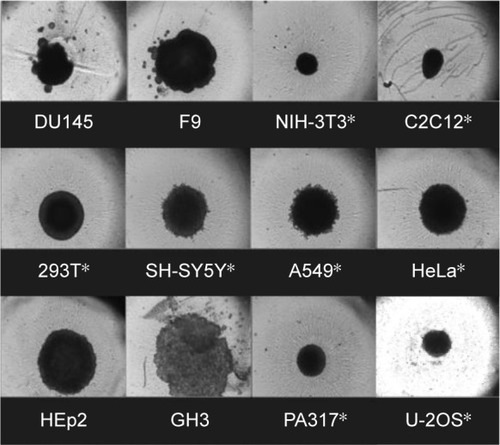
The following 12 cell lines, DU145, F9, NIH-3T3, C2C12, 293T, SH-SY5Y, A549, HeLa, HEp2, GH3, PA317, and U-2OS, were screened for their ability to form and maintain 3D spheroids, as shown in . Of these, eight cell lines maintained a spheroid shape: NIH-3T3, C2C12, 293T, SH-SY5Y, A549, HeLa, PA317, and U-2OS. DU145 and F9 cell lines revealed irregular 3D spheroid shapes () and, like HEp2, had a doubling time too short for cytotoxicity assays. Consequently, they were not selected.
Figure 1 Formation of 3D spheroids after 4 days of culturing.
Abbreviation: CDDP, cis-diamminedichloridoplatinum (II).
3D spheroid cell antiproliferation screening with CDDP
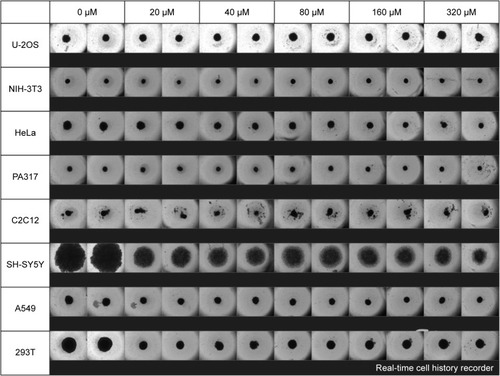
The eight cell lines selected as mentioned earlier were screened in a 3D spheroid cell antiproliferation assay with CDDP, as shown in . Cells were photographed 1, 4 ( at day 1 and at day 4), and 7 days () after treatment with CDDP. Accordingly, NIH-3T3 and PA317 cell lines formed 3D spheroids, but no morphological change was observed after CDDP treatment, suggesting that they might be insensitive toward the drug. The C2C12 cell line could not maintain a spheroid shape and appeared insensitive to CDDP. HeLa, A549, 293T, SH-SY5Y, and U-2OS cell lines grew well in the presence of DMSO only and were selected for further studies. These examined the cytotoxic effect of 20, 40, 80, 160, and 320 μM CDDP. U-2OS was also included as a reference cell line.
Figure 2 Compiled still shot photos of eight cell lines after 7 days from the treatment with cisplatin.
3D spheroid antiproliferation assay with CDDP
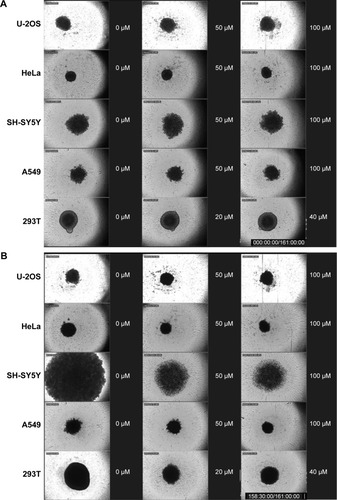
The five selected cell lines were treated with 0, 50, and 100 μM CDDP and their diameter was measured every 6 hours, over a total of 158 hours. Morphological results were identical at concentrations of 100 μM or higher as shown in and . Real-time monitoring of these five cell lines was included in .
Table 1 Changes in the size of spheroids
Figure 3 Still shots of five spheroid cell lines after CDDP treatment.
Abbreviation: CDDP, cis-diamminedichloridoplatinum (II).
HeLa cells
In the absence of CDDP, HeLa spheroids grew continuously over the entire period, expanding from 350 to 519 μm across. Cells treated with 50 and 100 μM CDDP shrunk slightly between 0 and 12 hours, the diameter of spheroids grew slowly in the first 24 hours after treatment, and stayed constant thereafter. Overall, spheroid diameter increased by 160, 9, and 16 μm following treatment with 0, 50, and 100 μM CDDP, respectively. Real-time monitoring of cell movements and divisions revealed that cells were dying from the periphery of spheroids to the core in a CDDP dose-dependent manner. Spheroid shape was maintained regardless of CDDP concentration, suggesting that cell binding and/or cross-linking with the extracellular matrix occurred during spheroid formation, thus stabilizing the structure. Cytotoxicity was observed at all CDDP concentrations, but was apparent only after 24 hours, suggesting that it first required endocytosis of CDDP.
A549 cells
In the absence of CDDP, A549 spheroids shrunk slightly from 669 to 528 μm at the end of the experiment. A similar decrease was observed also with 50 μM CDDP, whereby spheroid diameter declined from 646 to 473 μm. At 100 μM CDDP, spheroids shrunk from 597 to 399 μm during the first 40 hours, at which point all cells appeared dead. Overall, the spheroid diameter changed by −141, −173, and −198 μm following treatment with 0, 50, and 100 μM of CDDP, respectively. The diameter was reduced even further at 150 μM CDDP. As with HeLa, real-time monitoring revealed that cells were dying from the periphery of spheroids to the core. Cells treated with 50 μM CDDP stayed active even after 156 hours, suggesting that A549 cells could tolerate low doses of CDDP. By contrast, cytotoxicity was immediate at 100 μM CDDP. Finally, as with HeLa, the shape of A549 spheroids was maintained at all CDDP concentrations, confirming the role of the extracellular matrix.
293T cells
In the absence of CDDP, 293T spheroids grew continuously for up to 96 hours, expanding from 613 to 860 μm. The size of spheroids treated with 50 and 100 μM CDDP did not change substantially. Overall, spheroid diameter changed by 247, −56, and −23 μm following treatment with 0, 50, and 100 μm CDDP, respectively. As with A549 cells, CDDP cytotoxicity had an immediate effect. Again, cells appeared to die from the periphery of spheroids to the core, but cellular activity could still be observed at the periphery at all CDDP concentrations. Thus, CDDP could block 293T cell growth, but without killing all cells. This may be explained by the development of drug resistance or the fast metabolism typical of 293T cells. The shape of spheroids was maintained in all treated cells.
SH-SY5Y cells
In the absence of CDDP, SH-SY5Y spheroids grew continuously over the entire period, expanding from 669 to 2,048 μm after 156 hours. Within 36 hours, the diameter of treated spheroids changed by 442 and 334 μm following treatment with 50 and 100 μM CDDP, respectively. Upon closer examination by continuous monitoring, SH-SY5Y spheroids became segregated from each other and failed to maintain their canonical shape, suggesting that CDDP elicited cell death and extracellular matrix dissolution. It is possible that immediate cytotoxicity promoted the release of proteases aimed at degrading the extracellular matrix and segregating dead cells. Up to 96 hours after 50 μM CDDP treatment, minor cellular movements could be detected at the core of spheroids.
U-2OS cells
U-2OS spheroid was used as reference, and its size did not change appreciably with or without CDDP. Overall, the diameter of spheroids changed by −49, −119, and −74 μm following treatment with 0, 50, and 100 μM CDDP, respectively. Upon closer examination, shape of U-2OS spheroids was maintained, but cellular movements or divisions were blocked both at the periphery and core of spheroids treated with CDDP.
3D spheroid cell antiproliferation assay
The tumor microenvironment has been implicated in tumor growth, metastasis, and resistance to anticancer therapies. The influence of the microenvironment on the growth pattern of each cell line in the absence of CDDP was monitored in real-time (). Initially, 293T, HeLa, and U-2OS spheroids exhibited a distinct periphery, an intermediate part, and a core. In 293T, proliferating cells were concentrated at the periphery. Cellular activities in HeLa and U-2OS were found at the periphery and intermediate regions. For A549 and SH-SY5Y spheroids, no distinction between periphery and intermediate regions could be made, and proliferation occurred across SH-SY5Y spheroids. U-2OS and 293T spheroids at 0 μM maintained a distinction between regions over the course of the experiment, whereas the HeLa spheroid at 0 μM exhibited increased cell proliferation in the core and reduced proliferation in the intermediate region. CDDP generally resulted in a denser spheroid core, loss of proliferation in the intermediate region, and a drop in measurable peripheral movement. Instead, in SH-SY5Y spheroids, CDDP induced a rapid expansion followed by core collapse. The effect over time of CDDP on the spheroid core, intermediate regions, and periphery is shown in .
Table 2 Observable effects of CDDP on multiple spheroidal cell lines over 24 hours
3D cell viability assay: ATP, comparison with the antiproliferation assay
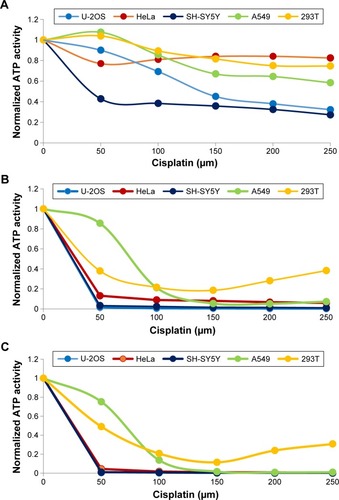
shows changes in ATP activity of U-2OS, HeLa, SH-SY5Y, A549, and 293T spheroids incubated with increasing concentrations of CDDP for 1, 4, and 7 days. Their IC50 values are listed in . During the first day, U-2OS, A549, and 293T spheroids revealed sigmoidal responses to increasing CDDP concentrations; whereas, HeLa and SH-SY5Y spheroids were more sensitive to CDDP and exhibited exponential responses. This observation advocated the use of lower CDDP doses in future experiments. On day 4, ATP activity of U-2OS, HeLa, and SH-SY5Y cells collapsed; whereas, A549 and 293T spheroids retained significant ATP activity. A549 and 293T spheroids exhibited similar ATP activity even on day 7. Based on IC50 data and total spheroid ATP activity (days 1, 4, and 7), sensitivity to CDDP was lowest in A549, followed by 293T, HeLa, U-2OS, and SH-SY5Y cells. The activity profile of 293T spheroids on days 4 and 7 suggested a pattern of CDDP resistance. Whether this occurred spontaneously or not, chronic resistance was previously unknown in this cell line and may warrant further testing.
Table 3 Effect of incubation times on the CDDP IC50 values of A549, 293T, HeLa, U-2OS, and SH-SY5Y spheroids in comparison with results from previously reported 2D experiments
Figure 4 The effect of increasing cisplatin concentrations on U-2OS, HeLa, SH-SY5Y, A549, and 293T spheroidal ATP activity after (A) 1 day, (B) 4 days, and (C) 7 days of incubation.
Comparison of 2D and 3D cultures
According to a study by Wang et al, IC50 values of CDDP against ES-2, SKOV-3, and OVCAR-3 cells in 2D cultures were 8.975, 37.111, and 11.741 μM, respectively.Citation9 Another study reported that IC50 values of CDDP against 2D Hep3B and HepJ5 cultures were 5.38 and 2.37 μM, respectively.Citation15 IC50 values of CDDP against Saos-2 in 2D and 3D cultures were 0.12 and 0.3 μM, respectively.Citation19 Similarly, IC50 values of CDDP against HOS in 2D and 3D cultures were 0.12 and 2.5 μM, respectively.Citation18 Hence, higher cytotoxicity was observed in 2D than in 3D settings.Citation21 Here, IC50 values of CDDP against U-2OS, HeLa, SH-SY5Y, 293T, and A549 spheroids were compared with results from the 2D system by previously reported values, as listed in . IC50 values for all spheroids were higher than results from the 2D system, supporting higher cytotoxicity in 2D than in 3D system. The results would not be a direct comparative representation between 2D and 3D system, since the IC50 values were taken at day 2 for 2D system and day 4 for 3D system. But the much higher IC50 values for spheroids could be approximated by using results from day 1 and day 4. Overall, higher concentrations of CDDP would be required to observe the cytotoxicity in 3D spheroids than in 2D system.
CDDP treatment has been associated with metabolic alterations and DNA damage, disturbing signaling and cell proliferation pathways. Affected genes include p53, MAP-kinases ERK1/2, and Akt1.Citation24–Citation26 The 24-hour delay in the appearances of an initial cytotoxic response could depend on endocytosis and intracellular trafficking being required for toxicity. The extracellular matrix seems essential in maintaining intact 3D spheroids. Hence, the gradient of cell death from the periphery to the core would depend on both diffusion and 3D structure. However, ATP generation was blocked immediately, suggesting that effectiveness of CDDP was also immediate. Because cells were not labeled with fluorescent tags or other markers, reactive oxygen species generation, cytokine release, or oxygen consumption were not measured in the current study. In a previous report by Alborzinia et al, oxygen consumption was shown to be one of the earliest parameters affected by CDDP,Citation27 suggesting a strong link between CDDP cytotoxicity and mitochondria. Such link is supported by the current drastic decrease in ATP generation. Interestingly, CDDP-mediated DNA damage was noticed in HEK293T cells,Citation28 indicating that CDDP may accumulate and bind to mitochondrial DNA, thus damaging these organelles. Our results are in good agreement with previous reports of DNA damage as the main mode of CDDP function.
ATP measurements reflected changes in cell morphology and movement, typical of cell–cell and cell–extracellular matrix interactions. Except for 293T, all cell lines treated with CDDP (at any concentration) showed a rapid loss of ATP generation after 1 day. 293T spheroids exhibited lower, yet sustained, ATP generation, indicating the existence of resistant 293T or fast metabolic clearance of CDDP due to a higher glycolytic flux in these cells.
Conclusion
Five human cell lines, HeLa, A549, 293T, SH-SY5Y, and U-2OS, were selected. Based on their ability to form and maintain 3D spheroids, real-time cytotoxicity of CDDP, one of the best-studied anticancer agents, was assessed. Morphological changes and ATP generation of 3D spheroids were recorded and measured. Following CDDP treatment, cell growth of 3D spheroids and ATP generation by the corresponding cells stopped over time in a dose-dependent manner. The ability to form and maintain a 3D spheroid shape could be determined by cell–cell communication, cell networks, and interactions mediated by binding or cross-linking of surface proteins, receptors, and ligands. Cells killed by CDDP would maintain the spheroid shape and round structure thanks to the extracellular matrix. The benefit of 3D spheroids lies in their model representation of tumors. Along with wound healing and transfection efficiency, the cytotoxic mechanisms of anticancer agents would be better understood if accompanied by real-time 3D cell culture and other proliferation and apoptosis assays. The maintenance of stable experimental conditions for long periods will be crucial for the continuous monitoring in drug testing experiments.
Acknowledgments
This work was supported by the GRRC program of Gyeonggi Province (GRRC Gachon 2015-B04, Development of Micro-fluidic Chip for Diagnosing Diseases) and also by the Industrial Core Technology Development Program (grant number 10049051, development of bench-top automatic immunoassay system with intelligent quality control features for screening cancer or chronic diseases in local clinical setting) funded by the Ministry of Trade, Industry and Energy (MI, South Korea).
Supplementary materials
Figure S1 Still shots of eight spheroid cell lines at 1 day after CDDP treatment.
Figure S2 Still shots of eight spheroid cell lines at 4 days after CDDP treatment.
Disclosure
The authors report no conflict of interest in this work.
References
- HowardDButteryLDShakesheffKMRobertsSJTissue engineering: strategies, stem cells and scaffoldsJ Anat20082131667218422523
- RaviMParameshVKaviyaSRAnuradhaESolomonFDReview. 3D cell culture systems: advantage and applicationsJ Cell Physiol20152301162624912145
- PampaloniFReynaudEGStelzerEHThe third dimension bridges the gap between cell culture and live tissueNat Rev Mol Cell Biol200781083984517684528
- FolbergRArbievaZMosesJTumor cell plasticity in uveal melanoma: microenvironment directed dampening of the invasive and metastatic genotype and phenotype accompanies the generation of vasculogenic mimicry patternsAm J Pathol200616941376138917003493
- MikhailASEetezadiSAllenCMulticellular tumor spheroids for evaluation of cytotoxicity and tumor growth inhibitory effects of nanomedicines in vitro: a comparison of docetaxel-loaded block copolymer micelles and taxoterePLoS One201384e6263023626842
- DolznigHRuppCPuriCModeling colon adenocarcinomas in vitro: a 3D co-culture system induces cancer-relevant pathways upon tumor cell and stromal fibroblast interactionAm J Pathol2011179148750121703426
- VinciMGowanSBoxallFAdvances in establishment and analysis of three-dimensional tumor spheroid-based functional assays for target validation and drug evaluationBMC Biol2012102922439642
- LeeJMMhawech-FaucegliaPLeeNA three-dimensional microenvironment alters protein expression and chemosensitivity of epithelial ovarian cancer cells in vitroLab Invest201393552854223459371
- WangCWChenCLWangCKCDDP-, doxorubicin-, and docetaxel-induced cell death promoted by the aqueous extract of solanum nigrum in human ovarian carcinoma cellsIntegr Cancer Ther201514654655526069278
- BaikMHFriesnerRALippardSJTheoretical study of CDDP binding to purine bases: why does CDDP prefer guanine over adenine?J Am Chem Soc200312546140821409214611245
- NiPXuWZhangYTXNL1 induces apoptosis in CDDP resistant human gastric cancer cell linesCurr Cancer Drug Targets201514985085925348020
- KimDWKimKOShinMJsiRNA-based targeting of antiapoptotic genes can reverse chemoresistance in P-glycoprotein expressing chondrosarcoma cellsMol Cancer200982819445670
- KöppenCReifschneiderOCastanheiraISperlingMKarstUCiarimboliGQuantitative imaging of platinum based on laser ablation-inductively coupled plasma-mass spectrometry to investigate toxic side effects of CDDPMetallomics20157121595160326477751
- LinLTTaiCJSuCHThe ethanolic of Taiwanofungus camphoratus (Antrodia camphorata) induces cell cycle arrest and enhances cytotoxicity of CDDP and doxorubicin on human hepatocellular carcinoma cellsBiomed Res Int2015201541526926557666
- Flores-PérezARafaelliLERamírez-TorresNRAD50 targeting impairs DNA damage response and sensitizes human breast cancer cells to CDDP therapyCancer Biol Ther201415677778824642965
- GambariRHauDKWongWYChuiCHSensitization of Hep3B hepatoma cells to CDDP and doxorubicin by corilaginPhytother Res201428578178323913631
- ChitcholtanKSykesPHEvansJJThe resistance of intracellular mediators to doxorubicin and CDDP are distinct in 3D and 2D endometrial cancerJ Transl Med2012103822394685
- GibotLWasunguLTeissiéJRolsMPAntitumor drug in multicellular spheroids by electropermeabilizationJ Control Release2013167213814723385033
- RimannMLaternserSGvozdenovicAAn in vitro osteosarcoma 3D microtissue model for drug developmentJ Biotechnol201418912913525234575
- MandalBBKunduSCCell proliferation and migration in silk fibroin 3D scaffoldsBiomaterials200930152956296519249094
- NgKWLeongDTWHutmacherDWThe challenge to measure cell proliferation in two and three dimensionsTissue Eng2005111–218219115738673
- Al ShammariBShiomiTTezeraLThe extracellular matrix regulates granuloma necrosis in tuberculosisJ Infect Diseases2015212346347325676469
- AuldDSZhangYQSouthallNTA basis for reduced chemical library inhibition of firefly luciferase obtained from directed evolutionJ Med Chem20095251450145819215089
- KimHSHwangJTYunHInhibition of AMP-activated protein kinase sensitizes cancer cells to cisplatin-induced apoptosis via hyper-induction of p53J Biol Chem200828373731374218079115
- DattaSRBrunetAGreenbergMECellular survival: a play in three AktsGenes Dev199913222905292710579998
- PankaDJChoDCAtkinsMBMierJWGSK-3beta inhibition enhances sorafenib-induced apoptosis in melanoma cell linesJ Biol Chem2008283272673217991738
- AlborziniaHCanSHolenyaPReal-time monitoring of cisplatin-induced cell deathPLoS One201165e1971421603599
- TompkinsJDWuXHerCMutS homologue hMSH5: role in cisplatin-induced DNA damage responseMol Cancer2012111022401567
- ZhangPGaoWYTurnerSDucatmanBSGleevec (STI-571) inhibits lung cancer cell growth (A549) and potentiates the cisplatin effect in vitroMol Cancer20032112537587
- SohnSH1KoEJoYThe genome-wide expression profile of Paeonia suffruticosa-treated cisplatin-stimulated HEK 293 cellsEnviron Toxicol Pharmacol200928345345821784042
- PutralLNBywaterMJGuWRNA interference against human papillomavirus oncogenes in cervical cancer cells results in increased sensitivity to cisplatinMol Pharmacol20056851311131916120770
- GraatHCAWitloxMASchagenFHEDifferent susceptibility of osteosarcoma cell lines and primary cells to treatment with oncolytic adenovirus and doxorubicin or cisplatinBr J Cancer200694121837184416736005
- HusseinDHoltSVBrookesKEPreclinical efficacy of the bioreductive alkylating agent RH1 against paediatric tumoursBr J Cancer20091011556319491903