
 ?Mathematical formulae have been encoded as MathML and are displayed in this HTML version using MathJax in order to improve their display. Uncheck the box to turn MathJax off. This feature requires Javascript. Click on a formula to zoom.
Abstract
The present work describes the synthesis of few hydroxylated amide derivatives as melanogenesis inhibitors. In vitro, in vivo and computational studies proved that compound 6d is a highly potent melanogenesis inhibitor compared to standard kojic acid. The title amides 4a–e and 6a–e were synthesized following simple reaction routes with excellent yields. Most of the synthesized compounds exhibited good mushroom tyrosinase inhibitory activity, but compound 6d showed excellent activity (IC50 0.15 µM) compared to standard kojic acid (IC50 16.69 µM). Lineweaver–Burk plots were used for the determination of kinetic mechanism, and it was found that compounds 4c and 6d showed non-competitive inhibition while 6a and 6b showed mixed-type inhibition. The kinetic mechanism further revealed that compound 6d formed irreversible complex with the target enzyme tyrosinase. The Ki values determined for compounds 4c, 6a, 6b and 6d are 0.188, 0.84, 2.20 and 0.217 µM respectively. Results of human tyrosinase inhibitory activity in A375 human melanoma cells showed that compound 6d exhibited 91.9% inhibi-tory activity at a concentration of 50 µg/mL. In vivo cytotoxicity evaluation of compound 6d in zebrafish embryos showed that it is non-toxic to zebrafish. Melanin depigmentation assay performed in zebrafish indicated that compound 6d possessed greater potential in decreasing melanin contents compared to kojic acid at the same concentration. Computational studies also supported the wet lab findings as compound 6d showed a highest binding affinity with the target protein (PDBID: 2Y9X) with a binding energy value of −7.90 kcal/mol. Molecular dynamic simulation studies also proved that amide 6d formed the most stable complex with tyrosinase. Based upon our in vitro, in vivo and computational studies, we propose that compound 6d is a promising candidate for the development of safe cosmetic agent.
Introduction
Melanogenesis, the process of skin color formation, is controlled by a complex molecular regulatory network embedded in the keratinocytes and melanocytes, which results in the skin and hair pigmentation.Citation1–Citation3 Melanin biosynthesis in melanosomes is regulated by a copper-containing metalloenzyme tyrosinase. Tyrosine in the presence of tyrosinase is converted into melanin through a series of biochemical reactions.Citation4,Citation5 l-tyrosine and l-3,4-dihydroxyphenylalanine (l-DOPA) are the important substrates involved in melanin biosynthesis.Citation6–Citation8 The presence of melanins in the surrounding keratinocytes is the important factor that determines the color of the human skin.Citation9,Citation10
Ultraviolet exposure, α-melanocyte-stimulating hormone, melanocortin 1 receptor and agouti-related protein are some of the other factors involved in melanogenesis.Citation11,Citation12 Melanogenesis corresponds to a possible cellular danger and is confined to special melanosomes in melanocytes, which synthesize pigments and transfer them to recipient cells.Citation13 The abnormal proliferation of melanocytes results in melanoma, a type of skin cancer.Citation14,Citation15 Melasma and post-inflammatory disorders are examples of hyperpigmentation disorders for which patients pursue treatment.Citation16
Higher quantity of tyrosinase activity can also be linked to neurodegenerative diseases due to o-quinones formation by oxidation of dopamine results in neuronal damage and cell death.Citation17–Citation19 The agents that are clinically used for hyperpig-mentation disorders are usually associated with side effects. Therefore, there arises a need to develop some novel melanogenesis inhibitors with decreased side effects. A number of hydroxy-substituted aromatic acids and esters have been reported as potent melanogensis inhibitors.Citation20–Citation23 Takahashi and Miyazawa also reported the potential of hydroxylated amides and analogues to potentially inhibit melanogenesis.Citation24 The present work describes the synthesis of hydroxylated amides and their melanogenesis potency.
Materials and methods
Chemicals
2-amino-p-cymene, mushroom tyrosinase, l-DOPA and other required chemicals were purchased from Sigma-Aldrich, St Louis, MO, USA. Melting points were determined using a Digimelt MPA 160 melting point apparatus and are reported uncorrected. FTIR spectra were recorded using Shimadzu FTIR–8400S spectrometer (Kyoto, Japan; υ, cm−1). 1H NMR and 13C NMR spectra (DMSO-d6) were recorded using a Bruker 400 MHz spectrometer (Brüker Biospin, Switzerland). Chemical shifts (δ) were reported in parts per million (ppm) downfield from the internal standard tetramethylsilane. The purity of the compounds was checked by thin layer chromatography (TLC) on silica gel plate using n-hexane and ethyl acetate as mobile phase.
Synthesis of 2-chloro-N-[2-methyl-5-(propan-2-yl)phenyl]acetamide (2)
2-amino-p-cymene 1 (0.01 mol) and triethylamine (0.01 mol) were reacted with chloroacetyl chloride (0.01mol) in anhydrous dichloromethane (25 mL) at 0°C to −5°C. The reaction mixture was stirred over a period of 1 h at constant temperature. The reaction mixture was then stirred at room temperature for further 5 h and progress of the reaction was determined by TLC. The mixture was washed with 5% HCl and 5% sodium hydroxide solution; the organic layer was washed with saturated aqueous NaCl, dried over anhydrous magnesium sulfate, filtered and the solvent was removed under reduced pressure. The crude 2-chloro-N-[2-methyl-5-(propan-2-yl)phenyl]acetamide 2 was recrystallized in ethanol as needle-like crystals: melting point 94°C–96°C; yield 82%; Rf=0.54 (n-hexane: ethyl acetate 2:1); FTIR νmax cm−1: 3,354 (N–H), 2,987 (sp2 C–H), 2,893 (sp3 C–H), 1,656 (C=O ester), 1,598 (C=C aromatic), 1,140 (C–O, ester).
Synthesis of amide derivatives (4a–e) and (6a–e)
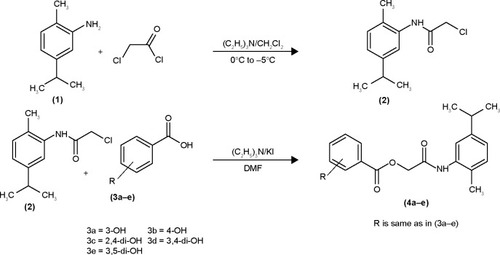
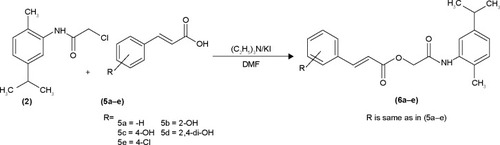
The hydroxy-substituted benzoic acids 3a–e (0.01 mol), triethyl amine (0.01 mol), potassium iodide (0.01 mol) in dimethyl formamide (25 mL) and intermediate 2 (0.01 mol) were stirred overnight at room temperature (). After the completion of reaction, the mixture was poured into finely crushed ice by stirring and extracted with ethyl acetate (4×25 mL). The combined organic layer was washed with 5% HCl, 5% sodium hydroxide and finally with aqueous NaCl solution. The organic layer was dried over anhydrous magnesium sulfate, filtered and the solvent was removed under reduced pressure to afford the crude products 4a–e. The title compounds 4a–e were purified by silica gel column chromatography (n-hexane: ethyl acetate 3:1). The com-pounds 6a–e were prepared by reacting intermediate 2 with substituted cinnamic acids 5a–e (). The reaction conditions were same as described for the preparation of compounds 4a–e.
2-[2-methyl-5-(propan-2-yl)anilino]-2-oxoethyl 3-hydroxybenzoate (4a)
Yield, 85%; melting point, 116°C–118°C; Rf=0.56 (n- hexane:ethyl acetate 2:1); FTIR νmax cm−1: 3,354 (N–H), 3,166 (O–H), 2,987 (sp2 C–H), 2,913 (sp3 C–H), 1,735 (C=O ester), 1,657 (C=O amide), 1,590 (C=C aromatic), 1,149 (C–O, ester); 1H NMR (DMSO-d6, δ ppm): 8.63 (s, 1H, –NH), 7.76 (d, J=6.8 Hz, 1H, H-6), 7.52 (s, 1H, H-2), 7.42 (dd, J=6.8, 7.6 Hz, 1H, H-5), 7.36 (d, J=7.6 Hz, 1H, H-4), 7.14 (d, J=2.4 Hz, 1H, H-3′), 7.05 (d, J=7.6 Hz, 1H, H-4′), 6.96 (s, 1H, H-6′), 4.98 (s, 2H, –CH2), 3.06 (sept, 1H, J=6.5 Hz, H-1″), 2.32 (s, 3H, H-3″), 1.36 (s, 1H, –OH), 1.25 (d, J=6.5 Hz, 6H, H-2″); 13C NMR (CDCl3, δ ppm); 165.6 (C=O ester), 162.5 (C=O, amide), 152.4 (C-3), 144.7 (C-1′), 138.6 (C-2′), 136.4 (C-5′), 133.6 (C-6), 131.3 (C-2), 129.6 (C-1), 127.6 (C-3′), 124.5 (C-4′), 122.3 (C-6′), 120.8 (C-4), 116.4 (C-5), 60.3 (–CH2), 27.4 (C-1″), 26.5 (C-3″), 20.3 (C-2″).
2-[2-methyl-5-(propan-2-yl)anilino]-2-oxoethyl 4-hydroxybenzoate (4b)
Yield, 80%; melting point, 121°C–123°C; Rf=0.53 (n- hexane:ethyl acetate 2:1); FTIR νmax cm−1: 3,332 (N–H), 3,153 (O–H), 2,966 (sp2 C–H), 2,901 (sp3 C–H), 1,732 (C=O ester), 1,645 (C=O amide), 1,593 (C=C aromatic), 1,148 (C–O, ester); 1H NMR (DMSO-d6, δ ppm): 8.64 (s, 1H, –NH), 8.12 (dd, J=7.6, 2.4 Hz, 2H, H-2, H-6), 7.34 (d, J=2.2 Hz, 1H, H-2′), 7.19 (dd, J=7.6, 2.2 Hz, 1H, H-4′), 7.04 (d, J=7.6, 1H, H-6′), 6.92 (dd, J=7.6, 2.2 Hz, 2H, H-3, H-5), 5.01 (s, 2H, –CH2), 4.93 (s, 1H, –OH), 2.72 (sept, J=6.4 Hz, 1H, H-1″), 2.22 (s, 3H, –H-3″), 1.24 (d, J=6.4 Hz, 6H, H-2″); 13C NMR (DMSO-d6, δ ppm); 164.5 (C=O ester), 160.2 (C=O, amide), 154.5 (C-4), 149.7 (C-1′), 139.5 (C-2′), 136.5 (C-5′), 133.6 (C-3, C-5), 130.4 (C-1), 128.3 (C-3′), 126.4 (C-4′), 123.5 (C-6′), 119.4 (C-2, C-6), 61.4 (–CH2), 28.5 (C-1″), 26.8 (C-3″), 21.9 (C-2″).
2-[2-methyl-5-(propan-2-yl)anilino]-2-oxoethyl 2,4-dihydroxybenzoate (4c)
Yield, 78%; melting point, 136°C–138°C; Rf=0.44 (n- hexane:ethyl acetate 2:1); FTIR νmax cm−1: 3,364 (N–H), 3,163 (O–H), 2,966 (sp2 C–H), 2,895 (sp3 C–H), 1,728 (C=O ester), 1,651 (C=O amide), 1,590 (C=C aromatic), 1,160 (C–O, ester); 1H NMR (DMSO-d6, δ ppm): 8.64 (s, 1H, –NH), 7.64 (d, J=7.4 Hz, 1H, H-6), 7.19 (d, J=7.4 Hz, 1H, H-5), 7.11 (d, J=2.2 Hz, 1H, H-6′), 6.89 (s, 1H, H-3), 6.42 (d, J=7.6 Hz, 1H, H-3′), 6.31 (dd, J=7.6, 2.2 Hz, 1H, H-4′), 5.11 (s, 2H, –CH2), 4.67 (s, 2H, –OH), 2.850 (sept, J=7.1 Hz, 1H, H-1″), 2.09 (s, 3H, H-3″), 1.13 (d, J=7.1 Hz, 6H, H-2″); 13C NMR (DMSO-d6, δ ppm); 166.5 (C=O ester), 162.1 (C=O amide), 160.3 (C-2), 155.6 (C-4), 148.2 (C-1′), 138.5 (C-2′), 136.3 (C-5′), 134.6 (C-6), 129.9 (C-4′), 127.7 (C-3′), 120.8 (C-6′), 112.3 (C-3), 108.3 (C-5), 105.1 (C-1), 59.3 (–CH2), 29.1 (C-1″), 27.5 (C-3″), 20.5 (C-2″).
2-[2-methyl-5-(propan-2-yl)anilino]-2-oxoethyl 3,4-dihydroxybenzoate (4d)
Yield, 76%; melting point, 126°C–128°C; Rf=0.48 (n- hexane:ethyl acetate 2:1); FTIR νmax cm−1: 3,376 (N–H), 3,171 (O–H), 2,973 (sp2 C–H), 2,905 (sp3 C–H), 1,730 (C=O ester), 1,671 (C=O amide), 1,592 (C=C aromatic), 1,156 (C–O, ester); 1H NMR (DMSO-d6, δ ppm): 8.45 (s, 1H, –NH), 7.69 (d, J=2.4 Hz, 1H, H-2), 7.52 (dd, J=7.6, 2.4 Hz, 1H, H-6), 7.36 (d, J=7.4 Hz, 1H, H-5), 7.16 (d, J=1.4 Hz, 1H, H-5′), 6.89 (d, J=7.6 Hz, 1H, H-3′), 6.78 (dd, J=7.6, 1.4 Hz, 1H, H-4′), 4.96 (s, 2H, –CH2), 4.40 (s, 2H, –OH), 2.80 (sept, J=5.8 Hz, 1H, H-1″), 2.19 (s, 3H, H-3″), 1.19 (d, J=5.8 Hz, 6H, H-2″); 13C NMR (DMSO-d6, δ ppm); 169.6 (C=O ester), 162.7 (C=O amide), 152.3 (C-3), 146.7 (C-4), 142.5 (C-1′), 138.5 (C-2′), 134.5 (C-5′), 131.9 (C-6), 128.6 (C-4′), 123.7 (C-3′), 122.5 (C-6′), 119.6 (C-2), 116.7 (C-5), 114.8 (C-1), 60.2 (–CH2), 29.5 (C-1″), 24.5 (C-3″), 22.3 (C-2″).
2-[2-methyl-5-(propan-2-yl)anilino]-2-oxoethyl 3,5-dihydroxybenzoate (4e)
Yield, 84%; melting point, 143°C–145°C; Rf=0.45 (n- hexane:ethyl acetate 2:1); FTIR νmax cm−1: 3,385 (N–H), 3,154 (O–H), 2,954 (sp2 C–H), 2,893 (sp3 C–H), 1,731 (C=O ester), 1,643 (C=O amide), 1,590 (C=C aromatic), 1,160 (C–O, ester); 1H NMR (DMSO-d6, δ ppm): 8.49 (s, 1H, –NH), 7.33 (d, J=7.4 Hz, 1H, H-3′), 7.19 (d, J=7.4 Hz, 1H, H-4′), 6.98 (d, J=1.8 Hz, 2H, H-3, H-5), 6.87 (d, J=1.8 Hz, 1H, H-4), 6.67 (s, 1H, H-6′), 5.02 (s, 2H, –CH2), 4.62 (s, 2H, –OH), 2.83 (sept, J=6.2 Hz, 1H, H-1″), 2.20 (s, 3H, H-3″), 1.12 (d, J=6.2 Hz, 6H, H-2″); 13C NMR (DMSO-d6, δ ppm); 169.1 (C=O ester), 161.2 (C=O amide), 158.3 (C-3, C-5), 155.3 (C-1′), 149.0 (C-2′), 139.1 (C-5′), 133.9 (C-2, C-6), 130.1 (C-4′), 126.3 (C-3′), 123.1 (C-6′), 109.3 (C-4), 108.4 (C-1), 62.7 (–CH2), 25.5 (C-1″), 22.6 (C-3″), 19.6 (C-2″).
2-[2-methyl-5-(propan-2-yl)anilino]-2-oxoethyl (2E)-3-phenylprop-2-enoate (6a)
Yield, 86%; melting point, 138°C–140°C; Rf=0.62 (n- hexane:ethyl acetate 2:1); FTIR νmax cm−1: 3,381 (N–H), 2,951 (sp2 C–H), 2,898 (sp3 C–H), 1,729 (C=O ester), 1,665 (C=O amide), 1,597 (C=C aromatic), 1,148 (C–O, ester); 1H NMR (DMSO-d6, δ ppm): 8.21 (s, 1H, –NH), 7.62 (d, J=16.0 Hz, 1H, H-2), 7.48 (dd, J=7.2, 2.4 Hz, 2H, H-2′, H-6′), 7.35–7.39 (m, 3H, H-3′, H-4′, H-5′), 7.15 (d, J=7.2 Hz, 1H, H-3″), 7.01 (d, J=7.2 Hz, 1H, H-4″), 6.91 (s, 1H, H-6″), 6.61 (d, J=16.0 Hz, 1H, H-1), 4.97 (s, 2H, –CH2), 2.81 (sept, J=6.8 Hz, 1H, H-1′″), 2.28 (s, 3H, H-3′″), 1.21 (d, J=6.8 Hz, 6H, H-2′″); 13C NMR (DMSO-d6, δ ppm); 166.8 (C=O ester), 160.5 (C=O, amide), 151.3 (C-1″), 140.9 (C-2), 137.2 (C-2″), 135.3 (C-5″), 130.3 (C-2′, C-6′), 128.4 (C-3′, C-5′), 124.8 (C-4′), 123.5 (C-1′), 121.2 (C-3″), 119.2 (C-4″), 115.2 (C-6″), 60.5 (–CH2), 27.8 (C-1′″), 24.6 (C-3′″), 19.5 (C-2′″).
2-[2-methyl-5-(propan-2-yl)anilino]-2-oxoethyl (2E)-3-(2-hydroxyphenyl)prop-2-enoate (6b)
Yield, 82%; melting point, 190°C–192°C; Rf=0.54 (n-hexane: ethyl acetate 2:1); FTIR νmax cm−1: 3,365 (N–H), 3,138 (O–H), 2,965 (sp2 C–H), 2,895 (sp3 C–H), 1,738 (C=O ester), 1,673 (C=O amide), 1,595 (C=C aromatic), 1,162 (C–O, ester); 1H NMR (DMSO-d6, δ ppm): 8.24 (s, 1H, –NH), 7.83 (d, J=16.0 Hz, 1H, H-2), 7.62 (d, J=7.6, Hz, 2H, H-6′), 7.58 (dd, J=7.6, 2.2 Hz, 1H, H-4′), 7.42 (dd, J=7.6, 2.4 Hz, 2H, H-5′), 7.38 (d, J=7.6 Hz, 1H, H-3′), 7.18 (d, J=7.4 Hz, 1H, H-3″), 7.09 (d, J=7.4 Hz, 1H, H-4″), 6.91 (s, 1H, H-6″), 6.56 (d, J=16.0 Hz, 1H, H-1), 5.02 (s, 2H, –CH2), 3.13 (sept, J=7.1 Hz, 1H, H-1′″), 2.31 (s, 3H, H-3′″), 1.21 (d, J=7.1 Hz, 6H, H-2′″); 13C NMR (DMSO-d6, δ ppm); 165.9 (C=O ester), 162.2 (C=O, amide), 156.8 (C-1″), 147.2 (C-2), 141.3 (C-2″), 138.9 (C-5″), 129.4 (C-3′, C-5′), 127.3 (C-4′), 125.2 (C-1′), 121.5 (C-3″), 119.4 (C-4″), 114.3 (C-2′, C-6′), 111.1 (C-6″), 62.4 (–CH2), 28.4 (C-1′″), 25.4 (C-3′″), 21.8 (C-2′″).
2-[2-methyl-5-(propan-2-yl)anilino]-2-oxoethyl (2E)-3-(4-hydroxyphenyl)prop-2-enoate (6c)
Yield, 84%; melting point, 206°C–208°C; Rf=0.52 (n- hexane:ethyl acetate 2:1); FTIR νmax cm−1: 3,363 (N–H), 3,193 (O–H), 2,975 (sp2 C–H), 2,898 (sp3 C–H), 1,725 (C=O ester), 1,652 (C=O amide), 1,596 (C=C aromatic), 1,166 (C–O, ester); 1H NMR (DMSO-d6, δ ppm): 8.78 (s, 1H, –NH), 7.62 (d, J=16.0 Hz, 1H, H-2), 7.53 (dd, J=7.4, 2.2 Hz, 2H, H-2′, H-6′), 7.39 (dd, J=7.4, 2.2 Hz, 2H, H-3′, 5′), 7.19 (d, J=7.6 Hz, 1H, H-3″), 7.08 (d, J=7.6 Hz, 1H, H-4″), 6.98 (s, 1H, H-6″), 6.68 (d, J=16.0 Hz, 1H, H-1), 4.99 (s, 2H, –CH2), 2.98 (sept, J=6.2 Hz, 1H, H-1′″), 2.31 (s, 3H, H-3′″), 1.21 (d, J=6.2 Hz, 6H, H-2′″); 13C NMR (DMSO-d6, δ ppm); 166.3 (C=O ester), 161.3 (C=O, amide), 156.5 (C-1″), 142.8 (C-2), 139.5 (C-2″), 136.4 (C-5″), 132.5 (C-3′, C-5′), 130.4 (C-4′), 127.3 (C-1′), 121.6 (C-3″), 119.4 (C-4″), 117.5 (C-2′, C-6′), 112.7 (C-6″), 62.4 (–CH2), 28.4 (C-1′″), 25.5 (C-3′″), 21.4 (C-2′″).
2-[2-methyl-5-(propan-2-yl)anilino]-2-oxoethyl (2E)-3-(2,4-hydroxyphenyl)prop-2-enoate (6d)
Yield, 76%; melting point, 224°C–226°C; Rf=0.44 (n- hexane:ethyl acetate 2:1); FTIR νmax cm−1: 3,387 (N–H), 3,158 (O–H), 2,958 (sp2 C–H), 2,890 (sp3 C–H), 1,735 (C=O ester), 1,648 (C=O amide), 1,598 (C=C aromatic), 1,168 (C–O, ester); 1H NMR (DMSO-d6, δ ppm): 8.89 (s, 1H, –NH), 7.78 (d, J=16.0 Hz, 1H, H-2), 7.49 (d, J=7.2 Hz, 1H, H-6′), 7.43 (d, J=7.2 Hz, 1H, H-5′), 7.39 (s, 1H, H-3′), 7.19 (d, J=7.2 Hz, 1H, H-3″), 7.02 (d, J=6.6 Hz, 1H, H-4″), 6.94 (s, 1H, H-6″), 6.62 (d, J=16.0 Hz, 1H, H-1), 5.01 (s, 2H, –CH2), 3.21 (sept, J=6.8 Hz, 1H, H-1′″), 2.35 (s, 3H, H-3′″), 1.31 (d, J=7.2 Hz, 6H, H-2′″); 13C NMR (DMSO-d6, δ ppm); 166.3 (C=O ester), 160.2 (C=O, amide), 157.6 (C-1″), 147.9 (C-2), 146.2 (C-2″), 137.5 (C-5″), 130.5 (C-3′), 127.1 (C-5′), 126.4 (C-4′), 127.2 (C-1′), 125.5 (C-3″), 123.2 (C-4″), 121.6 (C-2′), 118.5 (C-6′), 112.7 (C-6″), 62.4 (–CH2), 27.3 (C-1′″), 26.3 (C-3′″), 21.3 (C-2′″).
2-[2-methyl-5-(propan-2-yl)anilino]-2-oxoethyl (2E)-3-(4-chlorophenyl)prop-2-enoate (6e)
Yield, 86%; melting point, 139°C–141°C; Rf=0.62 (n-hexane:ethyl acetate 2:1); FTIR νmax cm−1: 3,365 (N–H), 2,967 (sp2 C–H), 2,898 (sp3 C–H), 1,735 (C=O ester), 1,656 (C=O amide), 1,598 (C=C aromatic), 1,148 (C–O, ester); 1H NMR (DMSO-d6, δ ppm): 8.24 (s, 1H, –NH), 7.82 (d, J=16.0 Hz, 1H, H-2), 7.51 (d, J=7.6 Hz, 2H, H-2′, 6′), 7.36 (d, J=7.6 Hz, 1H, H-3″), 7.16 (d, J=7.6 Hz, 1H, H-4″), 6.98 (s, 1H, H-6″), 6.77 (d, J=7.6 Hz, 2H, H-3′, H-5′), 6.48 (d, J=16.0 Hz, 1H, H-1), 5.01 (s, 2H, –CH2), 3.11 (sept, J=5.8 Hz, 1H, H-1′″), 2.48 (s, 3H, H-3′″), 1.19 (d, J=5.8 Hz, 6H, H-2′″); 13C NMR (CDCl3, δ ppm); 167.6 (C=O ester), 161.3 (C=O, amide), 153.4 (C-1″), 148.8 (C-2), 137.6 (C-2″), 134.6 (C-5″), 131.8 (C-2′, C-6′), 129.5 (C-3′, C-5′), 127.9 (C-4′), 124.5 (C-1′), 122.5 (C-3″), 120.4 (C-4″), 118.3 (C-6″), 62.9 (–CH2), 29.4 (C-1′″), 25.6 (C-3′″), 22.3 (C-2′″).
Mushroom tyrosinase inhibition assay
Mushroom tyrosinase (Sigma-Aldrich, St Louis, MO, USA) inhibition was performed following our previously reported methods.Citation25 In detail, 140 µL of phosphate buffer (20 mM, pH 6.8), 20 µL of mushroom tyrosinase (30 U/mL) and 20 µL of the inhibitor solution were placed in the wells of a 96-well microplate. After preincubation for 10 min at room temperature, 20 µL of l-DOPA (3,4-dihydroxyphenylalanine, Sigma-Aldrich) (0.85 mM) was added and the assay plate was further incubated at 25°C for 20 min. Afterwards, the absorbance of dopachrome was measured at 475 nm using a microplate reader (Optimax Max Tunable, Sunnyvale, CA, USA). Kojic acid was used as a reference inhibitor and phosphate buffer was used as a negative control. The extent of inhibition by the test compounds was expressed as the percentage of concentration necessary to achieve 50% inhibition (IC50). Each concentration was analyzed in three inde-pendent experiments. IC50 values were determined by data analysis and by a graphing software, Origin 8.6, 64-bit.
Percent inhibition of tyrosinase was calculated using the following equation:
Here, B and S are the absorbance of the blank and samples.
Elastase inhibition assay
Elastase (elastase from porcine pancreas) inhibition assay was performed based on the methods reported by Kraunsoe et alCitation26 and Kim et alCitation27 with a few modifications. In order to perform elastase inhibition assay, the amount of released p-nitroaniline, which was hydrolyzed from the substrate (N-succinyl-Ala-Ala-Ala-p-nitroanilide) by elastase, was determined by measuring the absorbance at 410 nm. In detail, 0.8 mM solution of N-succinyl-Ala-Ala-Ala-p-nitroanilide was prepared in a 0.2 M Tris–HCl buffer (pH 8.0) and this buffer (130 µL) was added to the test sample (10 µL) in a 96-well microplate. The microplate was pre-incubated for 10 min at 25°C before elastase (0.0375 unit/mL) stock solution (10 µL) was added. After the addition of the enzyme, the microplate was kept at 25°C for 30 min and the absorbance was measured at 410 nm using microplate reader. All experiments were carried out in triplicate and elastase inhibitory activity was calculated according to the following formula:
Free radical scavenging assay
Free radical scavenging activity of amide derivatives was determined based on previously reported methods with few modifications.Citation28,Citation29 The assay solution consisted of 100 µL of DPPH (150 µM) and 20 µL of increasing concentration of test compounds, and the volume was adjusted to 200 µL in each well with DMSO. The reaction mixture was then incubated for 30 min at room temperature. Ascorbic acid (vitamin C) was used as a reference inhibitor. The assay measurements were carried out using a microplate reader (OPTIMax, Tunable) at 517 nm. The reaction rates were compared and the percent inhibition caused by the presence of tested inhibitors was calculated. Each concentration was analyzed in three independent experiments run in triplicate.
Kinetic analysis of the inhibition of tyrosinase
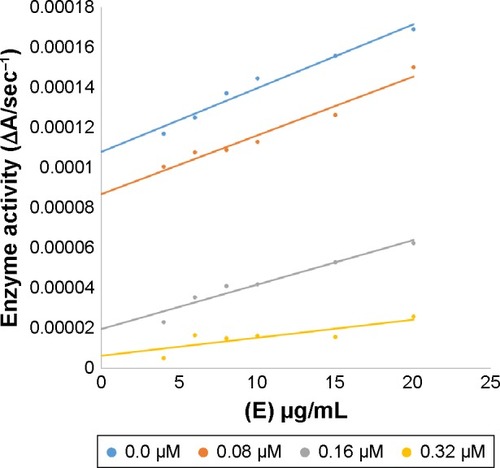
A series of experiments was performed to calculate the inhibitory kinetics of compounds 4c, 6a, 6b and 6d following the previously reported method.Citation30 The compounds’ concentrations were as follows: 0, 3.125, 6.25 and 12.5 µM for 4c; 0, 0.3915 and 0.783 µM for 6a; 0, 0.453, 0.965, 1.813 and 3.626 µM for 6b; and 0, 0.08, 0.16 and 0.32 µM for 6d. Substrate l-DOPA concentration was between 0.0625 and 2 mM in all kinetic studies. Preincubation and measurement time was the same as discussed in mushroom tyrosinase inhibition assay protocol. Maximal initial velocity was determined from initial linear portion of absorbance up to 5 min after addition of enzyme at a 30 s interval. The type of inhibition was determined by using Lineweaver–Burk plots. The enzyme inhibitor (EI) dissociation constant Ki was determined by secondary plot of 1/V versus inhibitor concentrations, while enzyme–substrate–inhibitor (ESI)-dissociation constant Ki′ was determined by intercept versus inhibitor concentrations. The reversible kinetics of the EI complex was also determined for different concentrations of compound 6d versus the enzyme concentration (4, 6, 8, 10, 15 and 20 µg/mL).
Human tyrosinase inhibition assay
Cell culture and preparation of tyrosinase
A375 human melanoma cells were obtained from American Type Culture Collection (ATCC, Rockville, MD, USA). A375 cells were grown in Dulbecco’s Modified Eagle’s Medium (Invitrogen, Burlington, ON, Canada) supplemented with L-glutamine, 10% (v/v) fetal bovine serum (Invitrogen), 50 µg/mL streptomycin (Sigma-Aldrich), 50 units/mL penicillin (Sigma-Aldrich) and supplemented with 200 µM of L-tyrosine for tyrosinase induction. Cell cultures were incubated at 37°C, in a humidified atmosphere of 5% CO2. Cells were scraped out from the tissue culture plate with phosphate-buffered saline (PBS) and were homogenized at 4°C in PBS. The homogenate was centrifuged at 1,000× g for 10 min. The precipitate was sonicated in PBS on ice and the mixture was centrifuged at 10,000× g for 30 min. The supernatant containing tyrosinase was used for the measurement of the inhibitory effects.
Tyrosinase inhibition assay
The tyrosinase inhibitory activity of the synthesized amides was determined following the previously reported method with few modifications.Citation31,Citation32 The assay reaction mixture (200 µL) contained 3.3 mM l-DOPA in 0.33 M phosphate buffer (pH 7.0) and the enzyme in the presence and absence of inhibitors. Fifteen or 20 units of tyrosinase was used to determine the % inhibition. The reaction mixture was incubated at 37°C for 10 min and the absorbance was recorded at 475 nm using a microplate reader (OPTI Max, Tunable). One unit of enzyme was defined as the amount of enzyme that increases the absorbance value by 0.001 at 475 nm per minute under the same conditions as described earlier.
In vivo depigmentation assay in zebrafish
In vivo depigmentation assay was performed in zebrafish according to the previously described method.Citation33
Zebrafish husbandry
Adult wild-type zebrafish (Danio rerio) were purchased from a commercial dealer and were acclimated for 1 month in standard laboratory conditions using a photoperiod of 14 h light and 10 h dark at a temperature of 28.5°C. Fish were fed two times daily with dry food and live brine shrimp larvae. They were kept in thermostatic tanks under constant chemical, biological and mechanical water filtration and aeration. Embryos were obtained from natural spawning that was induced at the morning by turning on the light. Collection of embryos was completed within 30 min. All procedures were performed as described in the “Principles of Laboratory Animal Care” (NIH publication no 85-23, revised 1985), and the study was approved by the Institutional Review Board of Kongju National University (IRB No 2011-2).
Compound treatment and phenotype-based evaluation
The collected synchronized embryos were arrayed by pipette into a 96-well plate: two to three embryos per well with 200 µL of E3 medium (NaCl 5 mM, KCl 0.17 mM, CaCl2 0.33 mM and MgSO4 0.33 mM). The most potent compound 6d solution (in 0.1% DMSO) was added to the E3 medium from 9 to 72 hpf (hours post-fertilization, a total exposure time of 63 h). The positive control was treated with kojic acid. Dechorionated embryos were anesthetized in tricaine methanesulfonate MS-222 solution (Sigma-Aldrich), mounted in 1% methyl cellulose on a depression slide and photographs were taken using stereomicroscope (SMZ745T; Nikon, Shinagawa, Japan) for observation. Pixel measurements were carried out using ImageJ software package (National Institutes of Health, Bethesda, MD, USA).
Determination of melanin contents in zebrafish
Melanin contents in zebrafish were determined following the previously reported method.Citation34,Citation35 For melanin contents determination, 50 µM dose was selected on the basis of in vivo depigmentation results. The collected synchronized embryos were arrayed by dropper into the dish: 20±2 embryos were used in the dish and treated with compound 6d and 50 µM of reference drug kojic acid in 3 mL of E3 medium. After 72 hpf, embryos were anesthetized in tricaine methanesulfonate MS-222 solution. After anesthetizing, embryos were washed three times with E3 medium and eyes were removed from all the treated and non-treated embryos. Embryos extract (pellet) was prepared by homogenization and centrifugation, and the pellet was dissolved in 1 mL of 1N NaOH at 100°C for 10 min. The level of melanin was measured at an absorbance of 405 nm, and the result was compared with a standard curve of synthetic melanin. All experiments were repeated three times.
Zebrafish toxicity assay
Zebrafish toxicity assay was performed according to the previously reported method.Citation36 Prior to compounds treatment, 48 hpf embryos were enzymatically dechorionated using pronase (protease from Streptomyces griseus, 3 mg/mL; Sigma-Aldrich) for 15 min, then rinsed with E3 medium three times and two to three embryos were dispensed in 96-well plate with 200 µL of E3 medium. Embryos were treated with 10, 20 and 50 µM doses of compounds and pates were maintained at 28°C for further 72 h. The survival rate of larvae was assessed at day 5, and during the experiment no food was provided to larvae. In order to evaluate any extent of apoptotic cellular death, after 3 days of treatment (total 5 days), embryos were stained with 1 µg/mL of acridine orange in E3 medium for 30 min. Excess dye was removed by washing three times with E3 medium. The embryos were anesthetized and photographs were taken as described in section “In vivo depigmentation zebrafish assay”.
Computational studies
Retrieval of protein structure
The three dimensional (3D) crystal structure of mushroom tyrosinase (Agaricus bisporus) (PDBID: 2Y9X) was retrieved from Protein Data Bank (PDB) (http://www.rcsb.org). The energy minimization of target protein was carried out by employing conjugate gradient algorithm and Amber force field in UCSF Chimera 1.10.1.Citation37 Stereochemical properties and Ramachandran graph and valuesCitation38 of mushroom tyrosinase were assessed by Molprobity server,Citation39 while the hydrophobicity graph was generated by Discovery Studio 4.1 Client.Citation40 The protein architecture and statistical percentage values of helices, beta-sheets, coils and turns were accessed by VADAR 1.8.Citation41
Candidate structures
The synthesized amide derivatives 4a–e and 6a–e were drawn by ACD/ChemSketch tool. The designed ligands were further visualized and minimized by UCSF Chimera 1.10.1. The biochemical properties of these compounds 4a–e and 6a–e were predicted by various computational tools such as Molinspiration (http://www.molinspiration.com/) and Molsoft (http://www.molsoft.com/). Lipinski’s rule of five (RO5) was justified by Molsoft and Molinspiraion tools.
Molecular docking
Molecular docking experiment was employed on all synthesized ligands 4a–e and 6a–e against mushroom tyrosinase using diverse PyRx tool.Citation42 The preferred orientation of ligands within the active region of target proteins was determined in docking studies. To run the docking experiment, grid box parametric dimension values were adjusted as X =61.0781, Y =56.3001 and Z =63.1015, whereas the centered values were fixed as X =−2.9272, Y =22.0164 and Z =−32.4883, respectively. The default exhaustiveness value was set as 8 to obtain the finest binding conformational pose of protein-ligand docked complexes. All compounds were docked separately against the crystal structure of mushroom tyrosinase. The docked complexes were further evaluated on lowest binding energy (Kcal/mol) values and hydrogen and hydrophobic bond analysis using Discovery Studio (4.1) and UCSF Chimera 1.10.1. 2D graphical depictions of all other compounds were carried out by LIGPLOT.Citation43
Molecular dynamics (MD) simulations
Based on in vitro analysis, docking energies and conformational pose analysis, four best complexes were selected for MD simulation. Groningen Machine for Chemicals Simulations (GROMACS) 4.5.4 packageCitation44 with GROMOS 53A6 force field was applied on all complexes to interpret the backbone residual flexibility.Citation45 The receptor and ligands topology files were created using GROMOS 53A6 force field and online PRODRG Server,Citation46 respectively. Moreover, the receptor–ligand complexes were solvated and placed in a cubic box center adjusted at a distance of 9Å. Ions were added to neutralize the charge of the system. Energy minimization (nsteps =50,000) was done by steepest descent method (1,000 ps). Energy calculation was done by Particle Mesh Ewald method,Citation47 whereas covalent bond constraints were calculated by linear constraint solver algorithm.Citation48 For final MD setup in md.mdp file, time step for integration was adjusted as 0.002 ps, while the cut-off distance for short range neighbor list was adjusted as 0.8 nm. The MD run was set to 15,000 ps with nsteps =750,000 for each protein–ligand complexes, and trajectories files analysis was done by Xmgrace tool (http://plasma-gate.weizmann.ac.il/Grace/).
Results and discussion
Chemistry
The title amide analogues 4a–e and 6a–e were prepared following the previously described methodCitation49 with slight modification shown in and . The 2-amino-p-cymene in the first step is converted into 2-chloro-N-[2-methyl-5-(propan-2-yl)phenyl]acetamide (2) by treating with chloroacetyl chloride in the presence of (C2H5)3N and anhydrous methylene chloride. The structure of the intermediate 2 was ascertained by the presence of amide carbonyl (–NHC=O) stretching at 1,656 cm−1 and –NH stretching at 3,354 cm−1 in FTIR spectra. The compounds 4a–e and 6a–e were synthesized by simple nucleophilic replacement of chloro group from intermediate 2 by carboxylic group (–COOH) of substituted benzoic acids 3a–e and cinnamic acids 5a–e, respectively. The structures of the final products were confirmed by FTIR, 1HNMR and 13CNMR spectral data.
In vitro enzymes inhibition assay
Mushroom tyrosinase and elastase inhibitory activities were determined and it was found that most of the synthesized amides showed better tyrosinase inhibition than standard drug. The hydroxylated amides with cinnamic acid moiety showed higher tyrosinase inhibitory activity than those with benzoic acid residue. The IC50 value of compound 6d bearing 2,4-dihydroxy substituted cinnamic acid functionality was 0.15 µM, which explains its excellent tyrosinase inhibitory activity, whereas the IC50 value of standard kojic acid was 17.20 µM. The same compound (6d) also displayed higher elastase inhibitory potential compared to all other synthesized amide derivatives (). Bioassay results showed that the substitution of hydroxyl groups at phenyl ring is the decisive factor of inhibitory activity.
Table 1 Inhibitory effects of amide derivatives 4a–e and 6a–e on mushroom tyrosinase and porcine pancreas elastase
In vitro human tyrosinase inhibition assays showed that compound 6d exhibited 91.9% inhibitory capacity at 50 µg/mL (). This shows that the amide 6d has a greater potential to inhibit human tyrosinase compared to standard kojic acid (72.9% inhibitory capacity). Hence, we propose that substitution of hydroxyl group in phenyl ring in case of compound 6d impedes the molecule to interact well with the active sites of enzyme. The kinetic analysis and docking studies helped us to explore the mode of binding and residual interactions between the enzyme and synthesized inhibitors.
Table 2 Inhibitory effects of amide derivatives 4a–e and 6a–e on human tyrosinase (from melanoma cells) free radical scavenging
Kinetic mechanism
Among the synthesized amide derivatives, 4c, 6a, 6b and 6d were selected to determine their inhibition type and inhibition constants on mushroom tyrosinase. The potential of these derivatives to inhibit the free enzyme and enzyme–substrate complex was determined in terms of EI and ESI constants, respectively. The kinetic studies of the enzyme by Lineweaver–Burk plot of 1/V versus 1/[l-DOPA] in the presence of different inhibitors concentrations gave a series of straight lines as shown in –. and show that compounds 6a and 6b intersected within the second quadrant. The analysis showed that Vmax decreased with increasing Km in the presence of increasing concentrations of compounds 6a and 6b, respectively. This behavior of compounds 6a and 6b indicated that it inhibits tyrosinase by two different pathways: competitively forming EI complex and non-competitively interrupting ESI complex. The EI dissociation constants Ki ( and ) of compounds 6a and 6b are shown by the secondary plots of slope versus concentration of compounds, whereas the ESI dissociation constants Ki′ are shown by the secondary plots of intercept versus concentration of compounds ( and ). A lower value of Ki than Ki′ pointed out stronger binding between enzyme and compounds 6a and 6b, which suggested preferred competitive over non-competitive manners ().
Table 3 Kinetic parameters of mushroom tyrosinase for L-DOPA activity in the presence of different concentration of compounds 4c, 6a, 6b and 6d
Figure 1 Lineweaver–Burk plots for inhibition of tyrosinase in the presence of amide 4c.
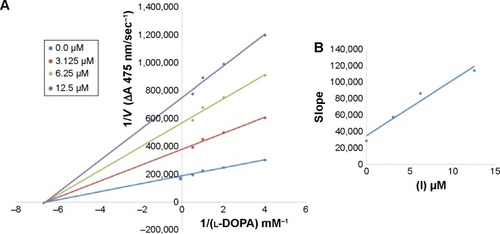
Figure 2 Lineweaver–Burk plots for inhibition of tyrosinase in the presence of amide 6a.
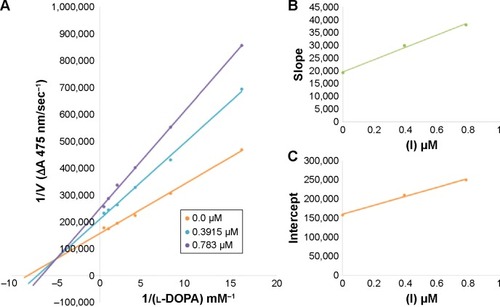
Figure 3 Lineweaver–Burk plots for inhibition of tyrosinase in the presence of amide 6b.
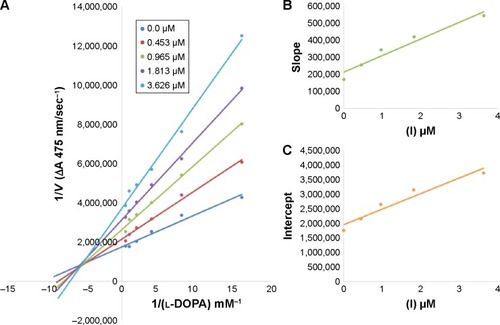
Figure 4 Lineweaver–Burk plots for inhibition of tyrosinase in the presence of amide 6d.
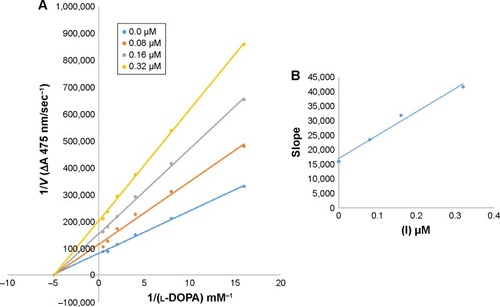
In case of compounds 4c and 6d, Lineweaver-Burk plot gave a family of straight lines, all of which intersected at the same point on the x-axis ( and ). The analysis showed that 1/Vmax increased to a new value but Km remained the same as a result of increase in the concentrations of compounds 4c and 6d. This behavior indicates that compounds 4c and 6d inhibit tyrosinase non-competitively to form EI complex. Secondary plot of slope against concentration of 4c and 6d shows the EI dissociation constant (Ki) ( and ). The inhibi-tory mechanism of mushroom tyrosinase by compounds 6d at different concentrations (0.0, 0.08, 0.16 and 0.32 µM) was investigated. The plots of the remaining enzyme activity versus the concentration of enzyme (4, 6, 8, 10, 15 and 20 µg/mL) at different inhibitor concentrations for the catalysis of l-DOPA gave a series of parallel straight lines with the same slopes indicating that the inhibitory effect of 6d on tyrosinase was irreversible (). These results suggest that the compound 6d effectively inhibited the enzyme by binding to its binuclear active site irreversibly.Citation50
Figure 5 Effect of various doses of mushroom tyrosinase on its activity for the catalysis of l-DOPA against different concentration of inhibitor 6d.
In vivo depigmentation assay in zebrafish
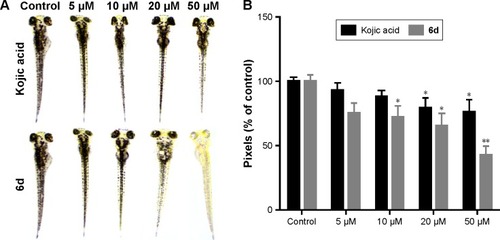
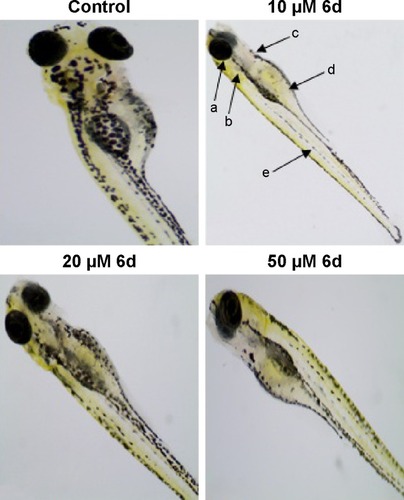
Zebrafish is a very important vertebrate animal model because it possesses similar gene sequence system to human.Citation51 Zebrafish embryos were used to determine the depigmentation activity of compound 6d through in vivo assay. The inhibitory effects of 6d on the pigmentation of zebrafish were evaluated by adding 6d at concentrations of 5, 10, 20 and 50 µM to the embryos, and same concentrations were used for positive control kojic acid. Compound 6d significantly decreased (P<0.05, ) the pigmentation level to about 57.3%, while positive control kojic acid decreased the pigmentation level to 24.2% at 50 µM. Moreover, inhibitor 6d showed better depigmenting effects than kojic acid at 10 and 20 µM.
Figure 6 Effect of inhibitor 6d on pigmentation of zebrafish.
Determination of melanin contents in zebrafish
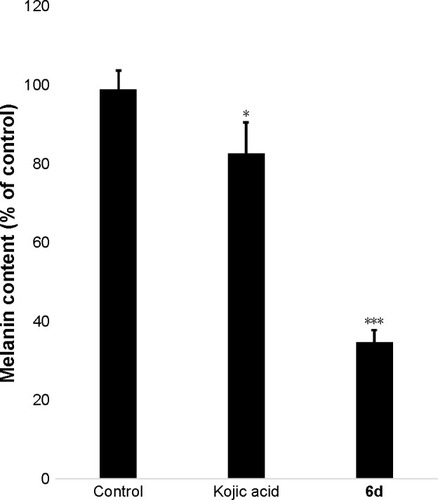
Melanin contents were measured using the extract of zebrafish embryos. Results showed that melanin contents significantly (P<0.001) decreased in the 6d-treated zebrafish embryos at 50 µM compared to non-treated embryos and reference drug. Kojic acid only slightly reduced the melanin contents in zebrafish embryos, whereas 6d highly reduced the melanin contents ().
Figure 7 Inhibitory effects of 6d and kojic acid on melanin contents.
Zebrafish toxicity assay
In addition to the depigmenting capacity, other factors are also important in selecting the lead compound for skin whitening and related disorders. For that purpose, additional in vivo zebrafish toxicity was also performed. In recent years, zebrafish has emerged as an important tool for early screening of toxicity of drugs. Acute toxicity is determined by treating the larvae after 48 hpf with 10, 20 and 50 µM of inhibitor 6d, and fish were examined after 3 days of treatment by staining with acridine orange (). The larvae developed into zebrafish normally without any evidence of apoptotic deformities. This absence of acute toxicity was encouraging for safer drug development. Importantly, no death was recorded in any treatment.
Figure 8 Zebrafish embryos (48 hpf) were treated with 10, 20 and 50 µM of 6d.
Abbreviation: hpf, hours post-fertilization.
Computational studies
Structural assessment of target protein
Mushroom tyrosinase is a class of oxidoreductase copper-containing protein that comprises 391 amino acids. The structure architecture of mushroom tyrosinase showed that it consists of 39% α-helices (154 residues), 14% β-sheets (57 residues) and 46% coils (180 residues). The crystal structure showed its resolution 2.78Å, R-value 0.238 and unit cell crystal dimensions such as length and angles of coordinates. The unit cell length values were observed for a =103.84, b =104.82 and c =119.36 with angles 90°, 110.45° and 90° for all α, β and γ dimensions, respectively. The Ramachandran plots and values indicated that 95.9% of protein residues were present in favored region and 100.0% residues were lie in allowed region. The Ramachandran graph values showed a good accuracy of phi (ϕ) and psi (ψ) angles among the coordinates of receptor, and most of residues were plunged in acceptable region.
Chemo-informatics properties and Lipinski’s RO5
The predicted chemo-informatics properties such as molecular weight (g/mol), molar volume (A3) and polar surface area (PSA) were evaluated by computational tools. The literature study established a standard value for molecular weight (160–480 g/mol) and PSA (x).Citation52 Results showed that all the predicted values of synthesized compounds 4a–e and 6a–e were comparable with standard values. The obtained drug score is very important for various properties such as physicochemical, pharmacokinetics and pharmacodynamics of chemical compound. Higher drug scores mean good drug characteristics.Citation53 The drug scores obtained emphasize that all the synthesized amides 4a–e and 6a–e exhibited drug-like behavior. The highest and lowest drug scores of both 4c and 6a are 1.41 and 0.35, respectively. Moreover, RO5 did not explain anything about the specific chemistry or structural features of the drugs or non-drugs. The computational results showed that all the synthesized compounds possessed <10 HBA, <5 HBD and <5.0 Log P-values, which significantly justified its drug-like behavior. Moreover, their molecular weight was also <500 g/mol, which also justified the compounds’ better drug-like behavior. Rule of 5 indicates that molecules with poor absorption are more likely to have more than 5 HBD, MWT over 500, Log P over 5 and more than 10 HBA. However, there are plenty of examples that explain RO5 violation among the existing drugs.Citation54 In summary, the values obtained justify the significance of the synthesized compounds as good candidate molecules ().
Table 4 Chemo-informatics evaluation of the synthesized compounds
Molecular docking analyses
The docked complexes of all amide derivatives 4a–e and 6a–e were analyzed on the basis of lowest binding energy values (kcal/mol) and hydrogen/hydrophobic bonding analyses. Results showed that 6d was the most active compound with best binding energy value (−7.90 kcal/mol) compared to other derivatives. The docking pose was selected on the basis of energy value and interaction patterns of ligand within the active region of the target protein. The conformational position within the active region of the target protein was confirmed by superimposition. The docked complex of 6d was superimposed against the experimental crystal structure of tyrosinase. Results showed that the ligand 6d actively bound within the binding pocket of the target protein. The docking energy values of all the docking complexes were calculated by the following equation:
ΔGgauss: attractive term for the dispersion of two Gaussian functions,
ΔGrepulsion: square of the distance if closer than a threshold value,
ΔGhbond: ramp function – also used for interactions with metal ions,
ΔGhydrophobic: ramp function,
ΔGtors: proportional to the number of rotatable bonds.
Docking results justified that the synthesized amides 6b, 6d and 6e exhibited good binding energy values (−8.0, −7.9 and −7.9 kcal/mol, respectively). The standard error for Autodock is reported as 2.5 kcal/mol. Though the basic nucleus of all the synthesized compounds was the same, most of the ligands possessed efficient energy values and did not show any significant difference in energy fluctuations. The comparative binding energies of all the docking complexes are presented in .
Figure 9 Docking energies of the synthesized amide derivatives 4a–e and 6a–e calculated using PyRx.
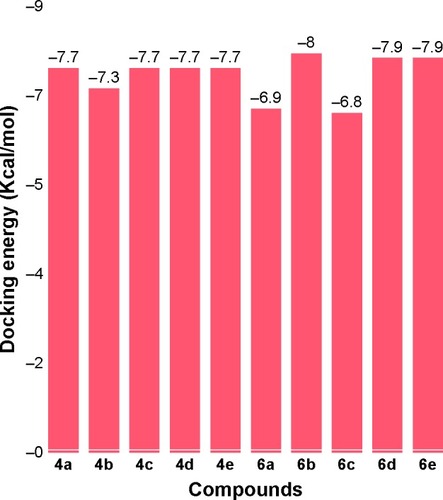
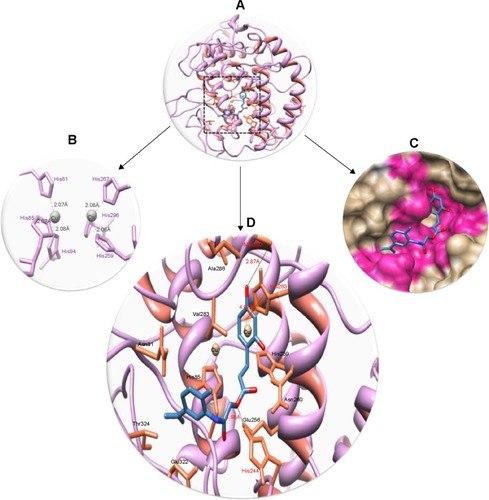
This comparative analysis shows that 6d directly interacts with the active residues of the target protein. The structure–activity relationship analysis showed that 6d formed two hydrogen bonds and one π–π interaction at specific residues His244, Met280 and His363 of target protein. The ester carbonyl oxygen in 6d interacts with His244, while benzyl oxygen moiety interacts with Met280 and forms strong hydrogen bonds with lengths of 1.98Å and 2.87Å, respectively. Another π–π interaction between the benzene and metal-bonded His363 residue was formed with a bond length of 4.07Å. The literature study also justified that these inter-acted residues are significant in the downstream signaling pathways.Citation55 The binding interactions of 6d with the amino acids of the target protein are presented in , and the 2D-generated docking complexes of all ligands are presented in Figures S3–S11.
Figure 10 Docking interactions between 6d and target protein.
MD simulations analyses
Root mean square deviation and fluctuations of target protein
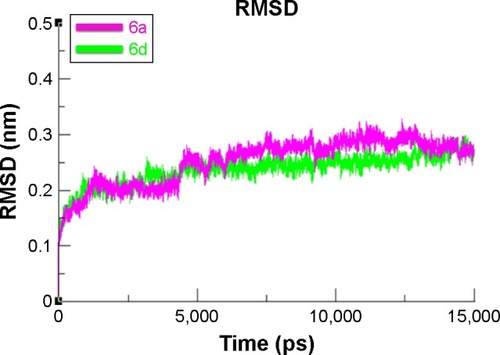
To evaluate the mushroom tyrosinase flexibility and overall stability of docking complexes, we executed time-dependent MD simulation at 15 ns using Gromacs 4.5.4. The residual deviations and fluctuation of the complexes 6a and 6d were determined by root mean square deviation and fluctuation (RMSD/F) graphs generated by Xmgrace software. Both docked complexes were run separately in simulation to check the fluctuating differences of the residual backbone of the target protein. An increasing trend was observed in the graph lines of both complexes with an RMSD value of 0–0.2 nm at time 0–1,250 ps, after which both complexes showed slight fluctuations and attained a little stability from 1,250 to 5,000 ps with a constant RMSD value of 0.2 nm. From 5,000 to 75,000 ps, 6d graph line remained steadily constant and showed no fluctuations, whereas 6a graph line showed an increasing trend and depicted higher RMSD value of 0.25 nm. Comparative analysis showed that 6d had more stable behavior compared to 6a complex. These results justified that the binding of 6d toward the target protein is more stable compared to all other 6a derivative ().
Figure 11 RMSD graph of 6a and 6d at 15 ns.
Abbreviation: RMSD, root mean square deviation.
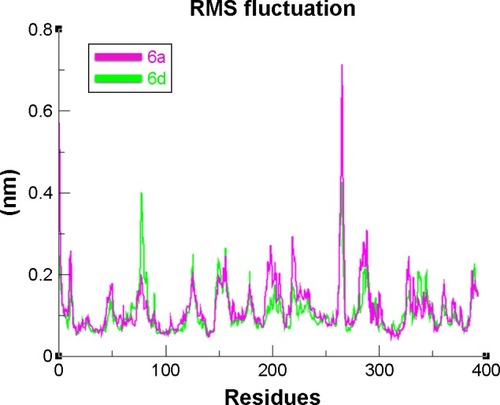
The overall RMSD results justified that 6d did not change the conformational symmetry of the target protein compared to 6a. The RMSF results also reflected that both C- and N-terminal lobes of mushroom tyrosinase are fluctuated throughout the simulation period. Comparative analysis justified that 6d is more stable and less fluctuated throughout the simulation period compared to 6a (). MD simulation graphs showed stable behaviors of 6d docked complex throughout MD trajectories thus increasing the efficacy of docking results.
Figure 12 RMSF graph of 6a and 6d at 15 ns.
Abbreviation: RMSF, root mean square fluctuation.
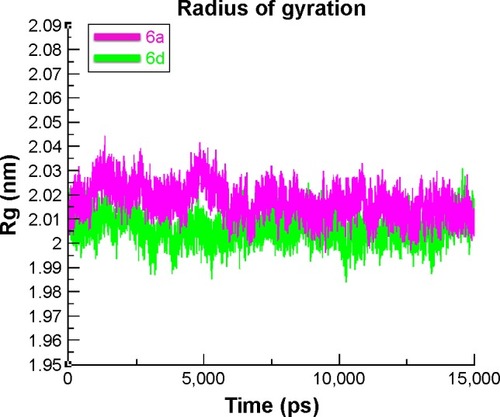
The compactness of the target protein was measured by radius of gyration (Rg). The results obtained for both 6a and 6d showed that the Rg value underwent a little fluctuation between 2 and 2.03 nm throughout the simulation time 0–15 ns. These results justified that the residual backbone and folding of the receptor protein 6d was comparatively stable compared with 6a. The Rg values and graph lines of 6a and 6d are shown in . The solvent accessible surface area and dihedral pattern (Chi) of the target protein are given in Figures S12 and S13.
Figure 13 Radius of gyration (Rg) graphs of 6a and 6d: bound and unbound formats.
Scheme 1 Synthesis of amide derivatives (4a–e).
Scheme 2 Synthesis of amide derivatives (6a–e).
Conclusion
Hydroxylated amide derivatives 4a–e and 6a–e were synthesized following simple reaction routes with excellent yields as melanogenesis inhibitors. The in vitro, in vivo and computational studies proved that compound 6d is a highly potent melanogenesis inhibitor compared to standard kojic acid. Among the synthesized amides, 6d showed excellent mushroom tyrosinase inhibitory activity (IC50 0.15 µM) compared to standard kojic acid (IC50 16.69 µM). The enzyme inhibition kinetics determined by Lineweaver–Burk plots showed that compounds 4c and 6d exhibited non-competitive inhibition, while 6a and 6b exhibited mixed-type inhibitions. The kinetic mechanism further revealed that compound 6d formed irreversible complex with the target enzyme tyrosinase. The Ki values of compounds 4c, 6a, 6b and 6d were 0.188 µM, 0.84 µM, 2.20 µM and 0.217 µM, which shows that compound 6d possessed stronger binding capacity. The same compound 6d also showed an inhibitory activity of 91.9% on human tyrosinase. The in vivo cytotoxicity evaluation of 6d in zebrafish embryos showed that it is non-toxic to zebrafish. The melanin depigmentation assay in zebrafish indicated that compound 6d had a greater potential in decreasing melanin contents compared to kojic acid at same concentration. The computational studies also supported the wet lab findings as the compound 6d exhibited highest binding affinity with the target protein (PDBID: 2Y9X) with a binding energy value of −7.90 kcal/mol. The MD simulation studies also proved that amide 6d formed the most stable complex with tyrosinase. Based upon our in vitro, in vivo and computational studies, we propose that compound 6d is a promising candidate for the development of safe cosmetic agent.
Disclosure
The authors report no conflicts of interest in this work.
References
- LevyCKhaledMFisherDEMITF: master regulator of melanocyte development and melanoma oncogeneTrends Mol Med2006129 406 41416899407
- LinJYFisherDEMelanocyte biology and skin pigmentationNature20074457130 843 85017314970
- RajDBrashDEGrossmanDKeratinocyte apoptosis in epidermal development and diseaseJ Invest Dermatol20061262 243 25716418733
- Sánchez-FerrerARodríguez-LópezJNGarcía-CánovasFGarcía-CarmonaFTyrosinase: a comprehensive review of its mechanismBiochem Biophys Acta199512471 1 117873577
- Van HoldeKEMillerKIDeckerHHemocyanins and invertebrate evolutionJ Biol Chem200127619 15563 1556611279230
- SolminskiAConstantinoRL-tyrosine induces tyrosinase expression via a post transcriptional mechanismExperientia1991477 721 7241906010
- SolminskiAConstantinoRMolecular mechanism of tyrosinase regulation by L-dopa in hamster melanoma cellsLife Sci19914821 2075 20791903481
- SlominskiAPausRAre L-tyrosine and L-dopa hormone-like bioregulators?J Theor Biol19901431 123 1382359315
- ProtaGMelanins and MelanogenesisNew YorkAcademic Press Inc1992
- ProtaGThe chemistry of melanins and related metabolitesFortsch Chem Organ Natur199564 93 148
- KadekaroALKantoHKavanaghRAbdel-MalekZASignificance of the melanocortin 1 receptor in regulating human melanocytes pigmentation, proliferation and survivalAnn N Y Acad Sci2003994 359 36512851336
- PetitLPierardGESkin-lightening products revisitedInt J Cosmet Sci2003254 169 18118494898
- RileyPAMelanogenesis and melanomaPigment Cell Res2003165 548 55212950735
- UongAZonLIMelanocytes in development and cancerJ Cell Physiol20102221 38 4119795394
- YamaguchiYHearingVJMelanocytes and their diseasesCold Spring Harb Perspect Med201445 pii:a017046
- LyndeCBKraftJNLyndeCWTopical treatments for melasma and postinflammatory hyperpigmentationSkin Therapy Lett2006119 1 6
- AsanumaMMiyazakiIOgawaNDopamine- or L-DOPA induced neurotoxicity: the role of dopamine quinone formation and tyrosinase in a model of Parkinson’s diseaseNeurotox Res200353 165 17612835121
- ZhuYJZhouHTHuYHAntityrosinase and antimicrobial activities of 2-phenylethanol, 2-phenylacetaldehyde and 2-phenylacetic acidFood Chem20111241 298 302
- XuYStokesAHRoskoskiRJrVranaKEDopamine, in the presence of tyrosinase, covalently modifies and inactivates tyrosine hydroxylaseJ Neurosci Res1998545 691 6979843160
- MenezesJCKamatSPCavaleiroJAGasparAGarridoJBorgesFSynthesis and antioxidant activity of long chain alkyl hydroxycinnamatesEur J Med Chem2011462 773 77721216503
- MiliovskyMSvinyarovIMitrevYA novel one-pot synthesis and preliminary biological activity evaluation of cis-restricted polyhydroxy stilbenes incorporating protocatechuic acid and cinnamic acid fragmentsEur J Med Chem201366 185 19223796767
- LiuXDHuangHChenQXStudies on inhibitory effects of benzoic acid on mushroom tyrosinaseJ Xiamen Univ Natur Sci2003421 102 106
- ChenQXSongKKQiuLLiuXDHuangHGuoHYInhibitory effects on mushroom tyrosinase by p-alkoxybenzoic acidsFood Chem2005912 269 274
- TakahashiTMiyazawaMSynthesis and structure–activity relationships of phenylpropanoid amides of serotonin on tyrosinase inhibitionBioorg Med Chem Lett2011217 1983 198621377874
- AshrafZRafiqMSeoSYBabarMMZaidiNSSDesign, synthesis and bioevaluation of novel umbelliferone analogues as potential mushroom tyrosinase inhibitorsJ Enzyme Inhib Med Chem2015306 874 88325643758
- KraunsoeJAClaridgeTDLoweGInhibition of human leukocyte and porcine pancreatic elastase by homologues of bovine pancreatic trypsin inhibitorBiochemistry19963528 9090 90968703913
- KimSJSanchetiSASanchetiSSUmBHYuSMSeoSYEffect of 1, 2, 3, 4, 6-penta-O-galloyl-beta-D-glucose on elastase and hyaluronidase activities and its type II collagen expressionActa Pol Pharm2010672 145 15020369791
- ReddyCVKSreeramuluDRaghunathMAntioxidant activity of fresh and dry fruits commonly consumed in IndiaFood Res Int2010431 285 288
- AshrafZRafiqMSeoSYBabarMMZaidiNSSSynthesis, kinetic mechanism and docking studies of vanillin derivatives as inhibitors of mushroom tyrosinaseBioorg Med Chem20152317 5870 588026204890
- AshrafZRafiqMSeoSYKwonKSBabarMMZaidiNSSKinetic and in silico studies of novel hydroxy-based thymol analogues as inhibitors of mushroom tyrosinaseEur J Med Chem201598 203 21126025140
- SugimotoKNishimuraTNomuraKSugimotoKKurikiTSyntheses of arbutin-alpha-glycosides and a comparison of their inhibitory effects with those of alpha-arbutin and arbutin on human tyrosinaseChem Pharm Bull (Tokyo)2003517 798 80112843585
- FunayamaMNishinoTHirotaAMuraoSTakenishiSNakanoHEnzymatic synthesis of (+) catechin-α-glucoside and its effect on tyrosinase activityBiosci Biotech Biochem19935710 1666 1669
- ChoiT-YKimJ-HKoDHZebrafish as a new model for phenotype-based screening of melanogenic regulatory compoundsPigment Cell Res2007202 120 12717371438
- HsuKDChenHJWangCSExtract of Ganoderma formosanum mycelium as a highly potent tyrosinase inhibitorSci Rep20166 3285427611175
- BaekSHLeeSHSesamol decreases melanin biosynthesis in melanocyte cells and zebrafish: possible involvement of MITF via the intracellular cAMP and p38/JNK signalling pathwaysExp Dermatol20152410 761 76626010596
- ThompsonMJLouthJCFerraraSDiscovery of 6-substituted indole-3-glyoxylamides as lead antiprion agents with enhanced cell line activity, improved microsomal stability and low toxicityEur J Med Chem2011469 4125 413221726921
- PettersenEFGoddardTDHuangCCUCSF Chimera – a visualization system for exploratory research and analysisJ Comput Chem20062513 1605 1612
- LovellSCDavisIWArendallWB3rdStructure validation by Calpha geometry: phi, psi and Cbeta deviationProteins2002503 437 450
- ChenVBArendallWB3rdHeaddJJMolProbity: all-atom structure validation for macromolecular crystallographyActa Crystallogr D Biol Crystallogr201066Pt 1 12 2120057044
- Discovery Studio Version 2.1San Diego, CAAccelrys2008 Available from: http://accelrys.com/products/collaborative-science/biovia-discovery-studio/requirements/technical-requirements-450.htmlAccessed June 1, 2017
- WillardLRanjanAZhangHVADAR: a web server for quantitative evaluation of protein structure qualityNucleic Acids Res20033113 3316 331912824316
- DallakyanSOlsonAJSmall-molecule library screening by docking with PyRxMethods Mol Biol20151263 243 25025618350
- WallaceACLaskowskiRAThorntonJMLIGPLOT: a program to generate schematic diagrams of protein-ligand interactionsProtein Eng199682 127 134
- PronkSPallSSchulzRGROMACS 4.5: a high-throughput and highly parallel open source molecular simulation toolkitBioinformatics2013297 845 85423407358
- ChiuSWPanditSAScottHLJakobssonEAn improved united atom force field for simulation of mixed lipid bilayersJ Phys Chem B20091139 2748 276319708111
- SchüttelkopfAWvan AaltenDMFPRODRG: a tool for high-throughput crystallography of protein-ligand complexesActa Crystallogr D Biol Crystallogr200460Pt 8 1355 136315272157
- WangHDommertFHolmCOptimizing working parameters of the smooth particle mesh Ewald algorithm in terms of accuracy and efficiencyJ Chem Phys20101333 03411720649318
- AmiriSSansomMSBigginPCMolecular dynamics studies of AChBP with nicotine and carbamylcholine: the role of water in the binding pocketProtein Eng Des Sel2007207 353 35917595341
- AshrafZAlamgeerRasoolRSynthesis, bioevaluation and molecular dynamic simulation studies of dexibuprofen–antioxidant mutual prodrugsInt J Mol Sci20161712 2151
- ChenZCaiDMouDDesign, synthesis and biological evaluation of hydroxy- or methoxy-substituted 5-benzylidene (thio) barbiturates as novel tyrosinase inhibitorsBioorg Med Chem20142213 3279 328424857777
- VeldmanMBLinSZebrafish as a developmental model organism for pediatric researchPediatr Res2008645 470 47618679162
- KadamRURoyNRecent trends in drug-likeness prediction: a comprehensive review of in silico methodsIndian J Pharm Sci200769 609 615
- BakhtMAYarMSAbdel-HamidSGAl-QasoumiSISamadAMolecular properties prediction, synthesis and antimicrobial activity of some newer oxadiazole derivativesEur J Med Chem20104512 5862 586920965619
- TianSWangJLiYLiDXuLHouTThe application of in silico drug-likeness predictions in pharmaceutical researchAdv Drug Del Rev201586 2 10
- ChenWCTsengTSHsiaoNWDiscovery of highly potent tyrosinase inhibitor, T1, with significant anti-melanogenesis ability by zebrafish in vivo assay and computational molecular modelingSci Rep20155 799525613357