
Liu Y, Zhang N, Zhang H, et al. Drug Des Devel Ther. 2020;14:3535–3545.
The authors have advised due to an error at the time of figure assembly, on page 3543 is incorrect. The correct is as follows.
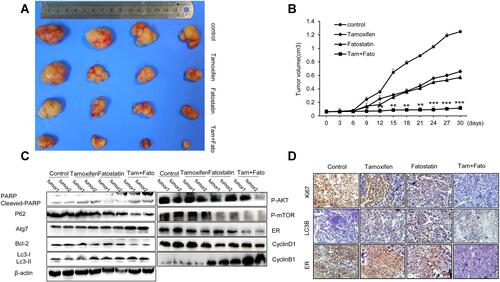
Figure 7 Effects of fatostatin and tamoxifen on the growth of ER-positive breast cancer in vivo. (A) Images of the xenograft tumours in nude mice implanted with MCF-7 cells (1×10⁷) and treated with PBS, tamoxifen, fatostatin or a combination of tamoxifen and fatostatin (n=4 in each group). (B) Tumour growth curves of each treated group. The tumour volumes were assessed on the indicated days. (C) Western blot assay showing the protein expression levels of cleaved PARP, P62, Atg7, Bcl-2, LC3B, p-AKT, p-mTOR, ER, Cyclin D1 and Cyclin B1 among each group. (D) IHC analysis of Ki67, LC3B and ER expression in breast cancer at 20x magnification. Scale bars: 20 μm. The data are representative of independent experiments (means ± SD) using one-way analysis of variance (ANOVA) to analyze the differences among groups. *p < 0.05; **p < 0.01; ***p < 0.001 vs the control group.
The authors apologize for this error and advise it does not affect the results of the paper.