
Abstract
Objective
Corneal permeability of drugs is an important factor used to assess the efficacy of topical preparations. Transcorneal penetration of drugs from aqueous formulation is governed by various physiological, physiochemical, and formulation factors. In the present study, we investigated the effect of formulation factors like concentration, pH, and volume of instillation across the cornea using cassette dosing technique for ophthalmic fluoroquinolones (FQs).
Materials and methods
Sterile cocktail formulations were prepared using four congeneric ophthalmic FQs (ofloxacin, sparfloxacin, pefloxacin mesylate, and gatifloxacin) at concentrations of 0.025%, 0.5%, and 0.1%. Each formulation was adjusted to different pH ranges (4.5, 7.0, and 8.0) and assessed for transcorneal penetration in vivo in rabbit’s cornea (n=4 eyes) at three different volumes (12.5, 25, and 50 μL). Aqueous humor was aspirated through paracentesis after applying local anesthesia at 0, 5, 15, 30, 60, 120, and 240 minutes postdosing. The biosamples collected from a total of 27 groups were analyzed using liquid chromatography–tandem mass spectroscopy to determine transcorneal permeability of all four FQs individually.
Results
Increase in concentration showed an increase in penetration up to 0.05%; thereafter, the effect of concentration was found to be dependent on volume of instillation as we observed a decrease in transcorneal penetration. The highest transcorneal penetration of all FQs was observed at pH 7.0 at concentration 0.05% followed by 0.025% at pH 4.5. Lastly, increasing the volume of instillation from 12.5 to 50 μL showed a significant fall in transcorneal penetration.
Conclusion
The study concludes that formulation factors showed discernible effect on transcorneal permeation; therefore, due emphasis should be given on drug development and design of ophthalmic formulation.
Introduction
Ophthalmic drugs have mainly originated from oral dosage forms without much scientific exploration and rationale, which has led to their low ocular bioavailability. Even the drugs administered systemically have poor access to eye because of the blood–aqueous and blood–retinal barriers.Citation1 Topical instillation is a common mode to combat ocular infections even though a large amount of drugs are eliminated from precorneal surface leading to low bioavailability (>5%). Additionally, cornea acts as an effective barrier for drug penetration due to the annular tight junctions (zonula occludens) in corneal epithelium.Citation2
Although ophthalmic drugs were not given much importance in the past, recently, various formulational approaches have been attempted to circumvent their shortcomings and improve the ocular pharmacokinetics.Citation3 There are numerous factors which affect transcorneal penetration of drug across cornea mainly the formulation factors (concentration, pH, volume of instillation, irrigant preservatives, osmolarity, viscosity, bioadhesive nature, etc), physiological factors (small absorptive surface and low transparency of cornea, lipophilicity of corneal epithelium, etc), and physiochemical factors (degree of ionization of drug in tear film, nonspecific irritation by drug leading to reflux tear flow, metabolism, enzymolysis, bonding of the drug with proteins contained in tear fluid, defense mechanisms, etc).Citation4,Citation5
Topical fluoroquinolones (FQs) are commonly used in ocular bacterial infections due to their unprecedented mode of action, broad-spectrum bactericidal activity equally comparative to other semi-synthetic antibiotics, low toxicity, etc. Currently, various FQs (ciprofloxacin, sparfloxacin, ofloxacin, pefloxacin mesylate, moxifloxacin, and gatifloxacin) represent the leading ophthalmic products.Citation1,Citation6,Citation7
Cassette dosing is a high-throughput screening technique to increase throughput and reduce animal use.Citation8,Citation9 The technique requires selective bioanalytical methods to quantitate each of the administered compounds in each collected sample. The use of sophisticated analytical tools like liquid chromatography–tandem mass spectroscopy (LC–MS/MS) has enabled the quantification of drugs in minuscule samples.Citation10–Citation12
Limited studies have been reported with the use of cassette dosing technique to determine in vitro permeability coefficient of drugs.Citation13–Citation15 Some studies have reported the de novo methods to determine corneal permeability in experimental animals.Citation16,Citation17 Limited studies have been reported on use of this to determine in vivo transcorneal permeability of drugs. Moreover, the reported in vitro ocular studies still remain uncorroborated due to the absence of several precorneal dynamic factors, which emerge during the actual in vivo process. Recently, a finding from our laboratory showed the correlation between the pharmacokinetic profiles derived from in vivo cassette dosing data with corneal permeability for the successful quantitative structure–property relationship approach.Citation18 Further, a detailed systematic study on effect of various formulation factors on corneal permeability was considered important for ocular-specific drug development. Therefore, the present study was conceived to study the effect of formulation factors like concentration of drug, pH of the formulation, and volume of drug instillation on transcorneal permeation of FQs using cassette dosing in rabbits. The congeneric topically used FQs, viz ofloxacin, sparfloxacin, pefloxacin mesylate, and gatifloxacin, were selected, and their transcorneal penetration across the cornea was determined using LC–MS/MS.
Materials and methods
Chemicals and equipment
Pure standard powder of ofloxacin, pefloxacin mesylate, sparfloxacin (Cipla Ltd., Mumbai, India), and gatifloxacin (Sun Pharma, Mumbai, India) was obtained as gratis samples. Other chemicals like acetonitrile of mass spectroscopy (MS) grade (E. Merck, Darmstadt, Germany), methanol of high-performance liquid chromatography (HPLC) grade (SD Fine Chemicals Ltd., Mumbai, India), formic acid of MS grade (E.22q Merck, KGaA, Darmstadt, Germany), hydrochloric acid of analytical reagent (AR) grade (SD Fine Chemicals Ltd.), ortho-phosphoric acid of AR grade (Spectrochem Private Ltd, Mumbai, India), boric acid of AR grade (Qualigens, Mumbai, India), sodium hydroxide of AR grade (Central Drug Labs, Kolkata, India), xylocaine (4%) (Astra IDL, Bangalore, India), and 0.22 μm filters (E. Merck) were procured from their standard commercial suppliers. Water was produced in-house by Milli-Q purification system (Millipore, Billerica, MA, USA).
The protocol was approved by the standing animal ethics committee of All India Institute of Medical Sciences, India. The Institutional Animal Ethics Committee clearance number is 418/0708. New Zealand albino rabbits of either sex (1.5–2 kg) were procured from central animal house facility. The animals were housed in a temperature-controlled room at 24°C±2°C and humidity 55%±15% and given food and water ad libitum. All experiments were performed in accordance with the Association for Research in Vision and Ophthalmology Statement for the Use of Animals in Ophthalmic and Vision Research.
Preparation of the cocktail formulation
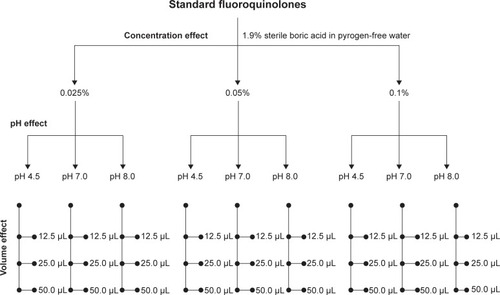
The sterile cocktail formulation was prepared from four ophthalmic FQs pure standard powder using cassette dosing (N-in-One) technique. Ofloxacin, sparfloxacin, pefloxacin mesylate, and gatifloxacin were dissolved as cocktail at three different concentrations using sterile boric acid (1.9%) in pyrogen-free water. All the formulations were passed through 0.22 μm Millipore filters and autoclaved at 15 lbs for 20 minutes and stored in a cool, dark place.
Effect of concentration on transcorneal penetration
The cocktail formulation containing ofloxacin, sparfloxacin, pefloxacin mesylate, and gatifloxacin was prepared at three different concentrations, viz 0.1%, 0.05%, and 0.025%, in boric acid (1.9%) in pyrogen-free water using the protocol described earlier.
Effect of pH range on transcorneal penetration
Each of the three formulations were adjusted to three different pH ranges of 4.5, 7.0, and 8.0 using dilute acid or base. The osmolarity of all the prepared topical formulations was found to be between 285 and 300 mOsm as measured using micro-osmometer (Precision Systems Inc, Basking Ridge, NJ, USA).
Effect of volume of instillation on transcorneal penetration
To study the effect of volume of instillation on transcorneal penetration, each sterile cocktail FQ formulation was instilled at three different volumes, viz 12.5, 25.0, and 50.0 μL, to the cornea of rabbit eyes (n=4 eyes).
In vivo study in rabbits
All the formulations prepared were individually studied in rabbits. Each formulation was instilled into the lower fornix of rabbit eyes (n=4) at three different drop volumes. The aqueous humor was aspirated using paracentesis at different time intervals at 5, 15, 30, 60, 120, and 240 minutes postdose. Aspiration was performed by carefully inserting sterile 31 G hypodermic needle (facing bevel up) through corneal limbus after instillation of xylocaine (4%) as topical anesthesia. Topical gentamicin was instilled three times a day for 1 day at the end of experiment to avoid any infection. At each time point, 50 μL of aqueous humor was aspirated, and a gap of 1 week was given between two consecutive experiments. All the biosamples obtained were stored at −80°C until quantification by LC–MS/MS. The schematic representation of study design is depicted in .
Figure 1 Schematic representation of the study design.
Quantification of biosamples using LC–MS/MS
The instrument used for quantification of biosamples was 4000Q trap MS/MS (MDS SCIEX; Applied Biosystems, Foster City, CA, USA) with electrospray ionization in positive mode. The system was controlled by inbuilt Analyst (ver1.4.2) software. The mass scanning was performed using multiple reaction monitoring mode with singly charged ion in positive polarity.
The analytical separation was achieved using Purospher® STAR RP-18 end-capped cartridge column (3 μm) and 55 mm × 4 mm cartridge column (Merck, Darmstadt, Germany). The column oven temperature was set at 30°C, and the tray temperature was maintained at 15°C. Gradient mobile phase containing acetonitrile with formic acid (0.1%) and water with formic acid (0.1%) was employed. All the solvents were passed through 0.22 μm Millipore filters and were degassed using online inbuilt degasser.
Sample preparation
Analytes for LC–MS/MS were extracted using a deproteinating solvent made of 0.1% formic acid in pure acetonitrile. Gemifloxacin mesylate was used as the internal standard for all the biosamples. The solvent was mixed with aqueous humor at a ratio of 2:1, vortexed, and then subjected to centrifugation using a microcentrifuge (Remi Scientific, Mumbai, India) at 8,000× g for 15 minutes. The clear supernatant obtained was subjected for quantification.
Statistical analysis
Statistical analysis was performed using software like Sigma Plot 11.0 and Sigma Stat 3.5 for all the data sets. All the pharmacokinetic parameters were derived for each FQ. Area under curve (AUC) and percentage penetration were calculated using linear trapezoidal rule and absolute amount of FQ instilled into rabbit cornea. Three-way or two-way analysis of variance was applied to compare the effect of different concentrations, pH of the formulation, and volumes of drug instillation for all data sets. For pairwise comparison, multiple procedures using Bonferroni t-test were employed, and P<0.05 was considered as statistically significant.
Results
Sterile cocktail formulation was instilled in 27 groups with 24 biosamples in each group. All the nine formulations had osmolarity between 285 and 300 mOsm. No sign of toxicity or irritation was observed during the study. The biosamples were quantified for the levels of ofloxacin, sparfloxacin, pefloxacin mesylate, and gatifloxacin in aqueous humor. A highly sensitive LC–MS/MS method was developed to elute all the FQs in single run using gradient mobile phase. A gradient method was developed to elute all the studied FQs in single run with different retention times. The mobile phase consisted of water (with 0.1% formic acid) and acetonitrile (with 0.1% formic acid) at a gradient flow rate of 0.5–1.0 mL/min for 5 minutes.
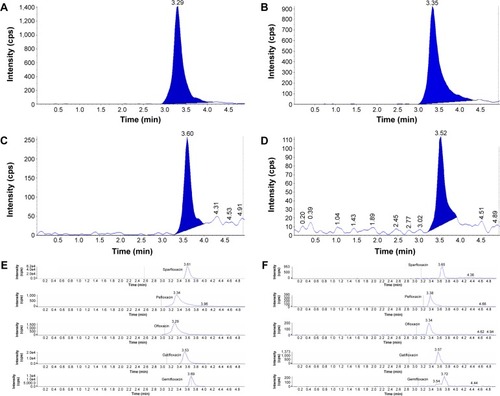
The spectral masses and different parameters used for the analysis of the FQs are tabulated in . shows a representative LC–MS spectra for all the FQs. Adequate quality control and blank samples were run in between the groups to avoid analytical errors during estimation. The AUC was calculated for each data set, and the mean AUC was determined for each formulation. The transcorneal penetration was calculated as (mean AUC/absolute amount of drug instilled) ×100 for each formulation.
Table 1 Spectral masses and different parameters used for the analysis of the fluoroquinolones
Figure 2 LC-MS spectra for all the fluoroquinolones.
Abbreviation: LC–MS, liquid chromatography–mass spectrometry.
Effect of concentration on transcorneal penetration
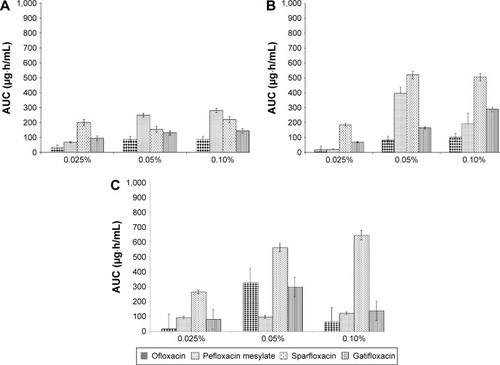
At pH 4.5, for all the studied FQs, increasing the concentration from 0.025% to 0.05% significantly decreased the percentage penetration (P<0.001). Further increasing the FQs concentration to 0.1% showed a significant decrease in the percentage penetration (P<0.001). At pH 7.0, increasing FQs concentration from 0.025% to 0.05% significantly increased transcorneal penetration (P<0.001). However, increasing the concentration to 0.05% showed a significant effect of volume of drug instillation on the percentage penetration (P<0.001). Further increasing the concentration to 0.1% showed a fall in percentage penetration as compared to 0.05%. At pH 8.0, increasing the concentration from 0.025% to 0.5% increased the transcorneal penetration significantly (P<0.05). Similar to pH 7.0, further increasing the concentration from 0.05% to 0.1% significantly decreased the percentage penetration (P<0.001). Also, concentration 0.05% showed a significant effect of volume of drug instillation on the percentage penetration (P<0.001). – show the AUC graphs for individual FQs at different pH and volumes of instillation as 12.5, 25, and 50 μL. Overall effect on transcorneal penetration was found to be increasing at all the FQs concentration from 0.025% to 0.05% for the pH 7.0–8.0 as shown by a linear increase followed by a fall in transcorneal penetration (P<0.001). The net effect of concentration on percentage penetration of FQs was dependent on volume of drug instillation up to an extent and was followed by a fall.
Figure 3 Effect of different concentrations at pH 4.5 (A), pH 7.0 (B), and pH 8.0 (C) on transcorneal penetration of FQs at volume of instillation of 12.5 μL.
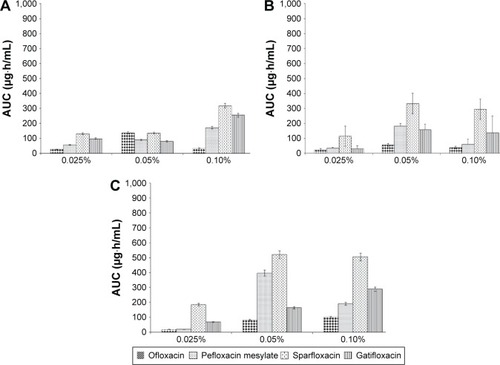
Figure 4 Effect of different concentrations at pH 4.5 (A), pH 7.0 (B), and pH 8.0 (C) on transcorneal penetration of FQs at volume of instillation of 25 μL.
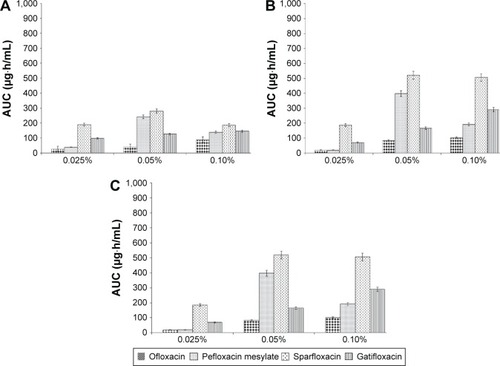
Figure 5 Effect of different concentrations at pH 4.5 (A), pH 7.0 (B), and pH 8.0 (C) on transcorneal penetration of FQs at volume of instillation of 50 μL.
Effect of pH on transcorneal penetration
At all pH ranges varying from pH 4.5 to 8.0, both 12.5 and 25 μL drop volumes were taken for cumulative effect analysis. Highest penetration of all the FQs was observed at the pH 7.0 at the concentration of 0.05% followed by 0.025% at pH 4.5. Increasing the pH from 4.5 to 8.0 at both lower and higher FQ concentrations (0.025% and 0.1%) showed a significant fall (P<0.001) in the transcorneal penetration, whereas at pH 7.0, concentration 0.05% showed a significant increase in transcorneal penetration. This effect was followed by a significant fall when increasing further to pH 8.0. – show the effect of different pH on transcorneal penetration of FQs at concentration of 0.025%, 0.05%, and 0.1% with drop volume of 12.5, 25, and 50 μL.
Figure 6 Effect of different pH on transcorneal penetration of FQs at concentration of 0.025% (A), 0.05% (B), and 0.1% (C) with drop volume of 12.5 μL.
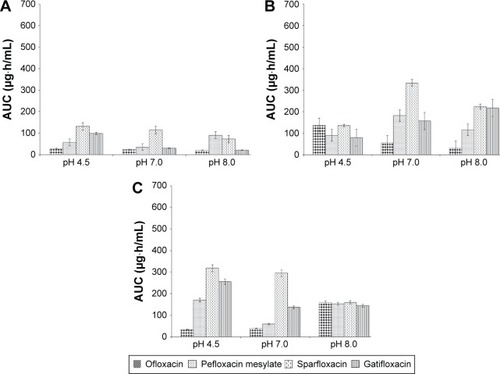
Figure 7 Effect of different pH on transcorneal penetration of FQs at concentration of 0.025% (A), 0.05% (B), and 0.1% (C) with drop volume of 25 μL.
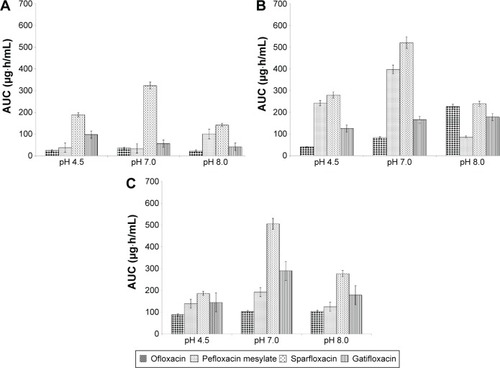
Figure 8 Effect of different pH on transcorneal penetration of FQs at concentration of 0.025% (A), 0.05% (B), and 0.1% (C) with drop volume of 50 μL.
Effect of volume of instillation on transcorneal penetration
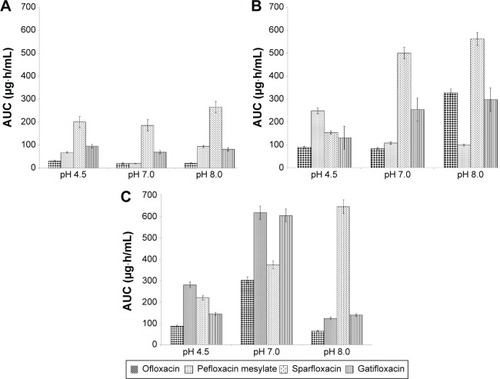
Increasing the volume of drug instillation from 12.5 to 25 μL at the pH 4.5 showed a significant decrease in percentage penetration at concentration from 0.025% to 0.1% (P<0.05) for all the studied FQs. Further increase in the volume of drug instillation from 25 to 50 μL reduced the transcorneal penetration significantly (P<0.05) as compared to 25 μL. The overall effect of pH 4.5 showed a decrease in transcorneal penetration while increasing the volume of drug instillation (P<0.001).
At the concentration of 0.05% and pH 7.0, increasing the volume of drug instillation from 12.5 to 25 μL showed a slight decrease in transcorneal concentration of FQs (P<0.05). Further increase in volume of drug instillation showed a decrease in the transcorneal penetration. Subgroup analysis at pH 7.0 showed a significant rise in the levels of sparfloxacin (P<0.05). The overall effect shows that increasing volume of instillation at the pH 7.0 decreases transcorneal penetration significantly (P<0.001).
At the concentration of 0.05% and pH 8.0, increasing the volume of drug instillation from 12.5 to 25 μL showed a significant decrease in transcorneal penetration (P<0.001) for FQs. Further increase in volume to 50 μL decreases the percentage transcorneal penetration that was found to be statistically insignificant. Net effect of volume of drug instillation on all studied FQs concentration showed significant decrease (P<0.001).
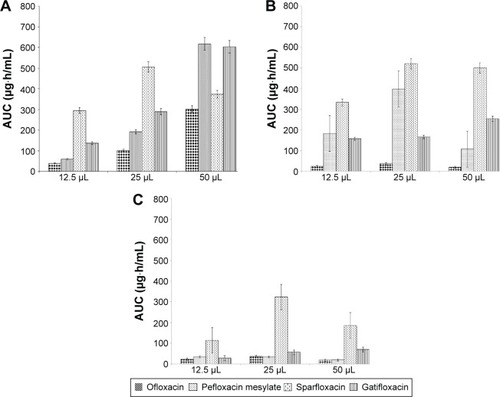
The mean transcorneal penetration showed that irrespective of the pH, increasing the instilled volume of drug instillation from 12.5 to 50 μL showed a significant fall in the penetration for the FQs (P<0.001). – show the AUC graphs for individual FQs at pH 4.5, pH 7.0, and pH 8.0 and concentration of 0.025%, 0.05%, and 0.1%, respectively.
Figure 9 Effect of different volumes of instillation at pH 4.5 (A), pH 7.0 (B), and pH 8.0 (C) on transcorneal penetration of FQs at the concentration of 0.025%.
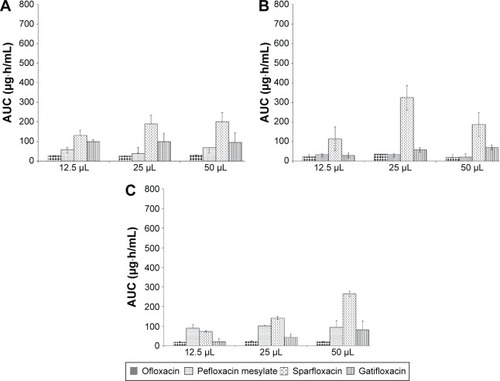
Figure 10 Effect of different volumes of instillation at pH 4.5 (A), pH 7.0 (B), and pH 8.0 (C) on transcorneal penetration of FQs at the concentration of 0.05%.
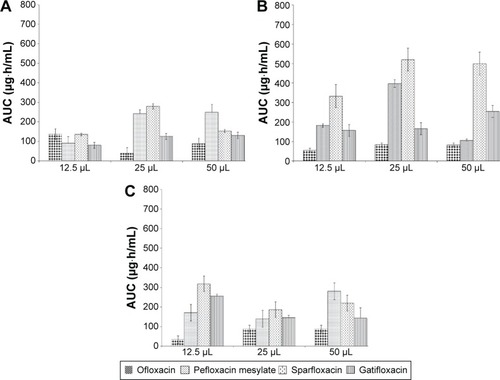
Figure 11 Effect of different volumes of instillation at pH 4.5 (A), pH 7.0 (B), and pH 8.0 (C) on transcorneal penetration of FQs at the concentration of 0.1%.
Discussion
Cassette dosing (N-in-One) is a high-throughput screening technique, which accelerates the drug discovery process. It has been well exploited to study pharmacokinetics of drugs for various indications leading to lead optimization. This technique allows to investigate more test items while using fewer animals, and hence, reducing the costs. In counterpart, its disadvantages are the potential drug–drug interaction and more challenging analytical procedure. A highly selective and sensitive analytical method is required to detect multiple compounds in a single sample simultaneously. Limited studies report the utility of this technique in ophthalmic drug discovery. A few studies report the in vitro corneal permeability either using cassette dosing technique or individually studying the effect of formulation factors on the transcorneal penetration of FQ (moxifloxacin and gatifloxacin).Citation16,Citation17,Citation19,Citation20 However, none of these studies were conducted considering the actual dynamic system which exists in an in vivo setting which depends upon bundle of factors like concentration, lipophilic and hydrophilic properties, degree of dissociation, surface activity, osmotic pressure, and reactivity with corneal tissue.
In our laboratory, we had previously engaged cassette dosing technique to develop a novel in silico model using quantitative structure–property relationship approach with molecular descriptors like log P, pKa, GAP (difference in EHUMO − ELUMO), and topological polar surface area along with in vivo corneal permeability. The study was performed at concentration of 0.1% and volume of instillation as 50 μL using HPLC with a few descriptors.Citation18 In another study, an ayurvedic polyherbal eye drop (Itone™) was studied for anti-angiogenic, anti-inflammatory, anti-cataract, antioxidant, and cytotoxic activity in addition to the evaluation of intraocular penetration in rabbit eyes using LC–MS/MS.Citation21 However, in the present study, we comprehensively investigated the effect of formulation factors like concentration, pH, and volume of instillation across the cornea using cassette dosing technique for ophthalmic FQs in an in vivo setting.
Four topically used ophthalmic FQs, viz ofloxacin, sparfloxacin, pefloxacin mesylate, and gatifloxacin, were selected based upon their log P values and solubility profile to prepare a cocktail formulation. The formulations were prepared at three different concentrations (0.025%, 0.05%, and 0.1%) and adjusted to three different pH values (4.5, 7.0, and 8.0), which were instilled at three different volumes (12.5, 25, and 50 μL) into rabbit’s cornea. To avoid any toxic effect of the FQs, maximum dose of the individual FQ was kept as 0.1% in the cocktail formulation. No mortality or any adverse effect was observed during the entire study. There was significant reduction in total duration for conduct of study and inter-animal variability as same rabbits were used after a washout period of 1 week. In contrast to our earlier study wherein quantification of biosamples was performed using HPLC,Citation18 in the present study, we used LC–MS/MS as analytical technique to quantify the FQs in aqueous humor. A highly sensitive LC–MS/MS method was developed which was able to elute and quantify four FQs in a single run at different retention times. For statistical analysis, AUC was calculated using linear trapezoidal method to determine transcorneal penetration.
In the present study, boric acid (1.9%) was used as vehicle for the preparation of cocktail formulations as it has been reported to be an appropriate vehicle for dissolving compounds with basic nature.Citation22 Also, boric acid has no interaction with divalent and monovalent cations and thus became a solvent of choice.Citation23 Although most of the eye drop formulations contain small amount of benzalkonium chloride (0.005%), in the present study, we did not add any preservative. The cocktail formulation was freshly prepared prior to the animal study and was not stored further to avoid any deterioration of FQs or interference with analytical procedure.
In the literature, there are few studies reporting the intraocular penetration of commercially available FQ eye drops after topical instillation into rabbit eyes. They report a good intraocular penetration across cornea, aqueous humor, and anterior vitreous, and they may be considered the penetrative FQs.Citation24–Citation26 All these studies were conducted on commercially available formulations and reported the intraocular penetration; however, in the present study, we emphasized the role of different concentrations in transcorneal penetration. We observed that effect of concentration on transcorneal penetration of FQs is dependent on volume of drug instillation up to an extent, and beyond that, there was a decrease in penetration. As we found, increasing all the FQs concentration from 0.025% to 0.05% at pH 7.0–8.0 shows a linear increase in transcorneal penetration followed by a fall (P<0.001). Our findings were similar to those of Mitra and MikkelsonCitation27 and Maurice,Citation28 which report that maximum corneal penetration can be achieved by not only increasing solution concentration but also increasing precorneal contact time at appropriate pH/pKa to offer optimal lipid solubility.Citation27,Citation28
Lal et al have previously reported that decrease in volume of instillation into the eye increases the fraction of the dose absorbed into the ocular tissue leading to decrease in adverse drug reactions. The findings of that study showed that drop volumes of 10 and 20 μL produced more miosis and less side effects than 40 and 80 μL in healthy human volunteers. This may be due to more penetration of the drug into the ocular tissue and less drainage into the nasolacrimal system.Citation29 Another study by Kumar et al also reported the optimal drop volume of <20 μL both from the biopharmaceutical and economic point of view as larger volumes induce risk of adverse systemic effects due to absorption of the drug via the nasal mucosa.Citation30 Also, studies report that low-volume method provides a better correlation to human eye irritation experience for some substances.Citation31 In the present study, we comprehensively evaluated the effect of volume of instillation along with concentration and pH in an in vivo setting which has not been reported so far in literature. Our study showed that volume and pH of formulation are directly related to transcorneal penetration. At all the three studied pH (4.5, 7.0, and 8.0) levels, we found that increasing volume of instillation from 12.5 to 25 μL decreases transcorneal penetration significantly (P<0.001).
The corneal pH is reported to have therapeutic and diagnostic significance which attributes in understanding the complexities of disease processes and intolerance of eyes.Citation32 As the permeability of weak acids and weak bases is affected by pH, the increase in fraction of un-ionized molecules increases the lipophilicity and ocular absorption. The solubility and stability and corneal permeability of the drugs are quite dependent on pH. If the pH of formulation is outside the physiological range, eye irritation or ocular discomfort accompanied by an increase in fluid secretion to aid in the restoration of normal physiological conditions exists. Suhonen et al studied effect of pH on the different pilocarpine delivery as prodrug and as pilocarpine alone. The study showed an increase in corneal permeability when the pH was decreased from 7.65 to 5.5. The effect of pH on pilocarpine delivery as prodrug is dependent on prodrug structure, and the advantage gained with prodrugs relative to pilocarpine is dependent on formulation pH.Citation33 Kompa et al explored the effects of different irrigating solutions on intracameral pH, intraocular pressure, and histological findings after inducing burns using alkali in rabbit eyes. With regard to pH measurements, their findings suggest that the diluting effect produced by hypo-osmolar irrigants was effective in inhibiting elevated pH levels. However, to this date, there is no similar animal study, which also explores the effects of eye drops on ocular surface pH.Citation34 In the present study, we found that maximum corneal penetration of all studied FQs was observed at pH 7.0 which is dependent on the concentration (a maximum of 0.05% followed by 0.025%). Also, we observed that increase in pH to 8.0 at both lower and higher FQ concentrations leads to significant fall in transcorneal penetration. Wei et al studied the effect of pH on the permeability of timolol in rabbit cornea in vitro. The study showed that timolol penetrated mainly as a free base by intracellular pathway, and corneal epithelium is a rate-limiting barrier.Citation35 In another study, timolol showed an increase (2.5 times) in systemic absorption as pH of timolol eye drop was increased from 6.2 to 6.9 and 7.5.Citation36 The present study also showed highest penetration for all the FQs at the pH 7.0 at concentration of 0.05% followed by 0.025% at pH 4.5. Also, increasing the volume of drug instillation significantly decreased transcorneal penetration at all studied pH. Thus, along with concentration and volume, the pH of the formulation should be given due consideration and has a paramount importance.
Conclusion
For the first time, a study reports that factors like drug concentration, pH of formulation, and volume of drug instillation in vivo in rabbit cornea have a profound effect on transcorneal penetration of FQs. The use of cassette dosing approach to study in vivo pharmacokinetic profile of ophthalmic FQs was quite encouraging.
The study concludes that increase in concentration up to 0.05% showed a significant effect in the percentage transcorneal penetration. Thereby, the effect of concentration on percentage penetration of FQs is found to be dependent on volume of drug instillation up to an extent, but then, we observed a decrease in transcorneal penetration. Similarly, the pH of formulation showed that the highest transcorneal penetration of all the FQs was observed at the pH 7.0 at the concentration of 0.05% followed by 0.025% at pH 4.5. Lastly, increasing the volume of drug instillation from 12.5 to 50 μL showed a significant fall in the transcorneal penetration for most of the FQs. The total effect of increasing the volume of drug instillation at pH 7.0 was a significant decrease in transcorneal penetration for all the studied FQs.
In conclusion, a reduced concentration of drug and volume of instillation with an appropriate pH need to be considered before designing formulation for ophthalmic usage.
Disclosure
The authors acknowledge the financial support from Council of Scientific and Industrial Research, Government of India, as senior research fellowship to Charu Sharma, and All India Institute of Medical Sciences for the intramural grant. The authors report no other conflicts of interest in this work.
References
- VelpandianTIntraocular penetration of antimicrobial agents in ophthalmic infections and drug delivery strategiesExpert Opin Drug Deliv20096325527019327043
- SasakiHYamamuraKMukaiTEnhancement of ocular drug penetrationCrit Rev Ther Drug Carrier Syst19991618514610099899
- AttarMShenJLingKHTang-LiuDOphthalmic drug delivery considerations at the cellular level: drug-metabolising enzymes and transportersExpert Opin Drug Deliv20052589190816296785
- NishaSDeepakKAn insight to ophthalmic drug delivery systemInt J Pharm Stud Res201232913
- BaranowskiPKarolewiczBGajdaMPlutaJOphthalmic drug dosage forms: characterisation and research methodsScientific World J20142014861904
- SmithAPennefatherPMKayeSBHartCAFluoroquinolones: place in ocular therapyDrugs200161674776111398907
- AppelbaumPCHunterPAThe fluoroquinolone antibacterials: past, present and future perspectivesInt J Antimicrob Agents200016151511185413
- ShafferJEAdkisonKKHalmKHedeenKBermanJUse of “N-in-One” dosing to create an in vivo pharmacokinetics database for use in developing structure-pharmacokinetic relationshipsJ Pharm Sci199988331331810052989
- AllenMCShahTSDayWWRapid determination of oral pharmacokinetics and plasma free fraction using cocktail approaches: methods and applicationPharm Res199815193979487553
- FrickLWAdkisonKKWells-KnechtKJWoollardPHigtonDMCassette dosing: rapid in vivo assessment of pharmacokineticsPharm Sci Tech Today199811218
- ZhangMYKernsEMcConnellOBrain and plasma exposure profiling in early drug discovery using cassette administration and fast liquid chromatography-tandem mass spectrometryJ Pharm Biomed Anal200434235936815013150
- WatanabeTSchulzDMorisseauCHammockBDHigh-throughput pharmacokinetic method: cassette dosing in mice associated with minuscule serial bleedings and LC/MS/MS analysisAnal Chim Acta20065591374416636700
- KadamRSKompellaUBCassette analysis of eight beta-blockers in bovine eye sclera, choroid-RPE, retina, and vitreous by liquid chromatography-tandem mass spectrometryJ Chromatogr B Analyt Technol Biomed Life Sci20098773253260
- DejnekaNSWanSBondOSKornbrustDJReichSJOcular biodistribution of bevasiranib following a single intravitreal injection to rabbit eyesMol Vis200814997100518523657
- RantaVPToropainenETalvitieAAuriolaSUrttiASimultaneous determination of eight beta-blockers by gradient high-performance liquid chromatography with combined ultraviolet and fluorescence detection in corneal permeability studies in vitroJ Chromatogr B Analyt Technol Biomed Life Sci200277218187
- PrausnitzMRNoonanJSPermeability of cornea, sclera and conjunctiva: a literature analysis for drug delivery to the eyeJ Pharm Sci199887121479148810189253
- YoshidaFToplissJGUnified model for the corneal permeability of related and diverse compounds with respect to their physicochemical propertiesJ Pharm Sci19968588198238863270
- SharmaCVelpandianTBiswasNRNayakNVajpayeeRBGhoseSDevelopment of novel in silico model to predict corneal permeability for congeneric drugs: a QSPR approachJ Biomed Biotechnol2011201148386921403901
- RathoreMSMajumdarDKEffect of formulation factors on in vitro transcorneal permeation of gatifloxacin from aqueous dropsAAPS PharmSciTech2006735717025238
- PawarPKMajumdarDKEffect of formulation factors on in vitro permeation of moxifloxacin from aqueous drops through excised goat, sheep and buffalo corneasAAPS PharmSciTech200671E1316584143
- VelpandianTGuptaPRaviAKSharmaHPBiswasNREvaluation of pharmacological activities and assessment of intraocular penetration of an ayurvedic polyherbal eye drop (Itone™) in experimental modelsBMC Complement Altern Med201313123280361
- HechtGRemington – Ophthalmic Preparations19th edGebbariAREaston, PAMack Publishing Company19951563
- ThompsonAMOcular toxicity of fluoroquinolonesClin Exp Ophthalmol2007356566577
- ChungJLLimEHSongSWComparative intraocular penetration of 4 fluoroquinolones after topical instillationCornea20133271046105123615274
- ProkschJWWardKWOcular pharmacokinetics/pharmacodynamics of besifloxacin, moxifloxacin, and gatifloxacin following topical administration to pigmented rabbitsJ Ocul Pharmacol Ther201026544945820874668
- FukudaMSasakiHCalculation of AQCmax: comparison of five ophthalmic fluoroquinolone solutionsCurr Med Res Opin200824123479348619032129
- MitraAKMikkelsonTJMechanism of transcorneal permeation of pilocarpineJ Pharm Sci19887797717753225772
- MauriceDMFactors influencing the penetration of topically applied drugsHollyFJClinical Pharmacology of the Anterior SegmentBoston, MALittle Brown and Company198021
- LalAKatariaVRajpalAKhannaNPharmacodynamic effects of pilocarpine eye drop enhanced by decreasing its volume of instillationIndian J Physiol Pharmacol19953932672708550123
- KumarSKarkiRMeenaMPrakashTRajeswariTGoliDReduction in drop size of ophthalmic topical drop preparations and the impact of treatmentJ Adv Pharm Technol Res20112319219422171317
- LambertLAChambersWAGreenSThe use of low-volume dosing in the eye irritation testFood Chem Toxicol1993312991038449463
- ColesWHJarosPADynamics of ocular surface pHBr J Ophthalmol19846885495526743624
- SuhonenPJärvinenTKoivistoSUrttiADifferent effects of pH on the permeation of pilocarpine and pilocarpine prodrugs across the isolated rabbit corneaEur J Pharm Sci1998631691769795043
- KompaSRedbrakeCHilgersCWüstemeyerHSchrageNRemkyAEffect of different irrigating solutions on aqueous humour pH changes, intraocular pressure and histological findings after induced alkali burnsActa Ophthalmol Scand200583446747016029272
- WeiGXuHMaYLiSMZhengJMEffect of pH on the permeability of timolol maleate across isolated rabbit corneaYao Xue Xue Bao200136970771012580114
- KyyrönenKUrttiAEffects of epinephrine pretreatment and solution pH on ocular and systemic absorption of ocularly applied timolol in rabbitsJ Pharm Sci19907986886912231330