
Abstract
Objective
Collagen, a widely used natural biomaterial polymer in skin tissue engineering, can be innovatively processed into nanocollagen through cryogenic milling to potentially enhance skin tissue healing. Although various methods for fabricating nanocollagen have been documented, there is no existing study on the fabrication of nanocollagen via cryogenic milling, specifically employing graphene oxide as separators to prevent agglomeration.
Methods
In this study, three research groups were created using cryogenic milling: pure nanocollagen (Pure NC), nanocollagen with 0.005% graphene oxide (NC + 0.005% GO), and nanocollagen with 0.01% graphene oxide (NC+0.01% GO). Characterization analyses included transmission electron microscopy (TEM), scanning electron microscopy (SEM), Fourier transform infrared (FTIR) spectroscopy, x-ray diffraction (XRD), zeta potential (ZP), and polydispersity index (PDI).
Results
TEM and SEM analysis revealed that nanocollagen groups alone exhibited particle sizes of less than 100 nm. FTIR spectroscopic investigations indicated the presence of amide A, B, and I, II, and III (1800 to 800 cm−1) in all nanocollagen study groups, with the characteristic C-O-C stretching suggesting the incorporation of graphene oxide (GO). XRD data exhibited broadening of the major peak as the proportion of GO increased from pure NC to the nanocollagen groups with GO. Zeta potential measurements indicated electrostatic attraction of the samples to negatively charged surfaces, accompanied by sample instability. PDI results depicted size diameters ranging from 800 to 1800 nm, indicating strong polydispersity with multiple size populations.
Conclusion
This research demonstrated that collagen can be successfully fabricated into nanoparticles with sizes smaller than 100 nm.
Introduction
Collagen, a vital component of the extracellular matrix, plays a crucial role in the structural integrity and function of tissues in living organisms.Citation1 Its significance extends to wound healing, tissue regeneration, and various pathological conditions like chronic ulcers.Citation2 Collagen nanoparticles have emerged as promising therapeutic agents due to their ability to target specific sites in the body, such as areas of endothelial injury, atherosclerotic plaques, myocardial infarction, and liver fibrosis.Citation3
Nanomaterials, such as nanocollagen derived from collagen, are widely utilized in various fields, including medicine and cosmetics, owing to their nanoscale dimensions and enhanced properties.Citation4 Nanocollagen, produced through techniques like cryogenic milling, possesses unique attributes beneficial for wound healing and tissue engineering applications. Cryogenic milling, a process of milling materials at cryogenic temperatures, has been shown to enhance the properties of various nanomaterials, including nanocollagen.Citation5 This method has been shown to enhance the properties of various nanomaterials, including nanocollagen. By utilizing cryo-milling techniques, researchers have observed significant improvements in the structural integrity and properties of nanomaterials like multi-wall carbon nano tubes.Citation6 This method minimizes structural defects and preserves the original structure of the nanomaterials, leading to enhanced thermal, electrical, and mechanical properties.Citation7 Additionally, cryo-milling has been proven effective in reducing the particle size of materials like glibenclamide to the nanometric scale, resulting in improved dissolution behavior and surface area, crucial for enhancing the properties of nanocollagen.Citation8
Furthermore, graphene oxide can be employed to mitigate agglomeration during cryogenic milling processes.Citation9 The incorporation of graphene-based nanomaterials like GO in tissue scaffolds enhances mechanical strength, electrical conductivity, and biocompatibility, promoting cell proliferation and differentiation.Citation10,Citation11 Thus, the combination of nanocollagen and graphene oxide potentially exhibits promising properties for wound healing applications, including enhanced antimicrobial activity and biocompatibility.Citation12 Nanocollagen plays a crucial role in promoting tissue regeneration by offering a higher surface area-to-volume ratio, enhancing mechanical stability, and aiding in withstanding large loads with minimal tension. It holds potential for a range of clinical and non-clinical applications, including wound healing, drug delivery, and tissue reconstruction.Citation2 Given their reactivity and potential toxicity, comprehensive characterization methods are crucial for evaluating the safety and properties of nanocollagen. This study aims to develop nanocollagen through cryogenic milling and characterize its physical and chemical properties for potential application in treating deep skin wounds. The hypothesis posits that cryogenic milling can yield nanocollagen with enhanced absorption and retention of collagen’s chemical structure and morphology, thereby offering a promising alternative for wound healing therapies.Citation13,Citation14
Methodology
Graphene Oxide Fabrication
Graphene oxide (GO) was synthesized using a modified Hummers’ method with natural graphite powder following Mahmoudi et al’s procedure.Citation15 The synthesis involved three stages: (1) controlled stirring of graphite, concentrated H2SO4, and NaNO3 at 25°C for 120 minutes to promote graphite exfoliation, (2) addition of KMnO4, gradual temperature increase, and stirring to selectively oxidize certain double bonds within the graphite structure, and (3) dilution with deionized water, treatment with H2O2 to reduce remaining KMnO4, and filtration, centrifugation, and washing to produce GO as a fine dark-brownish powder.
Collagen to Nanocollagen Fabrication
Before freeze-drying, the gathered tendon underwent a cleaning process to remove fascia and debris. Subsequently, the dried tendon was dissolved in 0.35 M acetic acid (AnalaR; VWR, USA), concentrated with sodium chloride (0.05 g/mL; Sigma, USA), and subjected to centrifugation. The resulting collagen precipitate underwent a 72-hour dialysis using a dialysis tube (with a cut-off value of 14 kDa; Sigma), followed by freeze-drying and re-dissolving in acetic acid for subsequent nanocollagen fabrication.Citation16
Liquid nitrogen at a temperature of −196°C was used to freeze 15 mg/mL of ovine tendon solution for 12 hours. The method of cryogenic milling was modified from Wang and associates’ work.Citation17 The frozen collagen solution was cryogenically milled at a ratio of 0.5 litres of liquid nitrogen to 1 gram of collagen to create 15 mg/mL nanocollagen (NC) solution. To avoid NC agglomeration, GO was introduced during the milling procedure. There were three NC study groups created: pure NC, pure NC + 0.005% GO, and pure NC + 0.01% GO.
Characterization of Nanocollagen
Various analytical techniques were employed to assess different aspects of the samples. Transmission electron microscopy (TEM; Philips CM200, model JEOLJEM 2100) involved placing diluted samples on copper specimen grids and drying them at 60°C to preserve morphology. The resulting dried samples were examined under TEM, with image analysis focused on a wavelength range of 20 to 500 nm. Scanning electron microscopy (SEM; SUPRA 55VP) required drying NC samples to a thin layer on carbon tapes mounted on metal stubs, followed by observation with a 15 kV SEM, enabling sample image analysis spanning 200 nm to 2 m. Fourier transform infrared spectroscopy (FTIR; Perkin Elmer) involved sandwiching liquid NC samples between potassium bromide (KBr) plates to create thin films, and analysis was performed using FTIR spectrometer, with readings between 4000 and 500 cm−1. X-ray diffraction (XRD; Bruker D8 Advance AXS X-ray diffractometer) necessitated thin-film drying of NC samples, pulverization, and placement on quartz discs, followed by examination with CuKα radiation and specific XRD parameters. Zeta potential (ZP; Malvern Zeta Sizer Nano ZS; Malvern Instruments) analysis evaluated solubility and ionic charges in a ZP range of −150 V to 150 V for particle sizes ranging from 0.3 nm to 10 m, along with pH measurement. Polydispersity index (PDI; Malvern Zeta Sizer Nano ZS; Malvern Instruments) analysis determined particle size distribution uniformity, ranging from 0.0 to 1.0 PDI and 0.1 to 1000 d.nm Z-average.
Results and Discussion
Transmission Electron Microscopy
and displayed the transmission electron microscopy (TEM) images of GO. This micrograph vividly portrays the characteristic sheet-like morphology inherent to GO structures. This is because GO forms a sheet-like structure due to its two-dimensional nature and the arrangement of oxygen-containing functional groups on its surface.Citation18 shows the TEM pictures of the NC study groups. The synthesis of collagen nanoparticles via cryogenic milling was successfully shown using the TEM results of the nanocollagen study groups. The distribution of free-floating collagen nanoparticles is seen for pure NC (), and the particles are measured at 1.54 ± 0.21 nm (). GO is also shown as a sheet-like structure in , where NC + 0.005% GO showed nanocollagen particles attached to it. The sizes of the nanocollagen particles () were 2.72 ± 0.84 nm. The nanoparticle traits of the NC + 0.01% GO group () and the NC + 0.005% GO group () were comparable. The nanoparticle size of the NC + 0.01% GO group was 2.78 ± 1.23 nm.
Figure 1 (A and B) TEM images of graphene oxide.
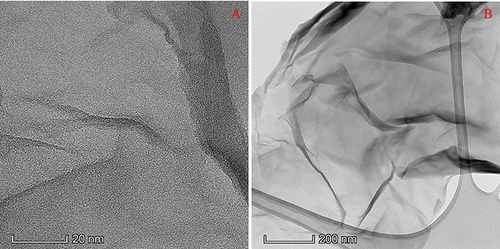
Figure 2 TEM images of nanocollagen study groups: (A and B) Pure NC, (C and D) NC + 0.005% GO, and (E and F) NC + 0.01% GO, respectively. Pure NC demonstrated free NC particles present within the sample, whereas the samples with GO displayed GO sheets with NC particle attached to it.
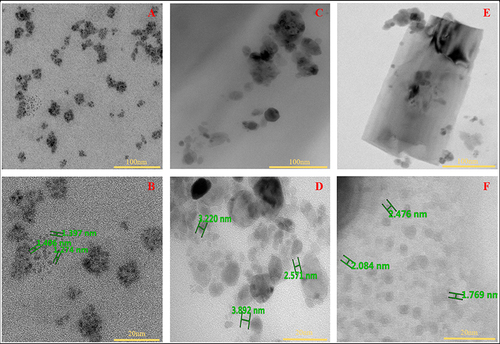
The nanocollagen revealed nano diameters of less than 3 nm based on measurements taken manually from all study group sample photos. This is because when visualised by TEM, individual nanocollagen strands have a tendency to curl and agglomerate to form nanoparticles, substantially decreasing their length.Citation19,Citation20 The nanocollagen particles were seen to be attached to the GO sheets in the study groups that were milled with GO. This happens as a result of a reaction between the amine groups in collagen and the carboxyl groups of GO, which leads to bonds being formed at the attachment point. According to research done by Xie et al, the scaffold’s biocompatibility was found to have improved as a result of the reaction between collagen and GO.Citation21 Free collagen nanoparticles with agglomerated groups were detected in pure NC. These images support the study’s theory that collagen nanoparticles can attach to and maintain their nanometer-scale structures on the surfaces of GO sheets.
Scanning Electron Microscopy
depicts the scanning electron microscopy (SEM) results of the NC study groups. The electron-sample interaction generated by the SEM results in reconstituted pictures that characterise the sample surface and reveal information about the structures of dimensional materials. The presence of nanocollagen strands in pure NC was depicted in and . clearly showed free floating nanocollagen particles as well as nanocollagen strands in the NC + 0.005% GO group (). Similar results were seen with the GO surface nanocollagen strands in the NC + 0.01% GO group ( and ).
Figure 3 SEM images of nanocollagen study groups: (A and B) Pure NC, (C and D) NC + 0.005% GO, and (E and F) NC + 0.01% GO, respectively. Pure NC displayed free NC strands whereas samples with GO demonstrated particles attached to GO sheets and free NC strands.
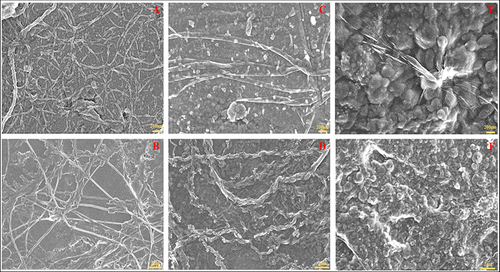
The SEM results of the nanocollagen study groups revealed the randomly distributed nanocollagen strands in great detail- a formation that aids in scar repair and is especially noticeable in pure NC.Citation22 The surface of the sample in the study groups containing GO exhibits tightly packed GO particles, presenting a rough surface with nanocollagen strands connected to it. The SEM data helped illustrate the project hypothesis, which holds that the GO produces a sheet-like layer for nanocollagen adhesion and nanometre preservation.Citation23,Citation24
Fourier Transform Infrared Spectroscopy
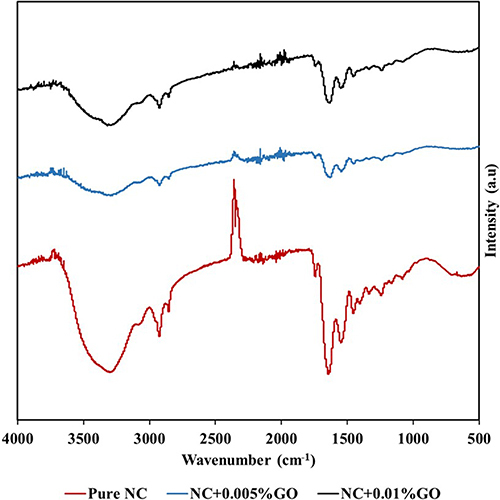
Results from Fourier transform infrared (FTIR) spectroscopy are shown in . The identification of chemical constituents and functional groups in the samples is aided by FTIR. Functional groups amide A, B, I, II, and III were present in all study groups, and their assignments are presented in . Mohamed et al showed the FTIR spectra of collagen, which included the amides A, B, I, II, and III, demonstrating consistency with the results of the nanocollagen study groups.Citation25 The wavelengths of amides A and B were 3299 ± 17.76 cm−1 and 2925 ± 0.99 cm−1, respectively. Amide I, II, and III displayed wavelengths of 1636 ± 7.38 cm−1, 1548 ± 1.10 cm−1, and 1453 ± 1.66 cm−1, respectively. Four different types of bonds are visible in a typical FTIR spectrum at each of its individual regions. Single bonds like O-H, C-H, and N-H are visible between high wavenumbers of 2500–4000 cm−1. Wavenumbers between the range of 1500 to 2000 cm−1 and 2000 to 2500 cm−1 at the midpoint denote double bonds and triple bonds, respectively. These findings suggested that collagen can be cryogenically milled and maintain the collagen source’s native structure while also notably preserving its functional groups. The FTIR results of NC + 0.005% GO and NC + 0.01% GO study groups also demonstrated the ether [C-O-C] stretching (1239 ± 0.51 cm−1), demonstrating the presence of GO. The presence of the unique C-O-C stretching, a GO hallmark, in the nanocollagen study groups with GO indicates that the nanocollagen and GO were successfully combined during the cryogenic milling process.Citation26 These results indicate successful incorporation of GO with the nanocollagen particles, enhancing the bioactivity of the biomaterial surface and hence reiterating its potential in bioengineering applications.
Table 1 The Functional Group Assignment of the Amides Present in Collagen
Figure 4 FTIR spectroscopy results of NC study groups.
X-Ray Diffraction
The X-ray diffraction (XRD) data are displayed in , which likewise displayed the peaks and displayed the graphical XRD results. The main peak of the XRD graph broadened as the amount of GO in the samples increased. This is because the XRD peak broadens when the crystalline sizes of the samples reduce to nanometres. The Scherrer equation, which describes the peak broadening diffraction angle in proportion to the crystalline domain size and the peak width at half height, is used to quantify this conclusion.Citation27 The XRD peaks also broaden as the sample crystal lattice becomes more imperfect. Based on these assertions and the XRD patterns, the results showed that pure NC has the sharpest main peak when compared to the NC + GO groups, indicating that pure NC has the least amount of nanoparticles present in the sample of the three study groups. In contrast to pure NC and NC + 0.005% GO, the NC + 0.01% GO group peak is the broadest, indicating that the largest concentration of nanoparticles is present.Citation28
Figure 5 XRD results of NC study groups.
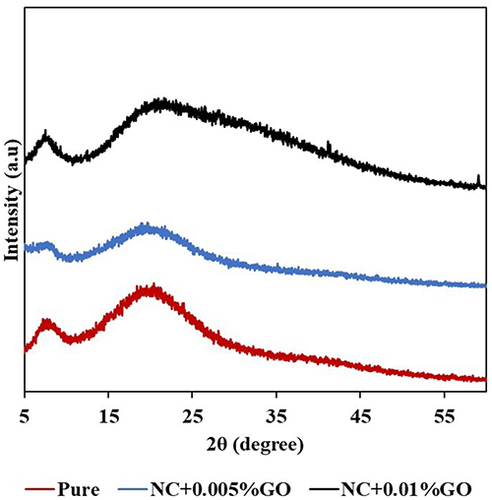
The samples’ crystallinity and amorphous content are shown in . Among the three samples, the NC + 0.005% GO showed the highest crystallinity and the lowest amount of amorphous component. The crystallinity and amorphous percentages of the nanocollagen study groups also correlate to the XRD patterns, where an amorphous material’s particles are randomly scattered within the 3D space and irregularly arranged, whereas crystalline structure’s particles are periodically arranged within the space. According to the Scherrer equation’s correlation calculation, the samples displayed smaller percentages of crystallinity and greater percentages of amorphous matter. Amorphous collagen displays distinct structural and functional characteristics in contrast to its crystalline counterpart. Research has revealed significant heterogeneity within collagen matrices across various hierarchical levels, with this diversity exerting significant influence on both form and function.Citation29 Notably, amorphous collagen exhibits heightened bioactivity and enhanced antioxidant capabilities relative to crystalline collagen.Citation30 Furthermore, it has demonstrated a capacity to stimulate fibroblast viability and collagen synthesis in fibroblasts.Citation31 Henceforth, amorphous collagen displays unique characteristics rendering it well-suited for diverse applications.
Table 2 Crystallinity and Amorphous Percentages of NC Study Groups
The XRD results also compliment the SEM results, in which both characterization methods provided valuable insights into the nanocollagen samples. XRD indicates that the nanocollagen samples with GO contain smaller crystalline domains, likely due to the presence of nanoparticles. SEM images visually confirm the presence of nanocollagen strands and particles on the surface of the samples. When considered together, these results suggest that the nanocollagen particles, likely in the form of nanoparticles, have attached to the GO sheets, resulting in a reduction in crystalline size. This attachment of nanocollagen to GO is consistent with the findings and hypotheses presented.
Zeta Potential
The results of the zeta potential (ZP) are displayed in . ZP investigates the sample potential in an electric field at the slipping/shear plane. The electric potential of a surface measures the amount of force needed to propel a unit of positive charge from infinity to a surface. The ZP shows the potential difference between the electric double layer and dispersion layer surrounding electrophoretically mobile particles at the sliding plane. The integrated, compact, and cost-effective equipment used by ZP provides an intuitive digital interface and in-depth data analysis.Citation13
Table 3 ZP Values of NC Study Groups and Regular Collagen
All of the mean value results for ZP were found to be positive in the study. According to Wang et al, these findings imply the presence of electrostatic attraction toward negatively charged cell membranes within the study group.Citation32 Among the various study groups involving nanocollagen, pure NC exhibited the lowest ZP values at +11.13±0.67 mV, followed by NC + 0.01% GO at +22.83±2.00 mV, with NC + 0.005% GO registering the highest ZP value at +22.17±0.76 mV. ZP values for the nanocollagen study groups fell within the range of 10 to 30. As indicated in , the research groups displayed early indications of instability, implying a heightened risk of sample coagulation and, consequently, challenges in maintaining nanometer-level resolution.Citation33 This susceptibility to coagulation is attributed to the fact that collagen in nanometer-sized forms represents an unnatural state of existence and tends to aggregate.Citation34 In comparison to the NC study groups, regular collagen exhibited superior ZP findings at +28.10±4.54 mV, indicating better sample stability.
Table 4 Sample Stability Reference Based on Zeta Potential Value.Citation35
In the ZP analysis, it is seen that the positive ZP values observed in nanocollagen samples indicate electrostatic interactions that promote stability by preventing coagulation or aggregation. The variation in ZP values among different study groups suggests differences in electrostatic forces, which can influence the stability of nanocollagen suspensions. Furthermore, the comparison with regular collagen underscores the unique electrostatic characteristics of nanocollagen in its nanometer-sized form.
Polydispersity Index
presents polydispersity index (PDI) data for NC study groups, indicating the distribution of particle sizes within samples. PDI ranges from 0.0 to 1.0, with values ≤0.2 suitable for formulation/pharmaceutical use.Citation36
Table 5 The PDI and Size Diameter Values of NC Study Groups and Regular Collagen
The PDI findings were generated between 0.00 and 1.00, and all groups showed mean values that were closer to 1.0, with pure NC at 0.86 ± 0.14, NC + 0.005% GO at 0.97 ± 0.05, and NC + 0.01% GO at 0.93 ± 0.07. The study’s PDI results showed ranges between 0.8 and 1.0, demonstrating the samples’ notable polydispersity and the presence of different populations of particle sizes. These findings corroborated the coagulation findings from the ZP and had the same rationale for the phenomena. The attachment of NC to GO sheets has potentially increased the population of particles with varying sizes, as evidenced by the greater PDI results of the NC study groups with GO compared to pure NC.
This method is most appropriate for nanoparticle solutions with uniform-sized nanoparticles since it uses a nano particle size analyser and a laser beam that is directed onto the sample in a two-dimensional plane.Citation37 However, because of the sheet-like structures of GO, non-uniform nanoparticles are present in nanocollagen samples containing GO. The tightly packaged GO could be a result from non-homogeneous dispersion with collagen and excessive amount of GO relative to collagen is applied. As a result, measurements are unreliable, which leads to flawed readings that are not relevant to the current study.
Additionally, the mean diameter of the nanoparticles was determined; the results show a decreasing trend as the percentage of GO rises. The mean values of the pure NC and NC + 0.005% GO groups, which both exceeded 1000 nm, were 1038.00 ± 81.23 nm and 1003.00 ± 448.40 nm, respectively. Only NC + 0.01% GO displayed a mean size diameter value of 842.00 ± 36.98 nm, remaining below 1000 nm. The NC study groups’ diameters ranged in size from 800 to 1800 nm. The large sample width seen in the nanocollagen samples with GO may be explained by the broad sheet-like structure of GO. The approach utilised to examine the data, as previously indicated, relied mostly on the measurements from the GO sheets, which led to values that were notably erroneous.
Conclusion
In Conclusion, the characterization of nanocollagen study groups reveals fabrication into nanoparticles below 100 nm, with GO enhancing stability and inducing polydispersity. TEM shows diameters below 3 nm, while SEM illustrates dispersed nanocollagen strands. FTIR confirms crucial functional groups for biocompatibility. XRD indicates varying nanoparticle concentrations among groups, influencing material properties. Positive ZP values suggest potential for biological interactions, yet risk of coagulation. PDI results demonstrate notable polydispersity, showcasing versatility. Overall, these analyses offer insights into nanocollagen’s structural, chemical, morphological, and surface properties, essential for tailoring applications in drug delivery, tissue engineering, and beyond. Nanocollagen exhibits potential as a versatile biomaterial, but further research is required to optimize stability and unlock its full capabilities.
Abbreviations
Pure NC, Pure nanocollagen; GO, Graphene oxide; NC + 0.005% GO, Nanocollagen with 0.005% graphene oxide; NC + 0.01% GO, Nanocollagen with 0.01% graphene oxide; TEM, Transmission electron microscopy; SEM, Scanning electron microscopy; FTIR, Fourier transform infrared; XRD, X-ray diffraction; ZP, Zeta potential; PDI, Polydispersity index; ECM, Extracellular matrix; O/W, Oil-in-water; W/O, Water-in-oil; ESD, Electrospray deposition; OTC, Ovine tendon collagen.
Institutional Review Board Statement
The study was approved by the Research Ethics Committee of UKM (Code: UKM PPI/111/8/JEP-2020-333 on 14 May 2020).
Disclosure
The authors declare that they have no known competing financial interests or personal relationships that could have appeared to influence the work reported in this paper.
Acknowledgments
All authors would like to express our gratitude to the Faculty of Medicine, UKM, for the guidance and resources to complete this original research paper and support from the industrial partner, My Cytohealth Sdn Bhd.
Additional information
Funding
References
- Roată CE, Ștefan I, Morărașu Ș, et al. Collagen-binding nanoparticles: a scoping review of methods and outcomes. Crystals. 2021;11(11):1396. doi:10.3390/cryst11111396
- Lo S, Fauzi MB. Current update of collagen nanomaterials—fabrication, characterisation and its applications: a review. Pharmaceutics. 2021;13(3):316. doi:10.3390/pharmaceutics13030316
- Kochar MP, Singh SP. Role of nano-collagen particles dressing in the management of chronic ulcer: a prospective non-randomized trial on 100 cases. Inter Surg J. 2020;7(3):802–806. doi:10.18203/2349-2902.isj20200826
- Baig N, Kammakakam I, Falath W. Nanomaterials: a review of synthesis methods, properties, recent progress, and challenges. Mater Adv. 2021;2(6):1821–1871.
- Sreedhara S, Joardar J, Ravula V, Tata NR. Preparation and characterization of nanoboron by cryo-milling. Adv. Powder Technol. 2020;31(9):3824–3832. doi:10.1016/j.apt.2020.07.021
- Katiyar NK, Biswas K, Tiwary CS. Cryomilling as environmentally friendly synthesis route to prepare nanomaterials. Int Mater Rev. 2021;66(7):493–532. doi:10.1080/09506608.2020.1825175
- Azimi S, Rastgoo A, Sattari S, Rashidi A. Defects and structural analysis of multi-wall carbon nano tubes via ball milling and cryo-milling. J Comput Appl Mech. 2016;47(1):1–9. doi:10.22059/jcamech.2016.59285
- Beckmann R, Bertling J. Installation and method for the cryogenic milling of material; 1998.
- Yang K, Huang L, Wang Y, et al. Graphene oxide nanofiltration membranes containing silver nanoparticles: tuning separation efficiency via nanoparticle size. Nanomaterials. 2020;10(3):454. doi:10.3390/nano10030454
- Edrisi F, Baheiraei N, Razavi M, Roshanbinfar K, Imani R, Jalilinejad N. Potential of graphene-based nanomaterials for cardiac tissue engineering. J Mater Chem B. 2023;11(31):7280–7299. doi:10.1039/D3TB00654A
- Niknam Z, Hosseinzadeh F, Shams F, et al. Recent advances and challenges in graphene-based nanocomposite scaffolds for tissue engineering application. J Biomed Mater Res Part A. 2022;110(10):1695–1721. doi:10.1002/jbm.a.37417
- Senthil R, Berly R, Bhargavi Ram T, Gobi N. Electrospun poly(vinyl) alcohol/collagen nanofibrous scaffold hybridized by graphene oxide for accelerated wound healing. Internat J Artif Organs. 2018;41(8):467–473. doi:10.1177/0391398818775949
- Bhattacharjee S. DLS and zeta potential–what they are and what they are not?. J Cont Release. 2016;235:337–351. doi:10.1016/j.jconrel.2016.06.017
- Wolfram J, Zhu M, Yang Y, et al. Safety of nanoparticles in medicine. Current Drug Targets. 2015;16(14):1671–1681. doi:10.2174/1389450115666140804124808
- Mahmoudi E, Ang WL, Ng CY, Ng LY, Mohammad AW, Benamor A. Distinguishing characteristics and usability of graphene oxide based on different sources of graphite feedstock. J Coll Interf Sci. 2019;542:429–440. doi:10.1016/j.jcis.2019.02.023
- Fauzi MB, Lokanathan Y, Aminuddin BS, Ruszymah BHI, Chowdhury SR. Ovine tendon collagen: extraction, characterisation and fabrication of thin films for tissue engineering applications. Mat Sci Engineer C. 2016;68:163–171.
- Wang F, Liu J, Shu Q. Optimization of cryogenic milling parameters for AFRP. Internat JAdvan Manufact Technol. 2017;91:3243–3252.
- Ramesh S, Karuppasamy K, Vikraman D, et al. Sheet-like morphology CuCo2O4 bimetallic nanoparticles adorned on graphene oxide composites for symmetrical energy storage applications. J Alloys Compo. 2022;892:162182. doi:10.1016/j.jallcom.2021.162182
- Chang SJ, Niu GC, Kuo SM, Ho CC, Bair MS. Preparation of Nano-Sized Particles from Collagen II by a High-Voltage Electrostatic Field System. IET; 2006:1–6.
- Shin KH, Kim JW, Koh YH, Kim HE. Novel self-assembly-induced 3D plotting for macro/nano-porous collagen scaffolds comprised of nanofibrous collagen filaments. Mater Lett. 2015;143:265–268. doi:10.1016/j.matlet.2014.12.119
- Xie X, Mao C, Liu X, et al. Synergistic bacteria killing through photodynamic and physical actions of graphene oxide/Ag/collagen coating. ACS Appl Mater Interfaces. 2017;9(31):26417–26428. doi:10.1021/acsami.7b06702
- McDougall S, Dallon J, Sherratt J, Maini P. Fibroblast migration and collagen deposition during dermal wound healing: mathematical modelling and clinical implications. Philos Trans Royal Soc A. 2006;364(1843):1385–1405. doi:10.1098/rsta.2006.1773
- Cao J, Wang Y, Xiao P, et al. Hollow graphene spheres self-assembled from graphene oxide sheets by a one-step hydrothermal process. Carbon. 2013;56:389–391. doi:10.1016/j.carbon.2012.12.075
- Liu J, Li Q, Xu S. Reinforcing mechanism of graphene and graphene oxide sheets on cement-based materials. J Mater Civil Enginee. 2019;31(4):04019014.
- Mohamed MA, Jaafar J, Ismail AF, Othman MHD, Rahman MA. Fourier transform infrared (FTIR) spectroscopy. In: Membrane Characterization. Elsevier; 2017:3–29.
- Hidayah NMS, Liu WW, Lai CW, et al. Comparison on Graphite, Graphene Oxide and Reduced Graphene Oxide: Synthesis and Characterization. AIP Publishing; 2017.
- Holder CF, Schaak RE. Tutorial on powder X-ray diffraction for characterizing nanoscale materials; 2019.
- Ungar T. Microstructural parameters from X-ray diffraction peak broadening. Scr Mater. 2004;51(8):777–781. doi:10.1016/j.scriptamat.2004.05.007
- Chen J, Ahn T, Colón-Bernal ID, Kim J, Banaszak Holl MM. The relationship of collagen structural and compositional heterogeneity to tissue mechanical properties: a chemical perspective. ACS Nano. 2017;11(11):10665–10671. doi:10.1021/acsnano.7b06826
- Xiao L, Lv J, Liang Y, et al. Structural, physicochemical properties and function of swim bladder collagen in promoting fibroblasts viability and collagen synthesis. LWT. 2023;173:114294. doi:10.1016/j.lwt.2022.114294
- Abbas AA, Shakir KA, Walsh MK. functional properties of collagen extracted from catfish (Silurus triostegus) Waste. Foods. 2022;11(5):633. doi:10.3390/foods11050633
- Wang J, Zhang L, Peng F, Shi X, Leong DT. Targeting endothelial cell junctions with negatively charged gold nanoparticles. Chem Mater. 2018;30(11):3759–3767. doi:10.1021/acs.chemmater.8b00840
- Hanaor D, Michelazzi M, Leonelli C, Sorrell CC. The effects of carboxylic acids on the aqueous dispersion and electrophoretic deposition of ZrO2. J Europ Ceram Society. 2012;32(1):235–244.
- Alazaiza MY, Albahnasawi A, Ali GA, et al. Application of natural coagulants for pharmaceutical removal from water and wastewater: a review. Water. 2022;14(2):140. doi:10.3390/w14020140
- Kumar A, Dixit CK. Methods for characterization of nanoparticles. In: Advances in Nanomedicine for the Delivery of Therapeutic Nucleic Acids. Elsevier. 2017:43–58.
- Danaei M, Dehghankhold M, Ataei S, et al. Impact of particle size and polydispersity index on the clinical applications of lipidic nanocarrier systems. Pharmaceutics. 2018;10(2):57. doi:10.3390/pharmaceutics10020057
- Zheng T, Bott S, Huo Q. Techniques for accurate sizing of gold nanoparticles using dynamic light scattering with particular application to chemical and biological sensing based on aggregate formation. ACS Appl Mater Interfaces. 2016;8(33):21585–21594. doi:10.1021/acsami.6b06903