Abstract
Purpose
Most colon cancers show low sensitivity to treatment with oxaliplatin and a specific strategy is needed to overcome this problem. Our approach uses RNA interference to silence the expression of target genes responsible for the development of oxaliplatin resistance. Profile analysis of genes related to the regulation of apoptosis allowed identification of target genes showing the greatest degree of upregulation in response to oxaliplatin exposure.
Methods
We designed a panel of genes with functions closely related to inactivation of the caspase cascade, endoplasmic reticulum stress reduction, and drug metabolism. The candidate genes were silenced by means of specific small interfering RNA (siRNA) oligonucleotides.
Results
The caspase 3 and 9 inhibitors of apoptosis 2 (cIAP2) and LIVIN were found to be the most dose-responsive genes during the period of oxaliplatin treatment. Two-fold sensitization of cells to oxaliplatin was observed with independent knockdown of either cIAP2 or LIVIN expression. siRNA-silencing of both targets produced a five-fold increase in oxaliplatin sensitivity of HCT-116 cells.
Conclusion
A dose-dependent approach revealed reliable targets for siRNA-silencing under low doses of oxaliplatin. Targeting the key proapoptotic chain with several specific siRNAs resulted in synergetic sensitization of HCT-116 cells to oxaliplatin treatment.
Introduction
Following the introduction of the drug oxaliplatin in colorectal cancer therapy, 40%–50% of patients have shown improved response rates and prolonged survival. However, more than half of patients experience side effects and drug resistance and new therapeutic approaches are needed.
Many studiesCitation1–Citation4 have searched for candidate target genes that express response to oxaliplatin treatment. Recent investigations using array technology have revealed a number of candidate gene clusters involved in the cell cycle, DNA replication, DNA transcription, and apoptosis.Citation5,Citation6 We focused on the caspase pathways in order to identify the most responsive markers related to oxaliplatin treatment. The activity of caspases is regulated through a variety of apoptotic inhibitors, including such protein families as baculoviral IAP repeat-containing (BIRC) proteins, Bcl-2, heat-shock proteins (HSPs), glucose-regulated proteins (GRPs), tumor necrosis factor receptor (TNFR)-related proteins (such as TRAP1), etc. The expression panel used in our investigation contained direct inhibitors of caspases (cIAP1/2, XIAP, Survivin, and LIVIN), CFLAR inhibitors of reactive oxygen species (ROS)-induced apoptosis (TRAP1, Bcl-xl, Bcl2, and Grp78), and several genes involved in drug metabolism (Gstp1, Gstm2, and endonuclease excision repair cross-complementing 1 [ERCC1]) as representative of the DNA reparation system. Together, these genes are involved in the mechanism that prevents apoptosis of cancer cells caused by either drug treatment or other extrinsic stress factors. Although several of these proteins have been previously used as the targets of RNA interference (i) knockdown in different cancer cell types,Citation2,Citation3,Citation7,Citation8 their role in chemotherapy resistance is still not clearly understood. Our approach was to study time- and dose-dependent responses of the HCT-116 cell line to oxaliplatin exposure by means of an expression panel of apoptotic inhibitors consisting of different protein families. Our study has revealed at least four genes that are upregulated by oxaliplatin doses of 5 and 10 μM, of which cIAP2 and LIVIN appeared to be the most dose-responsive during incubation with oxaliplatin. The caspase 3 and 9 inhibitor cIAP2 is a well-known c-Myc target and is frequently elevated in lung, colon, and pancreatic cancers, while there is relatively no information about Birc7/LIVIN. Knockdown of both LIVIN and cIAP2 resulted in dramatic levels of apoptosis at 10 μM of oxaliplatin. This observation suggests a novel synergistic role of these genes in the regulation of apoptosis and the development of oxaliplatin resistance.
Materials and methods
Cells
Colon cancer HCT-116 p53–/– cells were a gift from Professor AA Shtill, N.N. Blokhin Cancer Research Center, Moscow, Russian Federation and were maintained in Dulbecco’s Modified Eagle’s Medium ([DMEM] Life Technologies, Carlsbad, CA, USA) supplemented with 10% fetal bovine serum ([FBS] Life Technologies) and 50 μg of penicillin-streptomycin at 37°C in 5% CO2.
Oxaliplatin treatment and real time-PCR
The cells were seeded in 6-well plates in DMEM and 5% FBS without antibiotics, so that they will give 50% confluence on the next day. Cells were exposed to 5 and 10 μM oxaliplatin (Pharmachemie BV, Haarlem, the Netherlands) for 24 and 48 hours and real time-PCR was performed to analyze gene expression. Untreated cells served as a negative control.
Cell viability and apoptosis
Cell viability was determined by Trypan blue and apoptosis assay staining. Staining for the apoptosis analysis was performed using a Vybrant Apoptosis Assay Kit #5 (Life Technologies) with Hoechst 33342/propidium iodide, according to the manufacturer’s instructions. Cells were viewed and counted using an Axio Observer D1 microscope (Carl Zeiss Meditec AG, Jena, Germany) with 10×/20× objective lenses. Images were captured using a Carl Zeiss AxioCam MRc camera. Tests were performed in triplicate, counting a minimum of 600 cells total in each.
RNA isolation, reverse transcription
In order to perform reverse-transcription-PCR for all samples in equivalent conditions, RNA was isolated from each experimental well using an RNeasy Mini Kit (Qiagen, Hilden, Germany) and cells from triplicate wells were combined. Lysis buffer was added to the wells with the cells and incubated for 15–20 minutes until all cells were lysed. Isolation was performed according to the manufacturer’s instructions and the RNA concentration was measured on a NanoDrop 1000 (Thermo Fisher Scientific, Waltham, MA, USA). One hundred to five hundred nanograms of total RNA was applied for RT in a total volume of 20 μL using 1–5 U of Promt II reverse transcriptase (Promega Corporation, Fitchburg, WI, USA) at 42°C for 1 hour. The reaction was stopped by heating at 70°C for 10 minutes.
Real-time PCR
Expression profiles of the genes c-IAP1, cIAP2, XIAP, Survivin, LIVIN, FLIP (L-long chain splice variant), c-Myc, Grp78, l-Bcl-2, Bcl-xl, Gstp1, Gstm2, Gstm4, ERCC1, and TRAP1 were determined real time-PCR using a StepOne Real-Time PCR System (Life Technologies) with EveGreen (Biotium, Hayward CA, USA). Primers were designed according to standard rules in order to amplify 200–220 base-pair fragments of all analyzed genes. The primer sequences used for amplification were as follows:
IAP-1F (cIAP1 forward): AGGTGTGAGTTCTTGATACGAA
IAP-1R(cIAP1 reverse) : TTGTTTCACCAGGTCTCTATTA
Bir3-F (cIAP2 forward): AGGTGTTGGGAATCTGGAGAT
Bir3-R (cIAP2 reverse): GCAGCATTAATCACAGGAGTA
XF (XIAP forward): TAGGTGAAGGTGATAAAGTAA
XR (XIAP reverse): TTCTAGTTAGTGATGGTGTT
Bir5F (Birc 5 forward): CCCAGTGTTTCTTCTGCTT
Bir5R (Birc 5 reverse): GGCTCTTTCTCTGTCCAGTT
Liv-F(LIVIN forward): TGCCTGTTCTGGACTGTGT
Liv-R (LIVIN reverse): GCATCCAACAGGTACAGTT
LF1 (Long FLIP forward): TAATGGGAGAAGTAAAGAACAA
LF2: (Long FLIP reverse) AGGGAAGTGAAGGTGTCTCGAA
CMF (c-Myc forward): GAGGCTATTCTGCCCATTTG
CMR (c-Myc reverse): TCCTCGTCGCAGTAGAAATAC
Grp-F (Grp78 forward): AGGTGGGCAAACAAAGACAT
Grp-R (Grp78 reverse): CCGTAGGCTCGTTGATGAT
Bcl-2F (Bcl-2 forward): GGATTGTGGCCTTCTTTGAGT
Bcl-2R (Bcl-2 reverse): TCAGAGACAGCCAGGAGAAA
BL-F (Bcl-xL forward): GAGGCAGGCGACGAGTTTGA
BL-R (Bcl-xl reverse): ACAGTCATG CCCGTCAGGA
Gstp-F (Gstp1 forward): CATCTCCCTCATCTACACCA
Gstp-R (Gstp1 reverse): TCACTGTTTCCCGTTGCCA
Trp-F (Trap1 forward): GATGGTTCT GGAGTGTTTGA
Trp-R (Trap1 reverse): GTG TTCATCCGCCTTCCATTC
GSTM2-F: AGGAGCAGATTCGCGAAGACAT
GSTM2-R: TGTGAGTAGAGCTTCAGCATT
GSTM4-F: CAACGCCATCCTGTGCTACAT
GSTM4-R: GCTGCATC ATTGTAGGAAGTT
ERC-F1(ERCC1 forward): CACAACCTGCACCCAGACTA
ERC-R1(ERCC1 reverse) : TCCGCTGGTTTCTGCTCATA
GH-F (GAPDH forward): GAACCATGAGAAGTATGACAA
GH-R (GAPDH reverse): TGAGTCCTTCCACGATACCAA
The real time-PCR conditions were as follows: one cycle of initial denaturation at 95°C for 15 minutes, 42 cycles of amplification at 95°C (25 seconds), 60°C (25 seconds), and 72°C (5 seconds); and a melting step of 95°C for 1 minute, and an increase from 60°C to 95°C, with 1 minute for each degree. The GAPDH gene was amplified as a control with each group of genes at the corresponding annealing temperature. All experiments were repeated at least three times.
Small interfering RNA (siRNA) design
siRNA oligonucleotides that knock down messenger (m) RNAs of the genes cIAP2 and LIVIN and non-targeting (scrambled) siRNAs were designed using the program BLOCK-iT™ RNAi Designer (Life Technologies). Tuschl’s motif was used as the criterion for the target sequence search. We used an “AA(N19)TT” pattern, so that the tool searched for an area of the sequence that begins with “AA” and ends with “TT,” with 19 bases in-between. Several variants of each of the 21–22 bp-long siRNAs were designed for each target, and the BLOCK-iT program was used to identify the most sensitive. siRNA oligonucleotides were synthesized in sense and antisense strands in order to produce duplexes resistant to intracellular nucleases. The RNA oligonucleotides were synthesized with two flanking deoxyribonucleotides (dTdT) at the 3′ end. The sequences of the siRNA oligonucleotides were as follows:
cIAP2: sense, UAAGGGAAGAGGAGAGAGAAdTdT; antisense, UUCUCUCUCCUCUUCCCUUAdTdT
LIVIN: sense, CUGUACCUGUUUGGAUGCUdTdT; antisense, AGCAUCCAAACAGGUACAGdTdT
Scrambled: sense, CCUGGUAGCAGCGAGUGAGdTdT; antisense, CUCACUCGCUGCUACCAGGdTdT
Statistical analysis
Statistical analysis was carried out using an unpaired Student’s t-test (GraphPad Software Inc, La Jolla, CA, USA). Results were considered statistically significant where P < 0.05.
Transfection, siRNA interference, and oxaliplatin treatment
Cells were seeded for transfection in 48-well plates in DMEM without antibiotics 1 day before transfection so that they were 55%–60% confluent on the day of transfection. For transfection, the regular medium was replaced with low-serum medium with 1% FBS without antibiotics. The cells were transfected with siRNA in a forward manner using Lipofectamine RNAiMAX (Invitrogen; Life Technology). The final concentrations of the siRNA mixtures contained two equimolar siRNAs in concentrations up to 50 nM, as recommended in the RNAiMAX instruction protocol. Knockdown efficiency was examined using real time-PCR performed as previously stated. Oxaliplatin (10 μM) was added to each well containing the siRNA transfected cells. Untreated cells with no siRNA or oxaliplatin were used as negative controls; cells treated with oxaliplatin only were used as an siRNA negative control; and cells treated with scrambled siRNA were used as a scrambled control. The cells were incubated with the siRNA-Lipofectamine RNAiMAX complexes and oxaliplatin for 48 hours, and apoptosis was analyzed by fluorescent microscopic examination.
Results
Gene expression in HCT-116 cells in response to dosage and timing of oxaliplatin treatment
To determine the level of the expression response to different doses of oxaliplatin, HCT-116 cells were plated (2 × 10⁵ per well on a 48-well plate) and grown with the addition of oxaliplatin. In most cases, the effect of siRNA inhibition appeared after 48–72 hours or more. However, some cell lines did not survive during the long period of treatment with oxaliplatin. We incubated the HCT-116 cells with oxaliplatin for 24, 48, 72, and 96 hours (). We observed that 48 hours of treatment with oxaliplatin is the optimal period for evaluating the apoptotic effect produced by RNA interference; a longer period results in more than 30% cell death, which is equivalent to the effect of a single siRNA. Furthermore, a strong apoptotic response makes it difficult to perform accurate measurements of mRNA expression. Oxaliplatin at 5 μM and 10 μM was added to each well, with triplicate wells for each concentration. An incubation period of 48 hours is commonly believed to be sufficient, as by this point all plated cells will have passed through the division cycle, and most would be able to express early (24 hours of oxaliplatin treatment) and late (48 hours) genes in response to oxaliplatin treatment. After 24 and 48 hours of incubation, real time-PCR analysis was performed. The profile expression results are described in and correspond to the classic apoptosis network shown in .
Figure 1 Viability of HCT-116 cells that were treated with 10 μM of oxaliplatin.
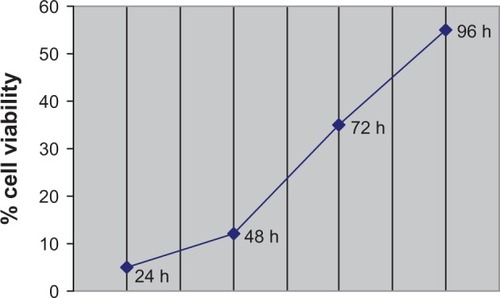
Figure 2 Dose- and time-dependent gene expression profiles.
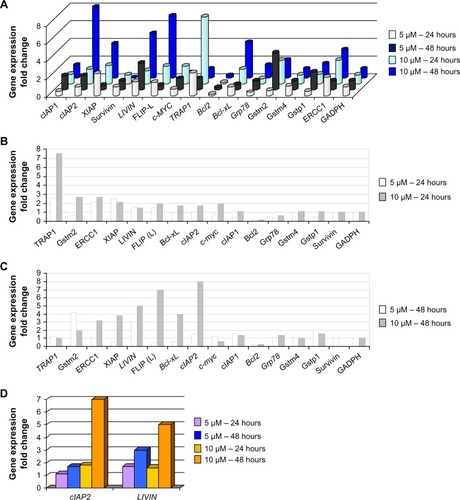
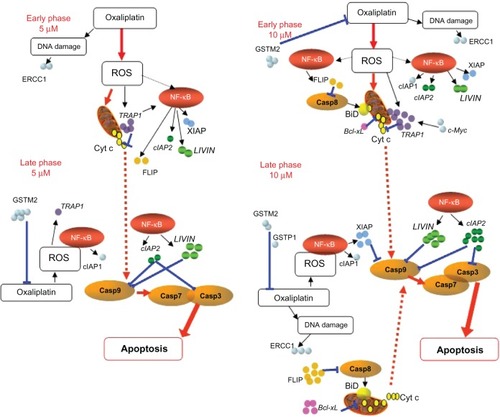
Figure 3 Early and late phases of gene expression under 5 and 10 μM of oxaliplatin.
Abbreviations: PCR, polymerase chain reaction; ROS, reactive oxygen species; NF-κB, nuclear factor kappa-light-chain-enhancer of activated B cells.
Early genes
TRAP1, XIAP, and ERCC1 showed the strongest early increase in expression (more than two-fold) at both concentrations of oxaliplatin, and slight increases were observed for c-Myc and Gstm2 at 10 μM of oxaliplatin ( and ). Early expression of LIVIN and cIAP2 genes was intermediate (1.2–1.7×). Upregulation of TRAP1, ERCC1, and Gstm2 was found to be strongest at 10 μM of oxaliplatin; however, none of these genes were upregulated for the entire period of drug exposure. TRAP1 is believed to localize to the cytosolic and mitochondrial fractions. The functional role of TRAP1 in mitochondria has been shown by a number of studies,Citation9,Citation10 in which it has been described as a negative mediator of cytochrome c release () and downstream activation of caspase 9. Subsequent activation of the caspase 9 and 3 inhibitors LIVIN and cIAP2 seems to support the consistency of such events. Early activation of TRAP1 may occur as a response to drug metabolism that triggers activation of the nuclear factor kappa-light-chain-enhancer of activated B cells (NF-κB) signaling pathwayCitation11 and subsequent activation of XIAP, which stops apoptotic cell death by direct inhibition of caspases 3, 7, and 9 ().
Late genes
Among the late genes, the targets of NF-κB signaling, the caspase inhibitors cIAP1, cIAP2, XIAP, and FLIP,Citation12,Citation13 appeared to be upregulated, mostly at 10 μM of oxaliplatin ( and ). LIVIN and cIAP2 are believed to inhibit apoptosis downstream of the caspase cascade by direct inhibition of both caspases 3 and 9. FLIP was among the most highly upregulated late genes at 10 μM of oxaliplatin. This event correlated with upregulation of another apoptotic inhibitor, Bcl-xl, under the same time/dose conditions, and was likely due to extension of the ROS influence and NF-κB signaling because of increased concentrations of the drug.
Oxaliplatin-dependent expression
Within 48 hours at 5 μM of oxaliplatin, elevated rates of expression were observed for LIVIN, Gstm2, and Gstp1. However, at 10 μM of oxaliplatin, we observed a twofold reduction of Gstm2 and downregulation of Gstp1. Within 48 hours at 10 μM of oxaliplatin, increased rates of expression were observed for cIAP2 (four-fold increase), LIVIN (three-fold), and FLIP, Bcl-xl, and XIAP (two-fold). TRAP1 and Survivin were significantly downregulated during this period. Upregulation of FLIP and ERCC1 was found to be time-dependent at the higher dose of oxaliplatin, while at 5 μM, downregulation of these genes was observed in 48 hours.
Time- and dose-dependent genes
Birc7/LIVIN was the only gene that appeared to exhibit stable elevated expression within 48 hours at the lower concentration and was dose-dependent at the later stage. The expression of cIAP2 appeared to be both time- and dose-dependent ( and ). We chose to further investigate LIVIN and cIAP2 (), as two direct inhibitors of pro-caspase 3 and 9, in order to determine whether double siRNA knockdown of two key apoptosis regulators may influence cell resistance to oxaliplatin.
siRNA silencing of the candidate genes
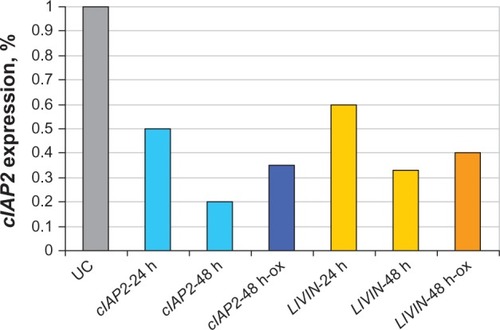
Knockdown of target genes was performed at the concentration of oxaliplatin (10 μM) that caused the greatest elevation in their expression levels (). For cIAP2, the maximum rate of silencing was obtained in 48 hours by means of 15 nM of siRNA and was as much as 80% (P < 0.024) without oxaliplatin and 65% when 10 μM of oxaliplatin was added (P < 0.01) (). Similar results were observed for LIVIN.
Figure 4 Anti-cIAP2 and anti-LIVIN sirnas downregulate cIAP2 and LIVIN in HCT-116 cells.
Abbreviations: h, hours; ox, oxaliplatin; PCR, polymerase chain reaction; siRNA, small interfering RNA; UC, untreated cells.
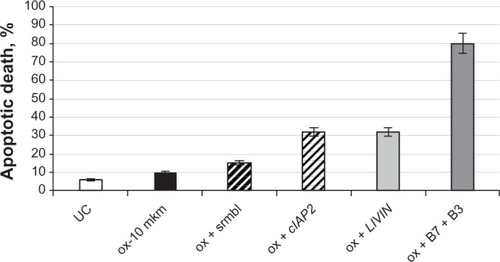
HCT-116 cells containing 10 μM of oxaliplatin were transfected with 15 nM of either anti-cIAP2 or LIVIN siRNAs or both. Scrambled siRNA was added to the cells treated with oxaliplatin in order to control nonspecific inhibition. After 48 hours of incubation, the cells were stained with either Hoechst 33342/propidium iodide ( and , , and ) or Trypan blue ( - and ). Apoptotic cells were examined under a fluorescent microscope with ten fields of view per well (10×/20× magnification) (). Silencing of each gene resulted in a two-fold increase in sensitivity to oxaliplatin (P < 0.01) () compared to the cells treated with only oxaliplatin ( - and ). A significant rate of apoptosis (P < 0.005) was achieved by means of combination of cIAP2 (Birc3) and LIVIN (Birc7) ( and ).
Figure 5 Cells treated with siRNA and oxaliplatin.
Abbreviations: PI, propidium iodide; siRNA, small interfering RNA.
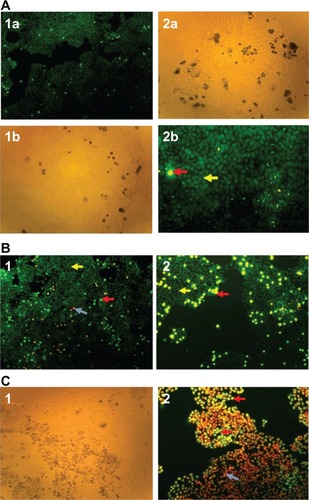
Figure 6 The elevated response to ox of HCT-116 cells that were treated with anti-LIVIN and anti-cIAP-2 siRNAs.
Abbreviations: ox, oxaliplatin; srmbl, scrambled; siRNA, small interfering RNA;UC, untreated cells.
Discussion
The separation of gene expression into early and late phases may at first appear to be approximate; however, no genes dependent on NF-κB signaling were expressed in the first 24 hours, and none (except TRAP1, c-Myc, Bcl-xl and Gstm2) were found to be dose-dependent during this period (). The increase in oxaliplatin dosage, from 5 to 10 μM, resulted in synergetic elevation of TRAP1 and c-Myc at the early stage. This is not surprising as long as TRAP1 is considered a direct c-Myc target. The two-fold elevation of Gstm2 and Bcl-xl may be explained by their lack of sensitivity to lower doses of oxaliplatin. Bcl-xl maintains its sensitivity only to higher doses of oxaliplatin. and clearly show that TRAP1 is an early-expressed gene, while cIAP2, FLIP, and XIAP are the most dose-dependent late genes. Our observations concerning the oxaliplatin sensitivity of Bcl2 family members were interesting; a possible explanation for the inactivity of Bcl2, compared to the upregulation of Bcl-xl expression, is its lack of sensitivity to low concentrations of oxaliplatin.
Due to oxaliplatin’s ability to induce DNA damage, there has been much discussion of the role of DNA repair genes in oxaliplatin resistance, such as ERCC1, which has been shown to be inversely correlated with the response to oxaliplatin.Citation12,Citation13 However, these findings appear to be controversial, since at least two studiesCitation4,Citation14 found no association between DNA repair proteins and oxaliplatin resistance. In our experiments, we found ERCC1 to be downregulated in 48 hours at 5 μM of oxaliplatin exposure. Almost full knockdown of Survivin expression was observed at higher doses of oxaliplatin (). The ability of oxaliplatin to downregulate Survivin has been repeatedly described.Citation15–Citation17
Our data suggest that cIAP2 and LIVIN play an essential role in the oxaliplatin-induced resistance of HCT-116 cells. Unlike cIAP2, LIVIN was less frequently found to be overexpressed in colon cancers. In one very recent study,Citation18 anti-LIVIN siRNA apoptosis was observed in vivo and in vitro (in HCT-116 cells), and the authors describe a remarkable decrease in cell viability under different doses of siRNA. One year previously, another group of researchers constructed a vector containing short hairpin RNA-LIVIN that caused apoptosis of HCT-8/V colon cancer cells.Citation19 Simultaneous siRNA knockdown of Survivin and LIVIN was performed on Lovo colon cancer cells;Citation20 however, no synergic effect was observed. By means of accurate measurement of oxaliplatin-induced expression, we have revealed that cIAP2 and LIVIN were the only genes not downregulated over 48 hours of 5 and 10 μM of oxaliplatin exposure. Individual knockdown by means of either anti-LIVIN or cIAP2 resulted in 32% cell death for both siRNAs. In general, this level of apoptosis is common in cases where only one siRNA is used in order to overcome platinum-containing drug resistance, and has been previously described by several authors.Citation21,Citation22 A very representative result was obtained by the previously mentioned groupCitation18 who performed LIVIN silencing on HCT-116 cells. They observed an approximately 30% decrease in cell viability with an siRNA concentration of 25 nM, which is similar to the concentration used in this study.
Both LIVIN and cIAP2 inhibit caspases 3 and 9, and our study indicated that both are time- and dose-dependent. This finding led us to suppose a synergistic role of these genes in oxaliplatin resistance. As the result of double siRNA silencing, we observed massive apoptosis that made cancer cells so weak and sensitive to ethylenediaminetetraacetic acid (EDTA)–trypsin treatment that cell imaging by means of a microscope was the only way to determine cell viability.
Conclusion
The siRNA cocktail appears to be an effective tool with which to inhibit several targets that are essential for cancer cell proliferation or survival activity. Over the last 3 years, a number of authors have published results showing a successful cooperative effect in other types of cancers by employing two or three different siRNAs, including cIAP1, cIAP2, and XIAP for prostate cancerCitation23 or XIAP, LIVIN, and Survivin for bladder cancer.Citation24 Together, these findings provide new insight into approaches for the prevention of drug resistance in cancer cells.
Acknowledgments
We thank Professor Albert Shtill (N.N. Blokhin Cancer Research Center, Moscow) for providing the cell line for this study, and Dr Natalya Pospekhova and Dr Vitaliy Shubin (Centre for Medical Genetics, Moscow) for their support and advice.
Disclosure
The authors report no conflicts of interest in this work.
References
- SamimiGManorekGCastelRcDNA microarray-based identification of genes and pathways associated with oxaliplatin resistanceCancer Chemother Pharmacol200555111115378272
- VolandCBordAPélerauxARepression of cell cycle-related proteins by oxaliplatin but not cisplatin in human colon cancer cellsMol Cancer Ther2006592149215716985047
- MeynardDLe MorvanVBonnetJRobertJFunctional analysis of the gene expression profiles of colorectal cancer cell lines in relation to oxaliplatin and cisplatin cytotoxicityOncol Rep2007751213122117390068
- ArnouldSHennebelleICanalPBugatRGuichardSCellular determinants of oxaliplatin sensitivity in colon cancer cell linesEur J Cancer200339111211912504667
- GiacchettiSPerpointBZidaniRPhase III multicenter randomized trial of oxaliplatin added to chronomodulated fluorouracil-leucovorin as first-line treatment of metastatic colorectal cancerJ Clin Oncol20001813614710623704
- ArangoDWilsonAJShiQMolecular mechanisms of action and prediction of response to oxaliplatin in colorectal cancer cellsBr J Cancer200491111931194615545975
- GalliganLLongleyDBMcEwanMWilsonTRMcLaughlinKJohnstonPGChemotherapy and TRAIL-mediated colon cancer cell death: the roles of p53, TRAIL receptors, and c-FLIPMol Cancer Ther20054122026203616373718
- SeetharamRNSoodABasu-MallickAAugenlichtLHMariadasonJMGoelSOxaliplatin resistance induced by ERCC1 up-regulation is abrogated by siRNA-mediated gene silencing in human colorectal cancer cellsAnticancer Res20103072531253820682979
- CollerHAGrandoriCTamayoPExpression analysis with oligonucleotide microarrays reveals that MYC regulates genes involved in growth, cell cycle, signaling, and adhesionProc Natl Acad Sci U S A20009773260326510737792
- FeltsSJOwenBANguyenPTrepelJDonnerDBToftDOThe hsp90-related protein TRAP1 is a mitochondrial protein with distinct functional propertiesJ Biol Chem200027553305331210652318
- MasudaYThe role of mitochondrial chaperone tumor necrosis factor-associated protein 1 (TRAP1) in the regulation of apoptosisJournal of Health Science201157119
- SohnWJLeeJWParkDGChange in expression of Survivin caused by using oxaliplatin in HCT116 colon cancer cellsJ Korean Soc Coloproctol201026424625321152225
- ShirotaYStoehlmacherJBrabenderJERCC1 and thymidylate synthase mRNA levels predict survival for colorectal cancer patients receiving combination oxaliplatin and fluorouracil chemotherapyJ Clin Oncol200119234298430411731512
- HarradineKAKassnerMChowDFunctional genomics reveals diverse cellular processes that modulate tumor cell response to oxaliplatinMol Cancer Res20119217318221169384
- FujieYYamamotoHNganCYOxaliplatin, a potent inhibitor of survivin, enhances paclitaxel-induced apoptosis and mitotic catastrophe in colon cancer cellsJpn J Clin Oncol200535845346316024531
- NganCYYamamotoHTakagiAOxaliplatin induces mitotic catastrophe and apoptosis in esophageal cancer cellsCancer Sci200899112913917949450
- KhanZKhanNVarmaAKOxaliplatin-mediated inhibition of survivin increases sensitivity of head and neck squamous cell carcinoma cell lines to paclitaxelCurr Cancer Drug Targets201010766066920578991
- OhBYLeeRAKimKHsiRNA targeting LIVIN decreases tumor in a xenograft model for colon cancerWorld J Gastroenterol201117202563257121633662
- WangXXuJJuSNiHZhuJWangHLIVIN gene plays a role in drug resistance of colon cancer cellsClin Biochem2010437–865566020171199
- CaiMWangGBTaoKXCaiCX[Inhibitory effect of multiple siRNA recombinant expression vector targeting simultaneously LIVIN and Survivin genes on human colon cancer cells proliferation.]Yao Xue Xue Bao2009447741746 Chinese19806913
- ZhangSDingFLuoAXIAP is highly expressed in esophageal cancer and its downregulation by RNAi sensitizes esophageal carcinoma cell lines to chemotherapeuticsCancer Biol Ther20076697398017611394
- YanagieHHisaTOgataAImprovement of sensitivity to platinum compound with siRNA knockdown of upregulated genes in platinum complex-resistant ovarian cancer cells in vitroBiomed Pharmacother200963855356018571892
- GillCDowlingCO’NeillAJWatsonRWEffects of cIAP-1, cIAP-2 and XIAP triple knockdown on prostate cancer cell susceptibility to apoptosis, cell survival and proliferationMol Cancer200983919549337
- YangDSongXZhangJTherapeutic potential of siRNA-mediated combined knockdown of the IAP genes (LIVIN, XIAP, and Survivin) on human bladder cancer T24 cellsActa Biochim Biophys Sin (Shanghai)201042213714420119625