Abstract
Background
To identify genes associated with hepatocellular carcinoma (HCC) pathogenesis, we developed a triple combination array strategy comprising methylation, gene expression, and single nucleotide polymorphism (SNP) array analysis.
Methods
Surgical specimens obtained from a 68-year-old female HCC patient were analyzed by triple combination array, and identified Dynamin 3 (DNM3) as a candidate tumor suppressor gene in HCC. Subsequently, samples from 48 HCC patients were evaluated for DNM3 methylation and expression status using methylation specific polymerase chain reaction (PCR; MSP) and semi-quantitative reverse transcriptase (RT)-PCR, respectively. The relationship between clinicopathological factors and DNM3 methylation status was also investigated.
Results
DNM3 was shown to be hypermethylated (methylation value 0.879, range 0–1.0) in cancer tissue compared with adjacent normal tissue (0.213) by methylation array in the 68-year-old female patient. Expression arrays revealed decreased expression of DNM3 in cancerous tissue. SNP arrays revealed that the copy number of chromosome 1q24.3, in which DNM3 resides, was normal. MSP revealed hypermethylation of the DNM3 promoter region in 33 of 48 tumor samples. A trend toward decreased DNM3 expression was observed in patients with DNM3 promoter methylation (P = 0.189). Furthermore, patients with reduced expression of DNM3 in tumor tissues exhibited worse prognosis with decreased disease specific survival compared to patients without decreased expression (P = 0.014).
Conclusion
The present study indicates that a triple combination array strategy is an effective method to detect novel genes related to HCC. We propose that DNM3 is a tumor suppressor gene in HCC.
Introduction
Hepatocellular carcinoma (HCC) is currently the sixth most prevalent neoplasm and the third most frequent cause of cancer death worldwide,Citation1 and its overall incidence is steadily rising. Although several therapeutic options for the treatment of HCC currently exist,Citation2–Citation5 the prognosis of patients with advanced HCC remains poor.Citation6,Citation7 Therefore, further research to clarify the mechanisms underlying hepatocarcinogenesis is urgently required.Citation8
We recently developed a double combination array analysis consisting of gene expression and single nucleotide polymorphism (SNP) array analysis, and reported a number of tumor suppressor genes in HCC.Citation9–Citation14 In these studies, we hypothesized that deoxyribonucleic acid (DNA) methylation of the promoter region of these genes led to downregulation of gene expression, causing HCC progression. In addition to this double combination array analysis, we also performed methylation array analysis of the same specimens, thus allowing a more conclusive association between gene expression and DNA methylation. This triple combination array analysis represents an efficient procedure for the detection of tumor suppressor genes of HCC.Citation15,Citation16
Dynamin 3 (DNM3) is a candidate tumor suppressor gene detected by this triple combination array analysis. This gene encodes a member of the dynamin family, which possess mechanochemical properties used to tabulate and sever membranes.Citation17 However, to date, there are few reports describing the relationship between DNM3 and any malignant disease.Citation18,Citation19 Furthermore, no previous studies have investigated the role of DNM3 in HCC. In this study, we aimed to evaluate the expression and methylation status of DNM3 in HCC.
Materials and methods
Sample collection and DNA preparation
Nine HCC cell lines (HepG2, Hep3B, HLE, HLF, HuH1, HuH2, HuH7, PLC/PRF/5 and SK-Hep1) were obtained from the American Type Culture Collection (ATCC, Manassas, VA, USA). All cell lines were cultured in Roswell Park Memorial Institute (RPMI)-1640 medium supplemented with 10% fetal bovine serum and incubated in 5% CO2 at 37°C.
A 68-year-old woman with chronic hepatitis C was diagnosed with HCC in the right lobe and biochemical examination showed that des-gamma-carboxy (DCP) prothrombin level was as high as 7029 mAU/mL whereas alpha-fetoprotein (AFP) level was 9 ng/mL. She underwent partial liver resection. Specimens of her tumor and adjacent non-tumorous tissues were excised. The tumor was pathologically confirmed as moderately differentiated HCC and the surrounding parenchymal tissue showed liver cirrhosis.
HCC tissue (HT) and normal tissue (NT) samples were obtained from 48 patients (43 males, five females, aged between 39–77 years, mean ± standard deviation [SD], 62.4 ± 7.9 years) who underwent liver resection at Nagoya University Hospital, Nagoya, Japan between 1994 and 2001. Thirty-eight patients had hepatitis C and seven had hepatitis B. The median duration of follow-up was 80.7 months (range 15.2–213.1 months). All tissues were reviewed pathologically to confirm the diagnosis of HCC. Written informed consent, as required by the institutional review board was obtained from all patients. The tissue samples were immediately frozen in liquid nitrogen and stored at −80°C until required. Genomic DNA was obtained from tissue samples by proteinase K digestion, followed by phenol/chloroform extraction.
Ribonucleic acid isolation, microarray, and gene chip affymetrix procedures
Gene expression and SNP arrays were performed as previously described,Citation9–Citation14 using total ribonucleic acid (RNA) and DNA extracted from tissue samples taken from the 68-year-old female patient described above. Total RNA and DNA were extracted from an area consisting of >80% cancerous cells. RNA was isolated from each of the frozen samples with the RNeasy mini kit (Qiagen, Chatsworth, CA, USA) according to the manufacturer’s protocol. Total RNA was processed for expression array analysis by Affymetrix HGU133A and HGU133B Gene Chips (Affymetrix, Santa Clara, CA, USA). Genomic DNA was used for SNP-Chip array analysis by Affymetrix GeneChip Mapping 500 K arrays (Affymetrix).
Methylation array platform
Methylation arrays were performed using DNA extracted from tissue samples taken from the 68-year-old female patient described above. Bisulfite-converted DNA (500 ng to 1 μg) was used for DNA methylation analysis using Ilumina Infinium Human Methylation 27 BeadChip arrays (Illumina, San Diego, CA, USA).Citation20 Of the ~28 million CpG sites identified throughout the haploid human genome, Illumina initially designed Infinium methylation probes for 27,578 CpG sites located in promoter regions (up to 1 kb upstream or 500 bp downstream of the transcription start sites). Of these, 27,324 CpG sites relate to 14,475 consensus coding sequences, including approximately1,000 cancer-associated genes, and 254 CpG sites relate to approximately 100 microRNA genes. The probes were preferentially selected to occur within CpG islands using the National Center for Biotechnology Information (NCBI) “relaxed” definition of a CpG island: CpG islands identified bioinformatically with a CpG content of >50% and an observed/expected ratio of >0.6.Citation21
Bisulfite-converted DNA was whole-genome amplified, enzymatically fragmented, and hybridized to arrays. During hybridization, the bisulfite-converted DNA anneals to methylation-specific probes on the chip. Each CpG locus is represented by two bead types, one of which is specific to the methylated state and the other specific to the unmethylated state, which is directly related to the underlying sequence change catalyzed during bisulfite conversion. Therefore, for each CpG site, a possible C/T variant can be assayed through the single-base extension step, which is possible because of the ability to hybridize to either the “protected” methylated cytosine or the converted (unmethylated) thymine.
After hybridization, a single-base extension step was performed using a multi-layer staining process, as described below. The BeadChip was then scanned on the Illumina iScan and the resulting “idat” files were analyzed using BeadStudio software (Illumina, San Diego, CA, USA). The output of the BeadStudio analysis is a β-value for each CpG site. This is a continuous value between 0 and 1, where 0 = 0% methylation and 1 = 100% methylation at a given CpG site. Therefore, this assay enables quantitative analysis of methylation at individual CpG sites.
Reverse transcription-polymerase chain reaction
DNM3 messenger (m)RNA expression was analyzed by semiquantitative reverse transcription-polymerase chain reaction (RT-PCR) and real-time RT-PCR. Total RNA (10 μg) isolated from nine HCC cell lines, primary HTs and NTs were used to generate complementary DNA (cDNA). The resulting cDNAs were then amplified by PCR using primers for DNM3 (sense, 5′-ACC CCA CAC CTG CAG AAG GT-3′ in exon 6); antisense 5′-TGG AGA GCA ACT GTC CCT GTA-3′ in exon 7), which amplified a 100 bp product. PCR was performed using the following parameters: initial denaturation at 94°C for 5 minutes followed by 35 cycles of 94°C for 10 seconds, 60°C for 8 seconds and 72°C for 4 seconds. RT-PCR of β-actin was performed to confirm equal amounts of cDNA template in each amplification. Each PCR product was loaded directly onto 3% agarose gels, stained with ethidium bromide and visualized under ultraviolet (UV) illumination.
Real-time quantitative RT-PCR analysis
PCR was performed using SYBR Green PCR Core Reagents (Perkin-Elmer Applied Biosystems, Foster City, CA, USA) under the following conditions: 1 cycle at 95°C for 10 seconds, followed by 48 cycles at 95°C for 10 seconds and at 60°C for 30 seconds. SYBR Green emission was detected in real-time with an ABI prism 7000 Sequence Detector (Perkin-Elmer Applied Biosystems). The primers used for PCR were the same as those described above for RT-PCR. Quantitative RT-PCR was performed at least three times, including negative controls without template. The expression of DNM3 was normalized to glyceraldehyde 3-phosphate dehydrogenase (GAPDH) expression in each sample.
Methylation-specific PCR
DNA from HCC cell lines, HTs and NTs were subject to bisulfite treatment. Briefly, 2 μg of DNA was denatured by NaOH and modified by sodium bisulfite. DNA samples were then purified using the Wizard purification resin (Promega Corporation, Madison, WI, USA), treated with NaOH, precipitated with ethanol and resuspended in water. Primer pairs were used to detect methylation (sense, 5′-GAG GTC GTG GTA TTT GGT CG-3′; antisense, 5′-AAC GCG CCT ACG CGA ACG AA-3′; 149-bp product) and non-methylation (sense, 5′-GGG GTG TTG TGG AGA TAG GT-3′; antisense, 5′-CCA CCA ACC CAC CAC TTA AC-3′; 90-bp product) of the DNM3 promoter region near exon 1. Methylation-specific PCR (MSP) amplification was performed as follows: denaturation at 94°C for 5 minutes followed by 44 cycles at 94°C for 15 seconds, 60°C for 10 seconds and 72°C for 9 seconds. Unmethylated-Specific PCR (UNMSP) amplification was performed as follows: denaturation at 94°C for 5 minutes followed by 36 cycles at 94°C for 15 seconds, 60°C for 10 seconds and 72°C for 8 seconds. PCR products were loaded directly onto 3% agarose gels, stained with ethidium bromide and visualized under UV illumination.
Sequence analysis
Bisulfite-treated genomic DNA obtained from HCC cell lines was sequenced and PCR was performed in all cases. Semi-nested PCR was performed to gain adequate products for TA cloning. PCR amplification was performed as follows: denaturation at 94°C for 3 minutes followed by 37 cycles of 94°C for 15 seconds, 54°C for 15 seconds, and 72°C for 20 seconds with primer pairs (sense 5′-TTG GGT TTT GGT TTG GTA GT-3′; antisense, 5′- TCA ACC AAC CAA ATC CTA AC-3′; 342-bp product). PCR products were used as templates for subsequent PCR using the same antisense primer and a different sense primer (sense, 5′-GGT TTT TGA GTT TTG GTT ATA G-3′; 253-bp product). The PCR products were subcloned into a TA cloning vector (Invitrogen, Carlsbad CA, USA). Six clones were selected from two HCC cell lines (HuH2 and PLC/PRF/5). Each DNA clone was mixed with 3 μL of M13 specific primer and 4 μL of Cycle Sequence Mix (ABI PRISM Terminator v1. 1 Cycle Sequencing Kit; Applied Biosystems, Foster City CA, USA). Samples were then subjected to the following cycling conditions: 95°C for 30 seconds followed by 25 cycles of 96°C for 10 seconds, 50°C for 5 seconds and 60°C for 4 minutes, and purified by ethanol precipitation. Sequence analysis was performed using an Applied Biosystems ABI310 and sequence electropherograms were generated using ABI Sequence Analysis software version 3.0.
5-aza-2′-deoxycytidine treatment
HCC cell lines were treated with 1 μM 5-aza-2′-deoxycytidine (5-aza-dC) (Sigma-Aldrich, St Louis, MO, USA) to inhibit DNA methylation. Cells (1.5 × 10⁶) were cultured for 6 days with medium changes on days 1, 3, and 5. On day 6, cells were harvested, RNA was extracted and RT-PCR was performed as described above.
Statistical analysis
Continuous variables are expressed as medians (range) and comparisons were made using the Mann-Whitney U test. Categorical variables were compared using χ2 tests or Fisher’s exact tests, where appropriate. Disease specific survival rates were analyzed by Kaplan–Meier and log-rank tests. All statistical analyses were performed using JMP software version 9.0.2 (SAS International Inc., Cary, NC, USA). The level of statistical significance was set at P < 0.05.
Results
Results of expression, SNP, and methylation-arrays
To identify novel tumor-related genes in HCC, we first searched for genes with decreased expression in HCC samples compared with corresponding normal tissue. According to the expression array results, DNM3 was strongly down-regulated in HCC tissue (log2 ratio −1.0, 2-fold decrease in expression; ). Decreased expression of DNM3 mRNA was subsequently confirmed by semi-quantitative RT-PCR in tumor tissue from the same patient ().
Figure 1 Analysis of specimens from a 68-year-old female with HCC.
Abbreviations: DNM3, dynamin 3; HCC, hepatocellular carcinoma; M, methylated; Ma, marker; N, normal; PCR, polymerase chain reaction; U, unmethylated; T, tumor.
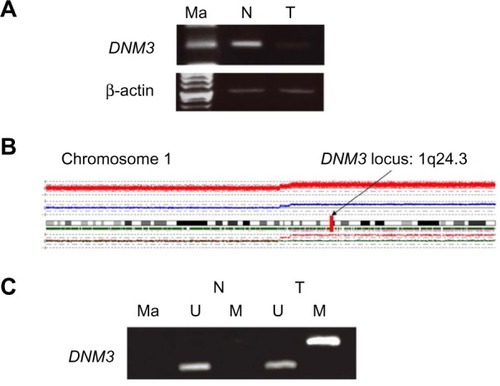
Table 1 Expression array analysis of surgical samples from a 68-year-old female patient with HCC
SNP array analysis of DNA from the same patient revealed deletions in chromosomes 3q, 8p, 11q, 12p, 12q, 16p, 17p, 19p, and X, and chromosomal gains in 1q, 3q, 11q, 12p, and 12q. Although we observed amplifications affecting chromosome 1, which contain the DNM3 gene, no deletions were observed (). A detailed analysis of the SNP array at the DNM3 gene locus (1q24.3) identified 61 SNPs. Of these 61 SNPs, three exhibited a heterozygous AB allele in both the non-cancerous and cancerous samples (). These results suggest that the DNM3 gene locus retained biallelically, and the expression of DNM3 was diminished without chromosomal deletion.
Table 2 Results of SNP signals at the DNM3 gene locus
We subsequently performed methylation array analysis using DNA from the same 68-year-old female HCC patient. The continuous β-values were 0.879 for tumor tissue versus 0.213 for normal tissue, indicating high methylation in the HCC sample (). Using MSP, we confirmed hypermethylation of the DNM3 promoter in tumor tissue obtained from the same HCC patient (). The DNM3 gene was particularly notable, since expression in cancer tissue was decreased despite amplification of the copy number of chromosome 1 containing this gene. Taken together, these results suggest that decreased expression of DNM3 in the absence of loss of heterozygosity (LOH) may be due to promoter hypermethylation.
Table 3 Methylation array analysis of surgical samples from a 68-year-old female patient with HCC
Effect of inhibiting methylation on DNM3 expression in HCC cell lines
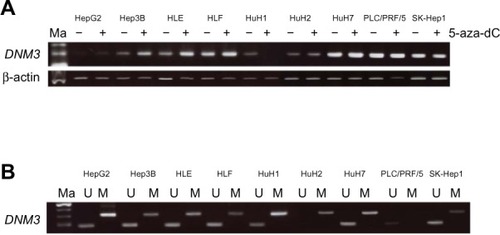
To confirm that silencing of DNM3 expression was due to promoter hypermethylation, we analyzed DNM3 mRNA expression in nine HCC cell lines before and after treatment with 5-aza-dC. Expression of DNM3 was clearly reactivated following 5-aza-dC treatment in three cell lines, Hep3B, HLE, and HuH2, as shown by semi-quantitative RT-PCR ().
Figure 2 (A) Semi-quantitative RT-PCR revealed reactivation of DNM3 expression in three (Hep3B, HLE, and HuH2) of nine HCC cell lines. (B) MSP revealed complete methylation of DNM3 in HuH2, partial methylation in HepG2, Hep3B, HLE, HLF, HuH1, HuH7, and SK-Hep1 and no methylation in PLC/PRF/5 cells.
MSP and UNMSP of HCC cell lines and one primary HCC specimen
We next investigated the methylation status of DNM3 in nine HCC cell lines using primers for (MSP) and (UNMSP). For MSP, bands of the appropriate size were observed for HepG2, Hep3B, HLE, HLF, HuH1, HuH2, HuH7, and SK-Hep1 cell lines (). For UNMSP, appropriate bands were identified in all cell lines, except HuH2 (). These results indicate complete methylation of DNM3 in HuH2, partial methylation in HepG2, Hep3B, HLE, HLF, HuH1, HuH7, and SK-Hep1 and no methylation in PLC/PRF/5 cells.
Sequence analysis
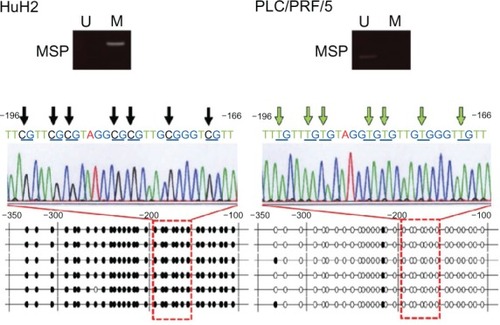
To confirm the results obtained by MSP, we next performed sequence analysis of the DNM3 promoter region in HuH2 and PLC/PRF/5 cells. Almost all CpG dinucleotides in HuH2 were methylated, while those of PLC/PRF/5 were unmethylated (), thus confirming the accuracy of MSP and UNMSP.
Figure 3 Sequence analysis of bisulfite-treated DNA in the DNM3 promoter region.
Abbreviations: DNA, deoxyribonucleic acid; DNM3, dynamin 3; Ma, marker; 5-aza-dc, 5-aza-2′-deoxycytidine; M, methylated; U, unmethylated; MSP, methylation specific PCR; UNMSP, Unmethylated-Specific PCR; PCR, polymerase chain reaction.
MSP and UNMSP of normal and tumor tissues from HCC patients
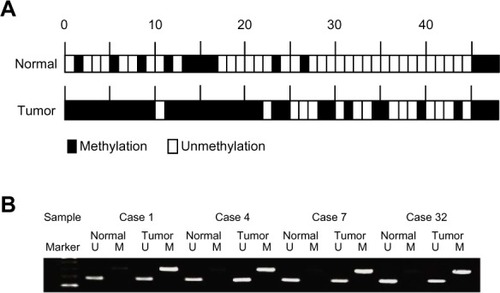
We next assessed DNM3 promoter hypermethylation in tumor and normal tissues from 48 HCC patients. Overall, 68.7% (33/48) of tumor samples displayed DNM3 promoter hypermethylation, compared to 27% (13/48) of normal samples (). Thus, hypermethylation of DNM3 was significantly more frequent in tumor tissues (P < 0.001). Four representative cases of MSP and UNMSP status are shown in .
Figure 4 (A) Methylation status of DNM3 in 48 primary HCC samples. Thirty-three of 48 (68.7%) cancer tissues exhibited hypermethylation of DNM3, compared to 13 of 48 (27.0%) cases in adjacent, normal tissues. (B) Four representative cases showing hypermethylation of the promoter region of DNM3 in tumor tissues and no methylation in normal tissues.
Analysis of DNM3 expression in normal and tumor tissues from HCC patients
We next examined the expression of DNM3 mRNA in the 48 HCC patients by real-time quantitative RT-PCR. The DNM3 expression index was calculated as the value of the tumor tissue expression level divided by the expression level of adjacent normal tissue. Analysis of the association between methylation status and the expression index revealed that hypermethylated cancerous tissues tended to have a lower DNM3 expression index than other tissues examined, however this was not statistically significant (P = 0.189; ).
Figure 5 Expression levels of DNM3 mRNA in specimens from 48 patients with HCC. The expression index [(DNM3-tumor) × (GAPDH-normal)/(DNM3-normal) × (GAPDG-tumor)] was calculated for all 48 cases. A trend towards a lower expression index in methylated cases compared to unmethylated cases was observed, however this was not statistically significant (P = 0.189).
![Figure 5 Expression levels of DNM3 mRNA in specimens from 48 patients with HCC. The expression index [(DNM3-tumor) × (GAPDH-normal)/(DNM3-normal) × (GAPDG-tumor)] was calculated for all 48 cases. A trend towards a lower expression index in methylated cases compared to unmethylated cases was observed, however this was not statistically significant (P = 0.189).](/cms/asset/68fe5691-ecba-44f1-a705-7bd0b52f73d0/dott_a_51913_f0005_b.jpg)
Correlation between DNM3 gene expression and clinicopathological characteristics in HCC patients
We next analyzed the correlation between DNM3 expression and clinicopathological features of the 48 HCC patients. Growth status (expansive growth or infiltrative growth) was the only variable associated with DNM3 expression (). We also observed that patients with decreased DNM3 expression had a worse prognosis compared to patients with increased DNM3 expression (P = 0.014; ). Univariate analysis identified liver damage, cirrhosis and decreased expression of DNM3 as prognostic factors of disease specific survival, however these were not significant in multivariate analysis ().
Figure 6 Disease specific survival stratified by DNM3 (dynamin 3) expression status. Patients with lower DNM3 expression exhibited poorer prognosis with decreased disease specific survival, compared to patients with higher DNM3 expression (P = 0.014).
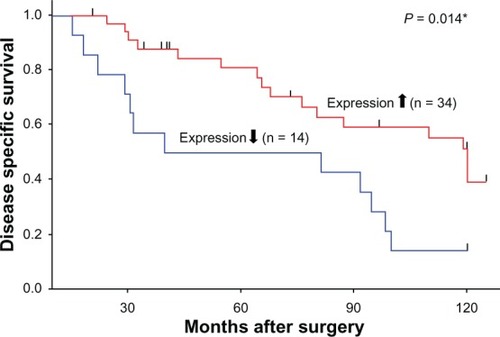
Table 4 Correlation between DNM3 expression and clinico-pathological characteristics in 48 HCC patients
Table 5 Prognostic factors for disease specific survival for 48 HCC patients in univariate and multivariate analysis
Discussion
DNA methylation in the promoter region of several genes in HCC has been previously investigated.Citation22–Citation25 To detect new cancer-related genes in HCC, we developed a double combination array analysis,Citation9–Citation14 and triple combination array analysis including gene expression, SNP and methylation array analysis.Citation15,Citation16 In the current study, we used this triple combination array analysis to identify DNM3 as a candidate tumor suppressor gene in HCC.
DNM3 is a member of the dynamin family of genes that are essential for endocytosis, and possess mechanochemical properties utilized to tabulate and sever membranes.Citation17,Citation26 To date, few studies have investigated the impact of dysregulated DNM3 expression in malignant disease.Citation18,Citation19 Indeed, no studies have yet been conducted to investigate the relationship between HCC and DNM3 expression. A study by Shen et al, reporting genome-wide DNA methylation profiles in 62 HCC patients,Citation27 identified DNM3 in a subset of genes methylated in tumor tissues compared to adjacent normal tissue. However, this study did not evaluate the expression levels of DNM3 or its impact on prognostic outcome. Our current study revealed that methylation of DNM3 downregulates gene expression and is correlated with worse prognosis, suggesting that this gene may represent a novel tumor suppressor gene of HCC.
DNM2 is also a member of the dynamin family. Lee et al reported that low DNM2 expression was associated with tumor invasion and metastasis in invasive squamous cell carcinoma of the cervix.Citation28 This group also demonstrated that inhibition of DNM2 enhanced the expression of metalloproteinase-2 (MMP2), a type IV collagenase,Citation29 whose elevated expression is associated with various carcinomas, including HCC.Citation30–Citation32 MMP2 encodes an enzyme which degrades type IV collagen, the major structured component of the basement membrane. Overexpression of MMP2 may allow cancer cells to cross the epithelial basement membrane, invade surrounding stroma, enter blood vessels or lymphatics, extravasate and establish new proliferating colonies.Citation31 Therefore, decreased expression of DNM3 by promoter methylation may increase the expression of MMP2, thereby contributing to the poor prognosis of these patients.
Using our triple array analysis, we have extracted an interesting molecule, DNM3, and verified an association between gene expression and carcinogenesis or tumor progression, using a panel of 48 primary human specimens. It may be pointed out that the efficiency of the extraction of interesting molecules will be increased if we use multiple cases for arrays. Although we had to check data from many genes for extracting the molecule from array data of one HCC patient, it seems that the results of triple combination array analysis were reliable because we have reported our results after investigation of as many as 48 samples of HCC cases.
In clinical practice, DNM3 expression may be used as a prognostic biomarker for resected HCC patients. The methylation of certain genes, for example p15 in myelodysplastic syndrome (MDS) patients is well documented,Citation33 and hypomethylating agents such as 5-aza-2′-deoxycytidine (decitabine) have already been introduced in the clinical setting for MDS patients.Citation34 In the future, decitabine may also be used in patients with aberrant methylation of DNM3.
In conclusion, we identify DNM3 as a new candidate tumor suppressor gene in HCC by triple combination array analysis. Further studies are required to confirm the role of this gene as a tumor suppressor in carcinogenesis.
Acknowledgments
This work was supported by Japan Society for the Promotion of Science (JSPS) KAKENHI Grant-in-Aid for Scientific Research (C) Number 22591427.
Disclosure
The authors report no conflicts of interest in this work.
References
- FerlayJShinHRBrayFFormanDMathersCParkinDMEstimates of worldwide burden of cancer in 2008: GLOBOCAN 2008Int J Cancer2010127122893291721351269
- FornerALlovetJMBruixJHepatocellular carcinomaLancet201237998221245125522353262
- LivraghiTGoldbergSNLazzaroniSMeloniFSolbiatiLGazelleGSSmall hepatocellular carcinoma: treatment with radio-frequency ablation versus ethanol injectionRadiology1999210365566110207464
- TakayasuKAriiSIkaiILiver Cancer Study Group of JapanProspective cohort study of transarterial chemoembolization for unresectable hepatocellular carcinoma in 8510 patientsGastroenterology2006131246146916890600
- LlovetJMRicciSMazzaferroVSHARP Investigators Study GroupSorafenib in advanced hepatocellular carcinomaN Engl J Med2008359437839018650514
- YuMCYuanJMEnvironmental factors and risk for hepatocellular carcinomaGastroenterology20041275 Suppl 1S72S7815508106
- CusnirMPattYZNovel systemic therapy options for hepatocellular carcinomaCancer J20041029710315130269
- El-SeragHBRudolphKLHepatocellular carcinoma: epidemiology and molecular carcinogenesisGastroenterology200713272557257617570226
- KandaMNomotoSOkamuraYDetection of metallothionein 1G as a methylated tumor suppressor gene in human hepatocellular carcinoma using a novel method of double combination array analysisInt J Oncol200935347748319639168
- NomotoSKandaMOkamuraYEpidermal growth factor-containing fibulin-like extracellular matrix protein 1, EFEMP1, a novel tumor-suppressor gene detected in hepatocellular carcinoma using double combination array analysisAnn Surg Oncol201017392393219898900
- OkamuraYNomotoSKandaMLeukemia inhibitory factor receptor (LIFR) is detected as a novel suppressor gene of hepatocellular carcinoma using double-combination arrayCancer Lett2010289217017719733004
- OkamuraYNomotoSKandaMReduced expression of reelin (RELN) gene is associated with high recurrence rate of hepatocellular carcinomaAnn Surg Oncol201118257257920734148
- KandaMNomotoSOkamuraYPromoter hypermethylation of fibulin 1 gene is associated with tumor progression in hepatocellular carcinomaMol Carcinog201150857157921268132
- HayashiMNomotoSKandaMIdentification of the A kinase anchor protein 12 (AKAP12) gene as a candidate tumor suppressor of hepatocellular carcinomaJ Surg Oncol2012105438138622052684
- OkamuraYNomotoSHayashiMIdentification of the bleomycin hydrolase gene as a methylated tumor suppressor gene in hepatocellular carcinoma using a novel triple-combination array methodCancer Lett2011312215015721943823
- HishidaMNomotoSInokawaYEstrogen receptor 1 gene as a tumor suppressor gene in hepatocellular carcinoma detected by triple-combination array analysisInt J Oncol2013431889423695389
- OrthJDMcNivenMADynamin at the actin-membrane interfaceCurr Opin Cell Biol2003151313912517701
- BookenNGratchevAUtikalJSézary syndrome is a unique cutaneous T-cell lymphoma as identified by an expanded gene signature including diagnostic marker molecules CDO1 and DNM3Leukemia200822239339918033314
- TeicherBASearching for molecular targets in sarcomaBiochem Pharmacol201284111022387046
- BibikovaMFanJBGoldenGate assay for DNA methylation profilingMethods Mol Biol200950714916318987813
- TakaiDJonesPAThe CpG island searcher: a new WWW resourceIn Silico Biol (Gedrukt)20033323524012954087
- YoshikawaHMatsubaraKQianGSSOCS-1, a negative regulator of the JAK/STAT pathway, is silenced by methylation in human hepatocellular carcinoma and shows growth-suppression activityNat Genet2001281293511326271
- WongIHLoYMZhangJDetection of aberrant p16 methylation in the plasma and serum of liver cancer patientsCancer Res199959171739892188
- YangBGuoMHermanJGClarkDPAberrant promoter methylation profiles of tumor suppressor genes in hepatocellular carcinomaAm J Pathol200316331101110712937151
- LeeSLeeHJKimJHLeeHSJangJJKangGHAberrant CpG island hypermethylation along multistep hepatocarcinogenesisAm J Pathol200316341371137814507645
- SeverSDynamin and endocytosisCurr Opin Cell Biol200214446346712383797
- ShenJWangSZhangYJGenome-wide DNA methylation profiles in hepatocellular carcinomaHepatology20125561799180822234943
- LeeYYDoIGParkYALow dynamin 2 expression is associated with tumor invasion and metastasis in invasive squamous cell carcinoma of cervixCancer Biol Ther201010432933520574164
- DevarajanPJohnstonJJGinsbergSSVan WartHEBerlinerNStructure and expression of neutrophil gelatinase cDNA. Identity with type IV collagenase from HT1080 cellsJ Biol Chem19922673525228252321460022
- GaoJDingFLiuQYaoYKnockdown of MACC1 expression suppressed hepatocellular carcinoma cell migration and invasion and inhibited expression of MMP2 and MMP9Mol Cell Biochem20133761–2213223232575
- EgebladMWerbZNew functions for the matrix metalloproteinases in cancer progressionNat Rev Cancer20022316117411990853
- DeryuginaEIQuigleyJPMatrix metalloproteinases and tumor metastasisCancer Metastasis Rev200625193416680569
- DaskalakisMNguyenTTNguyenCDemethylation of a hypermethylated P15/INK4B gene in patients with myelodysplastic syndrome by 5-Aza-2′-deoxycytidine (decitabine) treatmentBlood200210082957296412351408
- KantarjianHIssaJPRosenfeldCSDecitabine improves patient outcomes in myelodysplastic syndromes: results of a phase III randomized studyCancer200610681794180316532500