 ?Mathematical formulae have been encoded as MathML and are displayed in this HTML version using MathJax in order to improve their display. Uncheck the box to turn MathJax off. This feature requires Javascript. Click on a formula to zoom.
Abstract
Purpose
Considerable anatomical changes occur during intensity-modulated radiotherapy (IMRT) for nasopharyngeal carcinoma (NPC). This study aimed to quantify volumetric and positional variations of the target volume during IMRT.
Materials and methods
Twenty patients with locally advanced NPC who received concurrent (13 patients) or sequential (seven patients) chemoradiotherapy were prospectively recruited and underwent planning computed tomography (CT) and six repeat CTs (every five fractions). Each repeat CT was rigidly registered to the planning CT. Gross tumor volume (GTV) and elective clinical target volume (CTV) were manually delineated on each axial CT image. CTVs of the primary tumor and lymph nodes were expanded with 5 mm margins to corresponding GTVs, with necessary modifications. Volume loss, system and random errors, and the mean and three-dimensional vector displacements were calculated and compared statistically.
Results
Volumes of the primary tumor and small (>1 cm, ≤3 cm) and large (>3 cm) positive neck lymph nodes decreased at a rate of 2.6%, 3.7%, and 3.9% per treatment day, respectively. CTVs of the primary tumor, lymph nodes, and elective region decreased 1.5%, 2.3%, and 0.3% per treatment day, respectively. Average displacements of the GTVs and CTVs were <1.3 mm in all directions. GTVs and CTVs of the large and small lymph nodes shifted medially by 0.8–1.3 and 0.6–1.2 mm, respectively, on average. Average three-dimensional displacements of the GTVs and CTVs were 3.4–4.3 mm and 2.5–3.7 mm, respectively. Volume loss and displacements in most directions were significantly larger in patients receiving concurrent chemoradiotherapy than in those receiving sequential therapy. Volume loss and displacements of the GTV of large nodes and elective CTV were significantly larger in male than in female patients.
Conclusion
Volumetric and positional changes of the target volume were considerable, and volume loss increased as treatment time elapsed during IMRT for NPC.
Introduction
Nasopharyngeal carcinoma (NPC) differs from other head and neck cancers in terms of its distinctly skewed geographic and ethnic distribution, as well as its aggressive locoregional behavior, with a high predilection for distant failure and special therapeutic considerations.Citation1 Use of intensity-modulated radiotherapy (IMRT) for the treatment of NPC has demonstrated advantages with regard to dose conformity, local control, and normal tissue sparing.Citation2–Citation4 As one of the prerequisites for these advantages, geometrical accuracy is an important requirement throughout the course of IMRT. However, for patients with head and neck cancer, considerable geometrical variations can occur during the 6–7-week-long IMRT regimen, which results from many factors such as tumor volume, positional changes of the tumor and/or organ at risk, and the weight loss of patients.Citation5 Several studies demonstrated that both the volume and the position of the target volume (TV) changed significantly during radiation therapy (RT) for head and neck cancer, resulting in dose uncertainties.Citation5–Citation13 Two of these studies also reported the displacement of the gross tumor volume (GTV) and/or clinical TV (CTV).Citation6,Citation8 Only two studies that included NPC patients showed the variations of the GTVs during RT.Citation10,Citation11 Lu et alCitation12 included 43 NPC patients in their study, but the use of volume reduction at a single time point as the sole endpoint was too simple to show the longitudinal changes in TVs. This underscored the need to quantify, more broadly, the geometrical changes of NPC during IMRT. Therefore, the purpose of this study was to analyze the dynamic volume and position changes of TV for NPC during IMRT in an endemic region (People’s Republic of China), which might provide comprehensive information on the use of adaptive RT for NPC.
Materials and methods
Patients and images
Twenty patients with treatment-naïve, locally advanced NPC were recruited prospectively (approved by the ethical committee of the Hubei Cancer Hospital, Wuhan, People’s Republic of China), and all patients provided written informed consent. The clinical characteristics of the patients are shown in . The patients were immobilized using individualized thermoplastic masks (covering the head, neck, and shoulders) in the supine position. Planning computed tomography (pCT) using a Brilliance Big Bore CT simulator (Philips, Inc, Cleveland, OH, USA) with intravenous contrast was performed with a 0.5 × 0.5 mm pixel size and a 2.5 mm slice thickness from the vertex to 2 cm caudal to the sternal manubrium. Each patient underwent repeat CT (rCT) scans after the fifth, tenth, 15th, 20th, 25th, and 30th fraction (six weekly rCTs following the same protocol, but without intravenous contrast, as used for the pCT). For ease of presentation, rCT is described as CTn, where n (n=1, 2, 3, 4, 5, 6) represents the week of rCT scanning, and pCT is described as CT0. All images were saved in Digital Imaging and Communications in Medicine format.
Table 1 Clinical characteristics of 20 patients with locally advanced NPC
Chemotherapy
Thirteen patients received concurrent chemoradiotherapy (CRT), and seven received sequential CRT. Among patients receiving concurrent CRT, seven received cisplatin (CDDP; 75 mg/m2) on day 1 and 5-fluorouracil (5-FU; 1,000 mg/m2) on days 1 to 4, and this cycle was repeated every 4 weeks. Five patients received weekly CDDP (40 mg/m2), and another patient received weekly cetuximab that began the week before the first fraction with a dose of 400 mg/m2, and it was followed by weekly administration of 250 mg/m2 for a total of seven infusions. In patients receiving sequential CRT, two cycles of induction chemotherapy and another two cycles of adjuvant chemotherapy with CDDP+5-FU (the dose was the same as above) were given to five patients, and the other two patients were treated with docetaxel and CDDP (both dosed at 75 mg/m2).
Definition of target volume
In-house-developed software (WoldMatch, Department of Radiation Oncology, The Netherlands Cancer Institute, Amsterdam, The Netherlands) was used for image registration and TV delineation. Each rCT was first rigidly registered with the corresponding pCT after importing all CT images. The rigid registration was based on a bony match in order to eliminate the effect of setup error and to align the seven CT images to share the same coordinate system. Rigid registration was performed on the region defined by one clip box that was large enough to cover the whole planning TV (PTV). The results of the rigid registration were evaluated by visual inspection.
TVs were delineated manually using the Hubei Cancer Hospital treatment protocol. The GTV of the primary tumor (GTV_T) and the involved neck lymph nodes (GTV_N) included all macroscopic disease detected in both the diagnostic CT and magnetic resonance images, following the clinical protocol. An isotropic 5 mm margin was applied around the GTV_T and GTV_N to generate the CTV of the primary tumor (CTV_T) and positive nodes (CTV_N), both on the pCT and rCTs. Subsequently, these structures were modified manually to exclude areas such as air cavities and uninvolved bone. For the TV of positive lymph nodes, we arbitrarily divided the large (diameter >3 cm) and small (diameter ≤3 cm and >1 cm) nodes according to the minimum diameter on the axial plane; these TVs were abbreviated as GTV_Nl and CTV_Nl for the large nodes, and GTV_Ns and CTV_Ns for the small nodes. Low-risk CTV (CTV_Lr) described the regions with potential microscopic disease, as well as the neck nodal levels defined by the protocol described by Lin et al.Citation14 CTV_Lr included the entire nasopharynx and the surrounding structures such as the posterior part of the nasal cavity, posterior maxilla, pterygopalatine fossa, posterior ethmoid sinus, parapharyngeal space, skull base, anterior third of the clivus, inferior sphenoid sinus and cavernous sinus, retropharyngeal nodal regions from the base of the skull to the caudal edge of the second cervical vertebra, as well as the bilateral neck nodal levels 2, 3, and the cranial part of level 5, defined according to international consensus guidelines.Citation15,Citation16 CTV_Lr should have completely covered all the CTV_T and CTV_N, and the most caudal slice was the caudal edge of cricoid cartilage. PTV_Lr, PTV_T, and PTV_N were expanded from CTV_Lr, CTV_T, and CTV_N, respectively, with an additional 5 mm margin. The TVs on each rCT were copied from the corresponding pCT, and necessary modifications were made according to the anatomical changes. The same radiation oncologist (WT) performed all delineations, which minimized observer-related delineation uncertainties.
IMRT planning and delivery
IMRT plans were designed using nine equiangular (every 40° from 0° to 360°) coplanar beams. Inverse dynamic planning was generated by Varian Eclipse™ treatment planning software systems (Eclipse™ version 8.6; Varian Medical Systems Inc., Palo Alto, CA, USA). A mono-isocentric technique was used for all beams. The individualized prescribed dose was 69.3–72.6 Gy in 33 fractions (2.1–2.2 Gy/fraction) to the PTV_T and/or PTV_N, 59.4–62.7 Gy (1.8–1.9 Gy/fraction) to the high-risk CTV, and 54.0 Gy in 28 daily fractions to the PTV_Lr. Dose-volume constraints and priorities were set individually according to the protocol of the Hubei Cancer Hospital. The lower neck (below the caudal edge of the body of cricoid cartilage) and supraclavicular fossae were irradiated with a single anterior field. The prescribed dose of this single anterior field was 50.0 Gy delivered in the first 25 fractions. All treatments were delivered using a computer-controlled auto-sequence, multi-leaf collimator on a Varian linear accelerator equipped with Millennium 80 Multi-leaf collimator system (Varian Medical Systems Inc.). All patients were treated with one fraction daily, 5 days per week. The actual treatment received by the patients in the weeks following the initial RT remained the same, and the study was designed only to document and calculate the dynamic changes.
Calculation of volume reduction and the displacement of center of mass
The volume of GTVs and CTVs in pCT or rCT (VCT) and the coordinates of the center of mass (COM) in left–right (LR), cranial–caudal (CC), and anterior–posterior (AP) directions of the GTVs and CTVs were automatically calculated. Volume reduction was calculated as follows:
using the initial volume on pCT as the reference. In a single direction, six displacements could be obtained for a TV, and then the mean displacement, system error, and random error were calculated.Citation17 The three-dimensional (3D) vector of displacement, a value combining errors recorded along all three axes, was calculated as the square root of the DLR2, DCC2, and DAP2 mean errors (DLR, DCC, and DAP were the displacements in the LR CC, and AP directions, respectively).
Statistical analysis
For volume reduction and displacements of the COM, the differences between various weeks were compared using oneway analysis of variance. The differences between concurrent and sequential CRT, and between male and female patients, were compared using the Student’s t-test. The rate of the TV change over time, or the volume reduction with weight loss, was calculated using linear regression analysis. All tests were two-tailed, and a 5% significance level was used when establishing statistical significance. The Statistical Package for the Social Sciences (SPSS version 20.0; IBM Corporation, Armonk, NY, USA) and Microsoft Office Excel (Microsoft Office 2003; Microsoft Corporation, Redmond, WA, USA) were used in the above statistical analyses.
Results
Volume reduction of GTVs and CTVs
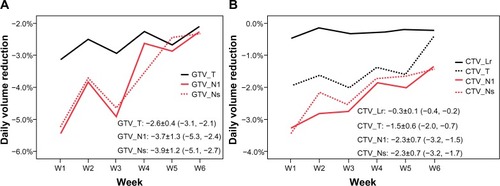
The total volume of all GTVs and CTVs decreased throughout the treatment course ( and ). Compared with the initial volume on pCT, the volumes of GTV_T, GTV_Nl, and GTV_Ns decreased by 55.3%, 68.3%, and 66.9%, respectively, at the last rCT ( and ). The CTV_T, CTV_Nl, CTV_Ns, and CTV_Lr decreased by 71.1%, 52.0%, 52.1%, and 7.6%, respectively. Per treatment day, the GTV_T, GTV_Nl, and GTV_Ns decreased at a mean rate of 2.6%, 3.7%, and 3.9%, respectively, and the CTV_T, CTV_Nl, CTV_Ns, and CTV_Lr decreased at a mean rate of 1.5%, 2.3%, 2.3%, and 0.3%, respectively (). For all GTVs and CTVs, the volume reduction in the different weeks was statistically significantly (P<0.05). The largest tumor loss occurred in the first 3 weeks, and after week 4, the rate of volume loss began to decrease ().
Figure 1 The gross tumor volume of the primary tumor, as well as of the large and small lymph nodes on planning CT and six repeat CTs.
Abbreviation: CT, computed tomography.
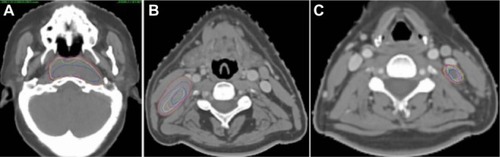
Figure 2 The volume reduction of target volumes. The volume reduction of GTV_T, CTV_T, CTV_Lr (A), GTV_Ns, CTV_Ns (B), and GTV_Nl, CTV_Nl (C) in different week.
Abbreviations: GTV_T, gross tumor volume of the primary tumor; CTV_Lr, clinical target volume of the elective region; CTV_T, clinical target volume of the primary tumor; GTV_Ns, gross tumor volume of small lymph nodes; CTV_Ns, clinical target volume of small lymph nodes; GTV_Nl, gross tumor volume of large lymph nodes (minimum diameter >3.0 cm); CTV_Nl, clinical target volume of large lymph nodes.
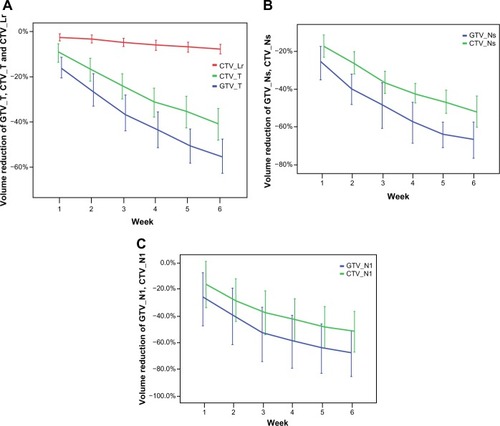
Figure 3 GTV (A) and CTV (B) loss per treatment day.
Abbreviations: GTV_T, gross tumor volume of the primary tumor; GTV_Nl, gross tumor volume of large lymph nodes (minimum diameter >3.0 cm); GTV_Ns, gross tumor volume of small lymph nodes; W, week; CTV_Lr, clinical target volume of the elective region; CTV_T, clinical target volume of the primary tumor; CTV_Nl, clinical target volume of large lymph nodes; CTV_Ns, clinical target volume of large lymph nodes.
Displacement of center of mass
Both the gross primary tumors and lymph nodes shrank asymmetrically (), and the displacements due to system and random errors of all TVs are shown in . The mean COM displacements of the GTV_T and CTV_Lr were less than 1.3 mm in all directions, and their average 3D displacements were 2.5 and 3.4 mm, respectively (). The average COM displacements of all GTV_N were less than 0.8 mm in all directions, and the 3D vector displacement of GTV_Nl and GTV_Ns were 4.3 mm and 3.7 mm, respectively ().
Table 2 The mean, system, and random error of center of mass displacements of the target volumes (mm)
With regard to positive neck lymph nodes, seven patients had eight large nodes (five on the left side and three on the right), and eleven patients had 24 small nodes (eleven on the left side and 13 on the right). When corrected for the nodes on the left and right sides, we found that the largest displacements of lymph node TV were in the lateral–medial direction, and all of them shifted medially. The GTV_Nl on the left and right sides shifted medially by a mean of 1.0 mm and 1.3 mm, respectively. In addition, the GTV_Ns on both the left and right sides shifted medially by a mean of 0.8 mm. Similarly, the CTV_Nl on the left and right sides shifted medially by a mean of 0.6 mm and 0.8 mm, respectively. The CTV_Ns on both the left and right sides shifted medially by a mean of 1.2 mm ().
Table 3 The COM displacements in the lateral-medial direction and 3D vector of the left and right side neck lymph nodes (mm)
Comparison of concurrent and sequential chemoradiotherapy
The initial volumes of GTV_T, CTV_T, GTV_Ns, CTV_Ns, and CTV_Lr between the patients with concurrent and sequential CRT was not statistically different, but those of GTV_Nl and CTV_Nl were significantly different. Generally, the volume reduction in patients on concurrent CRT was larger than that in patients on sequential therapy, and the differences of volume reduction between the concurrent and sequential CRT in GTV_Nl, GTV_Ns, CTV_Nl, CTV_Ns, and CTV_Lr were statistically significant (P<0.05) (). For all TVs, the mean displacements in all direction were <1.3 mm. The 3D vector displacements of GTV_Nl, GTV_Ns, and CTV_Lr were significantly larger in concurrent CRT patients ().
Table 4 The volume reduction and the center of mass displacements of target volumes in Con and Seq CRT (mean ± standard deviation)
Comparison between male and female patients
The initial volume of GTV and CTV (except for the CTV_Lr) between the males and females was not statistically different. The volume reductions of GTV_Ns, CTV_Ns, and CTV_Nl were significantly larger in male patients (). The mean displacements of GTV_Nl and CTV_Lr were less than 1.8 mm in all directions, and the 3D vector displacements of GTVs and CTVs were not significantly different between the male and female patients ().
Table 5 The volume reduction and the center of mass displacements of target volumes in male and female patients (mean ± standard deviation)
Volume reduction and weight loss
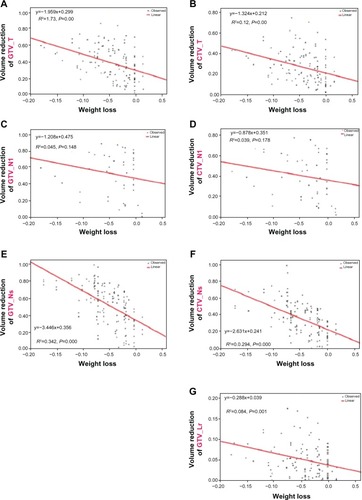
At the 30th fraction, weight loss ranged from 2.2% to 17.8%, with a mean of 7.9%. The total and weekly weight losses were 4.3%±4.2% and 1.4%±1.6%, respectively (). The volume reductions of GTV_T, CTV_T, GTV_Ns, CTV_Ns, and CTV_Lr correlated significantly with weight loss (). However, the volume reductions of both GTV_Nl and CTV_Nl did not significantly correlate with weight loss and could be unpredictable ().
Figure 4 Weight loss of 20 NPC patients during chemo–IMRT.
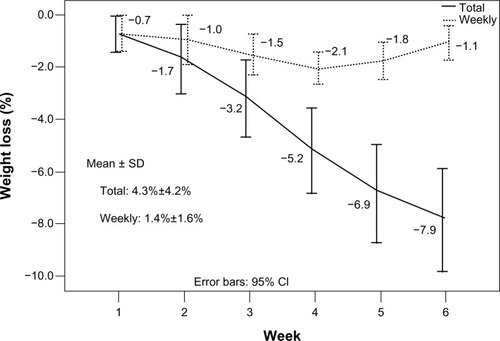
Figure 5 Linear regression between volume reduction and weight loss.
Abbreviations: GTV_T, gross tumor volume of the primary tumor; CTV_T, clinical target volume of the primary tumor; GTV_Nl, gross tumor volume of large lymph nodes (minimum diameter >3.0 cm); CTV_Nl, clinical target volume of large lymph nodes; GTV_Ns, gross tumor volume of small lymph nodes (minimum diameter >1.0 cm and ≤3.0 cm); CTV_Ns, clinical target volume of small lymph nodes; CTV_Lr, clinical target volume of the elective region.
Discussion
Our study showed that TVs of NPC changed dramatically throughout the treatment course in the context of CRT. The GTV decreased at a rate of 2.6%–3.9%, and the CTV_T and CTV_N decreased at a rate of 1.5% and 2.3%, respectively; the elective CTV decreased at a rate of 0.3% per treatment day. The average COM displacement of all TVs was less than 1.3 mm in all directions. The neck lymph nodes shifted medially by 0.8–1.3 mm, and the average 3D vector displacement of the large and small lymph nodes was 3.2–4.3 mm. The tumor loss was greater in patients receiving concurrent CRT than in those receiving sequential therapy. These significant geometric variations underscore the need to develop an adaptive strategy.
Several studies have demonstrated an obvious volume reduction of the GTV during RT. In a study by Barker et al,Citation6 14 patients with head and neck cancer were included, and the prescribed dose was 60–72 Gy with 30–42 fractions.Citation6 The GTV_T decreased 0.7 cm3 (1.7%), and the GTV_N decreased 0.3 cm3 (1.7%) per treatment day. On the last day of treatment, the volume loss of GTVs was approximately 70%. In the studies of Geets et alCitation7 and Castadot et al,Citation8 the GTV_T of ten patients with pharyngolaryngeal cancer experienced significant volume reductions after receiving a mean dose of 45 Gy. The GTV_T decreased an average of 65.5%. The GTV_T decreased an average of 3.2%, and the GTV_N, CTV_T, and CTV_N decreased 2.2%, 2.6%, and 1.5% per treatment day, respectively. The global therapeutic CTV decreased 2.4% per treatment day.Citation8 Another study included ten patients with oropharyngeal cancer, and the GTV reduction was 25% after RT of 46 Gy.Citation9 A recent study of IMRT in 19 locally advanced NPC cases by Cheng et alCitation18 showed that the volumes of the primary tumor and lymph nodes decreased 9.1% and 13.1% (treated with 30 Gy) and 16.2% and 28.7% (treated with 50 Gy), respectively. Many factors might explain these differences, such as the number of fractions and the various radiation doses received at the time of CT scanning, heterogeneous response to treatment, the TV definition, and the effect of image quality on delineation accuracy.
The response of the tumor to treatment will affect the positional change, and the displacement of COM was used to estimate this change in previous studies.Citation6,Citation8 The median COM displacement of the GTV was 3.3 mm in head and neck cancers.Citation6 In pharyngolaryngeal tumors, the COM of the GTV_T and CTV_T shifted laterally 1.3 mm and 1.5 mm, respectively, and the GTV_N and CTV_N shifted medially 1.0 mm and 0.9 mm, respectively.Citation8 In our study, the medial shift of the neck lymph nodes was 0.8–1.3 mm, and the CTV of the lymph nodes shifted medially 0.6–1.2 mm. The displacements of the GTV_T and large and small lymph nodes showed a different trend. For example, the displacements of the GTV_T were larger in the LR and AP directions than in the CC direction. One possible reason was that the primary tumor shrank from the air cavity, and the posterior part that abutted the stable vertebrae and muscles shifted (as shown in ). The displacements of the small nodes in the three directions were comparable, yet those of the large nodes were more significant in the CC direction.
Different treatment strategies can result in different tumor responses, thereby resulting in different volumes, positions, and shape variations of the TV. In a study by Bhide et al,Citation10 20 head and neck patients received two cycles of induction chemotherapy followed by IMRT, and repeat CT scans were performed at weeks 2, 3, 4, and 5. They found that the largest CTV reduction was between weeks 0 and 2, with a mean reduction of 3.2%–10.5%.Citation10 In our study, the patients receiving concurrent CRT underwent a larger tumor loss than those receiving sequential therapy. Similarly, more rapid tumor loss occurred in the first 3 weeks. This might provide some information about the timing of replanning if needed. From the present study, it seems best to adapt the geometric changes no later than the 3rd week. In addition, the volume loss and positional variation were different between the men and women in our study. All these data suggest that the timing of replanning should be individualized, while taking into consideration the different treatment strategies, gender, weight loss during RT, and the size and anatomical position of positive lymph nodes.
During RT, the planned dose should be delivered to both macroscopic and microscopic disease. Macroscopic disease can be easily defined with the help of advanced imaging modalities such as CT, magnetic resonance, and/or positron emission tomography. However, this is not always the case for microscopic disease. In our study, an isotropic margin surrounding the macroscopic disease was used to cover all possible microscopic disease during pCT. This margin was also added to the regressing tumor on repeat images, without taking into account the heterogeneous response of the tumor itself to treatment. We simply assumed that microscopic disease shifted with the shrinking tumor, an assumption that cannot be easily validated. However, in the present clinical setting, it might be safer to conserve the prescribed dose to the initial TV because of the limited spatial resolution of images that affects the accurate detection of microscopic disease.Citation5
To our knowledge, this study presented the most detailed information about the TV changes of NPC during IMRT in an endemic region. However, some limitations existed in our study. First, the accuracy of the target definition might be influenced by the image quality without contrast on repeat CT. Though the use of CT contrast during repeated image acquisition might improve the quality and contouring accuracy, this seems inappropriate and impractical. Second, interobserver variation in our study was eliminated because a single physician contoured all TVs, and the intraobserver variability was minimized by the use of a copy-and-modification strategy. Third, any misalignments of TV between rigid image registrations were not included in this study. In addition, the deformable registration might improve local alignment.Citation19 Fourth, the uniform margin of 5 mm might not be large enough to cover all microscopic disease surrounding the primary tumor, although there is no clinically reliable way to verify this at present.Citation17 Finally, the results of the subgroup analysis should be interpreted with caution because of the small sample size and potential biases; further study with a larger population is warranted. Despite these weaknesses, our results still provide valuable information for the future use of adaptive RT in the treatment of NPC.
Conclusion
During chemo–IMRT for patients with NPC, both the volume and position of the TV undergo significant changes throughout the treatment course, and these variations show an obvious time trend. The volume reduction continued to increase along with an increase in the number of radiation fractions delivered. The average 3D displacements of the TV were 2.5–4.3 mm, and the neck lymph nodes shifted medially with a mean value of 0.8–1.3 mm. It seems reasonable to replan individually in the first 3 weeks, and to comprehensively take into account various factors such as treatment modality, gender, size and anatomical position of the tumor, and weight loss. Treatment adaptation for anatomical changes is needed, to a lesser extent, in the presence of neoadjuvant chemotherapy. The impact on dose distribution resulting from anatomical variations and the optimal adaptive strategies remain topics for further investigation.
Acknowledgments
This research was financially supported by the Hubei Health Funding (JX6B25) and Hubei Nature Science Funding (2013CFB059). The funders had no role in the study design, data collection and analysis, decision to publish, or preparation of the manuscript. Editorial assistance was provided by Editage. We are grateful to Jan-Jakob Sonke and Coen Rasch from the Department of Radiation Oncology, The Netherlands Cancer Institute, Amsterdam, The Netherlands, who generously offered their software for this research and provided comments on this manuscript.
This study was presented at the annual meeting of the American Society of Radiation Oncology, Atlanta, GA, USA, September 22–25, 2013.
Disclosure
The authors report no conflicts of interest in this work.
References
- LeeAWLinJCNgWTCurrent management of nasopharyngeal cancerSemin Radiat Oncol201222323324422687948
- GrégoireVDe NeveWEisbruchALeeNVan den WeyngaertDVan GestelDIntensity-modulated radiation therapy for head and neck carcinomaOncologist200712555556417522243
- XiaoWWHuangSMHanFLocal control, survival, and late toxicities of locally advanced nasopharyngeal carcinoma treated by simultaneous modulated accelerated radiotherapy combined with cisplatin concurrent chemotherapy: long-term results of a phase 2 studyCancer201111791874188321509764
- NuttingCMMordenJPHarringtonKJPARSPORT trial management groupParotid-sparing intensity modulated versus conventional radiotherapy in head and neck cancer (PARSPORT): a phase 3 multicentre randomised controlled trialLancet Oncol201112212713621236730
- CastadotPLeeJAGeetsXGrégoireVAdaptive radiotherapy of head and neck cancerSemin Radiat Oncol2010202849320219546
- BarkerJLGardenASAngKKQuantification of volumetric and geometric changes occurring during fractionated radiotherapy for head-and-neck cancer using an integrated CT/linear accelerator systemInt J Radiat Oncol Biol Phys200459496097015234029
- GeetsXTomsejMLeeJAAdaptive biological image-guided IMRT with anatomic and functional imaging in pharyngo-laryngeal tumors: impact on target volume delineation and dose distribution using helical tomotherapyRadiother Oncol200785110511517562346
- CastadotPGeetsXLeeJAChristianNGrégoireVAssessment by a deformable registration method of the volumetric and positional changes of target volumes and organs at risk in pharyngo-laryngeal tumors treated with concomitant chemo-radiationRadiother Oncol201095220921720385413
- Vásquez OsorioEMHoogemanMSAl-MamganiATeguhDNLevendagPCHeijmenBJLocal anatomic changes in parotid and submandibular glands during radiotherapy for oropharynx cancer and correlation with dose, studied in detail with nonrigid registrationInt J Radiat Oncol Biol Phys200870387588218262099
- BhideSADaviesMBurkeKWeekly volume and dosimetric changes during chemoradiotherapy with intensity-modulated radiation therapy for head and neck cancer: a prospective observational studyInt J Radiat Oncol Biol Phys20107651360136820338474
- HansenEKBucciMKQuiveyJMWeinbergVXiaPRepeat CT imaging and replanning during the course of IMRT for head-and-neck cancerInt J Radiat Oncol Biol Phys200664235536216256277
- LuNFengLCCaiBNHouJWangYLXieCBClinical study on the changes of the tumor target volume and organs at risk in helical tomotherapy for nasopharyngeal carcinomaChin Med J (Engl)20121251879022340471
- SchwartzDLCurrent progress in adaptive radiation therapy for head and neck cancerCurr Oncol Rep201214213914722328127
- LinSPanJHanLZhangXLiaoXLuJJNasopharyngeal carcinoma treated with reduced-volume intensity-modulated radiation therapy: report on the 3-year outcome of a prospective seriesInt J Radiat Oncol Biol Phys20097541071107819362784
- GrégoireVLevendagPAngKKCT-based delineation of lymph node levels and related CTVs in the node-negative neck: DAHANCA, EORTC, GORTEC, NCIC, RTOG consensus guidelinesRadiother Oncol200369322723614644481
- GrégoireVEisbruchAHamoirMLevendagPProposal for the delineation of the nodal CTV in the node-positive and the post-operative neckRadiother Oncol2006791152016616387
- van HerkMErrors and margins in radiotherapySemin Radiat Oncol2004141526414752733
- ChengHCWuVWNganRKA prospective study on volumetric and dosimetric changes during intensity-modulated radiotherapy for nasopharyngeal carcinoma patientsRadiother Oncol2012104331732322551564
- KesslerMLImage registration and data fusion in radiation therapyBr J Radiol200679Spec No 1S99S10816980689