Abstract
Molecular imaging plays a key role in personalized medicine and tumor diagnosis. Quantum dots with near-infrared emission spectra demonstrate excellent tissue penetration and photostability, and have recently emerged as important tools for in vivo tumor imaging. Integrin αvβ3 has been shown to be highly and specifically expressed in endothelial cells of tumor angiogenic vessels in almost all types of tumors, and specifically binds to the peptide containing arginine-glycine-aspartic acid (RGD). In this study, we conjugated RGD with quantum dots with emission wavelength of 800 nm (QD800) to generate QD800-RGD, and used it via intravenous injection as a probe to image tumors in nude mice bearing head and neck squamous cell carcinoma (HNSCC). Twelve hours after the injection, the mice were still alive and were sacrificed to isolate tumors and ten major organs for ex vivo analysis to localize the probe in these tissues. The results showed that QD800-RGD was specifically targeted to integrin αvβ3 in vitro and in vivo, producing clear tumor fluorescence images after the intravenous injection. The tumor-to-background ratio and size of tumor image were highest within 6 hours of the injection and declined significantly at 9 hours after the injection, but there was still a clearly visible tumor image at 12 hours. The greatest amount of QD800-RGD was found in liver and spleen, followed by tumor and lung, and a weak fluorescence signal was seen in tibia. No detectable signal of QD800-RGD was found in brain, heart, kidney, testis, stomach, or intestine. Our study demonstrated that using integrin αvβ3 as target, it is possible to use intravenously injected QD800-RGD to generate high quality images of HNSCC, and the technique offers great potential in the diagnosis and personalized therapy for HNSCC.
Introduction
Globally, there are approximately 650,000 newly diagnosed patients with head and neck cancer annually, ranking it sixth among all cancers.Citation1 Of them, 90% are head and neck squamous cell carcinoma (HNSCC).Citation2 Surgery remains the major therapeutic option for HNSCC;Citation3–Citation5 however, the failure rate for complete removal of the cancer may be as high as 40%,Citation6,Citation7 due to the fact that clinical doctors are currently not able to see the tumor–normal boundary during the operation in a real-time way. Currently, boundary determination is based on magnetic resonance imaging and computed tomography images taken before the operation, as well as by personal experience and by feeling for changes in tissue texture around the tumor. Sometimes frozen pathological examinations of tumor boundary tissues suspected to contain residual cancer tissue are performed to help guide the surgeon. As such, the patient’s survival rate is greatly compromised. The development of real-time, in vivo tumor imaging systems is key to improving patient survival rate, since this would allow clinicians to see the boundaries of tumors during operations for the precise removal of cancer tissues.
The nanoparticles quantum dots (QDs) with near-infrared (NIR) emission spectra have been demonstrated to have high tissue penetration ability, and they have the properties of surface modifications to link to molecules capable of targeting cancers.Citation8–Citation18 In vivo optical imaging of NIR-QDs is particularly useful in personalized tumor treatment and diagnosis as compared with other currently available technologies due to its ability to be imaged in real-time.
QDs are semiconductor nanocrystals (diameter 1–10 nm) consisting of elements belonging to group II–IV or group III–V.Citation8–Citation10 In comparison with organic fluorescent dyes and fluorescent proteins, they show many unique optical properties,Citation9–Citation11 such as narrow and tunable emission spectra, superior photostability, high quantum yields, and the capacity to simultaneously excite multiple fluorescence dyes. Furthermore, by modifying the composition and size of QDs, it is possible to obtain QDs with a wide range of spectra from ultraviolet to NIR.Citation12,Citation13 QDs with emission wavelengths between 700–900 nm are capable of producing NIR fluorescence with strong tissue penetrating ability. With low absorbance by in vivo tissue, and with minimal interference from normal tissue autofluorescence, they are particularly suitable for bioimaging.Citation8,Citation9
Currently, most of the QDs used for in vivo imaging are targeted to the antigens or receptors that are highly expressed on cancer cell surfaces or specifically expressed in the tumor cells, where QDs that have been coupled with respective antibodies or ligands are able to bind specifically to these targets.Citation14–Citation18 For example, Shi et alCitation14 and Gao et alCitation15 coupled QDs with antibody against prostate-specific membrane antigen, generating a QD-prostate-specific membrane antigen probe to inject intravenously into nude mice bearing prostatic cancer, and they successfully obtained fluorescence images of the tumor. Tada et al prepared an NIR fluorescence probe by linking QDs to monoclonal antibody against HER2 (human epidermal growth factor receptor-2). They were able to clearly image breast cancer, where HER2 is highly expressed.Citation16 In our early study, we coupled QDs with the epidermal growth factor receptor, which is highly expressed in the BcaCD885 (human buccal squamous cell carcinoma cell line) cell line derived from human oral squamous cell carcinoma, and were able to obtain clear tumor images after injecting the probe intravenously into nude mice bearing BcaCD885 tumors.Citation18 However, since there are many different antigens or receptors that are specifically or highly expressed in different types of cancer cells, it will be necessary to prepare different QDs probes, each with specific binding ability for different types of cancer. Furthermore, for in vivo labeling, the fluorescence probes must travel through tumor capsules and vessel walls to reach the tumor cell surfaces, and this course may reduce labeling efficiency.
It has been demonstrated that tumor progression depends on angiogenesis,Citation19,Citation20 where integrin αvβ3 is highly and specifically expressed in tumor angiogenic vessel endothelial cells of almost all carcinoma, and is expressed in low amounts in quiescent endothelium and normal tissues.Citation21,Citation22 Integrin αvβ3 specifically binds to the peptide containing the arginine-glycine-aspartic acid (RGD) sequence. Therefore, theoretically, one QD-RGD probe would be able to image various types of cancer. A few studies have reported the use of the QD-RGD probe to target integrin αvβ3 for in vivo imaging. The probe has only been used to image tumor angiogenic vessels in athymic nude mice bearing subcutaneous U87MG human glioblastoma tumors.Citation23,Citation24 On the other hand, as nanoparticles, the targeting properties of QDs are influenced by many factors, such as their physical and chemical properties, properties of the linked targeting molecules, and the location and environment of tumors to be targeted.Citation25–Citation27 So far, no report is available for the use of QD- RGD to image HNSCC in vivo. In this study, we transplanted BcaCD885 cells into nude mouse cheek to establish an HNSCC model, and used QD800-RGD with emission wavelength of 800 nm administered intravenously to image HNSCC in vivo and analyze the distribution of the probe in the animals. The results would provide information to explore the potential application of integrin αvβ3-based QDs imaging for personalized HNSCC patient treatment and diagnosis.
Materials and methods
HNSCC xenograft model
Human oral squamous cell carcinoma cell line BcaCD885 was obtained from Life Science College, Chongqing Medical University. Fifteen nude mice (specific pathogen free, male, BALA/c-nu/nu), aged 6–8 weeks and weighing 20–25 gram each, were purchased from Experimental Animals Center at Chongqing Medical University. The animals were fed sterilized feed and drinking water, and were housed under constant temperature and humidity conditions. All animal protocols were approved by the Animal Use Committee at the Institute of Animal Research, Chongqing Medical University.
BcaCD885 cells at exponential stage were digested with 0.25% trypsin and pelleted by centrifugation at 800 rpm for 4 minutes at 4°C and were resuspended in sterile phosphate-buffered saline (PBS). Aliquots of the suspension (2 × 10⁶ cells/0.2 mL) were injected subcutaneously into the right cheek of 15 nude mice to establish the HNSCC model.
QD800-RGD preparation
QD800 were made of cadmium-selenium cores with zinc-sulfur and a polymer coating (Life Technologies, Carlsbad, CA, USA). QD800-RGD was prepared according to the manufacturer’s procedures described in the Qdot® antibody conjugation kits (Life Technologies). Briefly, QDs were activated by adding 125 μL of QD800 solution (4 μM) to 14 μL preheated succinimidyl-4-(N-maleimidomethyl)cyclohexane-1-carboxylate solution (10 mM) and incubated at room temperature for 1 hour. The activated QDs were loaded onto an NAP-column (Life Technologies), and approximately 500 μL of colored eluate was collected. Cyclo(arginine-glycine-aspartic-acid-D-phenylalanine-gysteine) (cRGDfC) peptide (GL Biochem, Shanghai, People’s Republic of China) was dissolved in 300 μL PBS buffer (pH 7.2–7.4) to a final concentration of 1 mg/mL, and 6.1 μL of 1M dithiothreitol solution was added to the cRGDfC peptide solution, mixed, and reduced at room temperature for 20 minutes. The solution was mixed with 20 μL of the dye indicator and loaded onto an NAP-5 column. Eluate was collected from the first drop of colored solution for a total volume of 500 μL. The two eluates (QD eluate and cRGDfC eluate) were combined, mixed, and linked for 1 hour at room temperature, and the reaction was stopped by mixing with 3 μL 2-mercaptoethanol (10 mM) and incubated at room temperature for 30 minutes. An aliquot of 0.5 mL of the deactivated solution was loaded into ultrafiltration tubes and centrifuged for 15 minutes at 7,000 rpm (Z233MK-2; Hermle, Wehingen, Germany). A 20 μL volume of conjugate was collected from each tube and purified on a desalting column (Thermo Fisher Scientific, Waltham, MA, USA) to obtain purified QD800-RGD. The concentration of the conjugate was determined according to the Qdot® antibody conjugation kit instructions. QD800-RGD was diluted with double distilled water to 0.16 μmol/mL, sonicated, and 50 μL of the solution was loaded to a mesh copper grid membrane (ZB-T1024; Beijing Zhongxingbairui Technology Co., Beijing, People’s Republic of China). Excess fluid was removed, and the conjugate was examined after 10 minutes under a transmission electron microscope (H-7500; Hitachi Ltd, Tokyo, Japan).
Integrin αvβ3 binding assay
Six mice were sacrificed by cervical dislocation 3 weeks after BcaCD885 cell injection. The tumors were isolated, frozen in optimal cutting temperature medium, cryosectioned at −20°C into 7 μm sections, fixed in cold acetone for 10 minutes, washed three time with PBS, and blocked with 1:10 goat serum for 15 minutes. The sections were used in three binding experiments as follows: experimental, control I, and control II. For the experimental group, 100 μL of QD800-RGD solution (100 nM) was added to the sections, and incubated at 4°C overnight. The sections were washed three times with PBS and incubated with a 1:200 dilution of rat anti-mouse CD105 (cluster of differentiation 105) monoclonal antibody (BioLegend, San Diego, CA, USA). After incubation for 30 minutes, the sections were washed three times with PBS, stained with a 1:100 dilution of rabbit anti-rat fluorescein isothiocyanate (FITC) as secondary antibody (CoWin Biotech, Beijing, People’s Republic of China), and incubated in the dark at room temperature for 30 minutes. After washing with PBS three times, 4′,6-diamidino-2-phenylindole (DAPI) (Beyotime, Beijing, People’s Republic of China) was added to the slides, which were then sealed with glycerol. For control group I, the sections were treated with QD800, instead of QD800-RGD; for control group II, the sections were treated with 200 µL RGD at 2 µg/mL to block integrin αvβ3 for 2 hours and then washed three times with PBS. The blocked sections were then used in binding studies in the same way as for the experimental group. The targeting efficiency of QD800-RGD to integrin αvβ3 under the three experimental conditions was evaluated under a laser scanning confocal microscope (TCS-SP5; Leica Microsystems, Wetzlar, Germany). DAPI was excited at 405 nm and bright blue fluorescence was captured through a filter at 455 nm; FITC was excited at 488 nm to capture bright green fluorescence with a 505 nm filter; QD800 was excited at 405 nm and the emission was captured at 800 nm. The invisible infrared fluorescence emitted from QD800 was pseudocolored as red. Finally the three images were overlaid using Leica TCS SP5 software to obtain visible figures.
In vivo optical imaging of tumors
Nine mice bearing HNSCC, established as described above, were checked daily for tumor development, and nine mice were found to develop tumors. At 3 weeks, the diameters of the tumors were between 0.8–1.2 cm. The animals were then separated into three groups with three mice each and anesthetized by intraperitoneal injection of 2% pentobarbital (40 mg/kg). Three imaging groups were set up. In the experimental group, mice were administered 100 μL QD800-RGD containing 150 pmol equivalent of QD800 through tail vein injections. For control group I, the mice were similarly injected with 100 μL of 150 pmol QD800. In control group II, the animals were first injected with 250 μL RGD (2 mg/mL) and then 100 μL QD800-RGD containing 150 pmol equivalent of QD800 2 hours later. Images were recorded 0.5, 1, 3, 6, 9, and 12 hours postinjection (pi) on a Maestro In Vivo Imaging System (Maestro EX IVIS; Cambridge Research Instruments, Woburn, MA, USA) with excitation and emission set at 655 nm and 800 nm, respectively. The exposure time was 50 milliseconds, at an interval of 30 seconds, binning 2 × 2, and resolution at 1,024 × 1,024 pix. The images and data were analyzed using vendor software Maestro 2.10.0 to distinguish autofluorescence from the normal tissues and fluorescence from the tumors. Fluorescence intensity and tumor-to-background ratio (the fluorescence intensity ratio between tumor and background autofluorescence) were automatically calculated by the software. For the purpose of illumination, the fluorescence signals were pseudocolored. Autofluorescence was shown as green and fluorescence of interest was set as red, and they were overlaid to generate visible images.
Ex vivo detection and imaging of tumors and organs
All mice were sacrificed by cervical dislocation immediately after imaging at 12 hours pi, and they were dissected to isolate tumor, brain, heart, liver, spleen, lung, kidney, tibia, testis, stomach, and intestine. The organs were washed with PBS, blotted dry with filter paper, and imaged with the Maestro imaging system. All organs except tibia were cut into two pieces. One of the pieces was weighed, cut into small pieces, and homogenized using glass homogenizers. Fluorescence in 100 μL homogenate samples was measured using the Maestro imaging system. The average fluorescence intensity in each organ was then calculated based on the weight of the organ and its fluorescence reading. The other pieces of the organs were frozen in optimal cutting temperature medium, cryosectioned at −20°C into 7 μm sections, viewed, and the image recorded under the laser scanning confocal microscope with excitation and emission set at 405 nm and 800 nm, respectively, for QD800 fluorescence in tumors and organs. The tumors sections were then incubated with rat anti-mouse CD105 monoclonal antibody for 30 minutes at room temperature, washed three times with PBS, and incubated again with a 1:100 dilution of secondary rabbit anti-rat FITC for 30 minutes at room temperature. Sections were then washed three times with PBS and treated for 5 minutes with DAPI to stain for nuclei. After washing three times, the slides were viewed under a laser scanning confocal microscope for distribution of QD800 in the tumor tissues, where the cell nuclei were stained blue and tumor angiogenic vessels were stained green.
Statistical analysis
Data were processed using SPSS version 13.0 software (IBM Corporation, Armonk, NY, USA) and expressed as means ± standard deviation. Difference in means between two groups was tested by t-test. For comparison between more than two groups, analysis of variance was performed. Differences were considered significant if P<0.05.
Results
QD800-RGD preparation
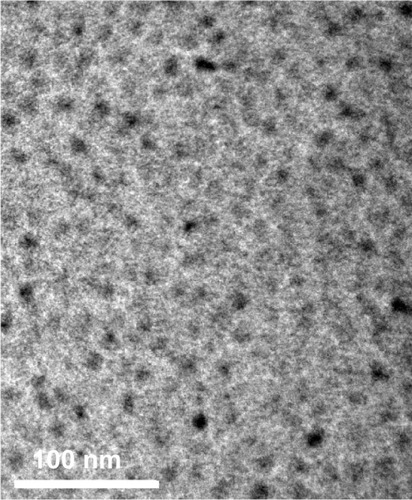
The concentration of purified QD800-RGD in the eluate was calculated to be 1.2 μM, according to the extinction coefficient at 550 nm of 1.7 × 10⁶ (mol/L)−1 cm−1 provided by the manual. Under the transmission electron microscope, QD800-RGD was well dispersed into single particles ().
Figure 1 TEM image of QD800-RGD.
Abbreviations: QD800, quantum dots with emission wavelength of 800 nm; RGD, arginine-glycine-aspartic acid; TEM, transmission electron microscopy.
In vitro binding of QD800-RGD to integrin αvβ3
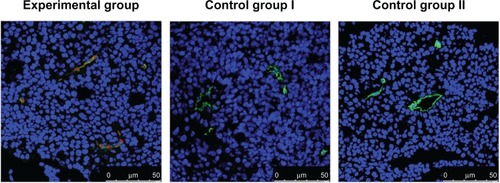
As shown in , in both experiment and control mice, nuclei and tumor angiogenic vessels in the tumor slides were clearly visualized in blue and green colors, respectively. Furthermore, in fluorescence images taken from the experimental group, QD800 fluorescence signal was clearly found within the tumor angiogenic vessels, which were counterstained green. No QD800 fluorescence signal was seen in the tissues from control groups I and II, indicating that QD800-RGD but not QD800 was able to bind to the tumor angiogenic vessel endothelial cells, while QD800-RGD was not able to bind to integrin αvβ3 blocked by RGD in the endothelial cells. The results also demonstrated that RGD was still able to recognize integrin αvβ3 with excellent specificity after being linked to QD800, enabling QD800 to bind to the surfaces of endothelial cells in the tumor angiogenic vessels.
Figure 2 Immunofluorescence images of laser scanning confocal microscopy of BcaCD885 tumor frozen sections stained with QD800-RGD.
Abbreviations: BcaCD885, human buccal squamous cell carcinoma cell line; CD105, cluster of differentiation 105; DAPI, 4′,6-diamidino-2-phenylindole; FITC, fluorescein isothiocyanate; QD800, quantum dots with emission wavelength of 800 nm; RGD, arginine-glycine-aspartic acid.
In vivo optical imaging of tumor
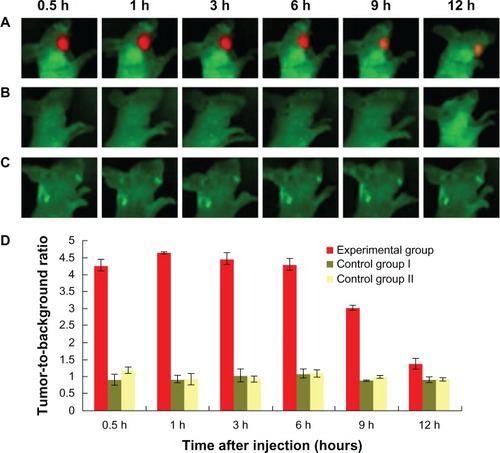
At 0.5 hour pi of QD800-RGD, clear fluorescence signals were detected in tumors in animals in the experimental group. The signals were strong from 0.5–6 hours pi (), and the areas of interest corresponded to the size of the tumors. The tumor-to-background ratio was the highest at 1 hour pi, and there was no statistical difference in the ratios between 0.5, 1, 3, and 6 hours pi (P>0.05) (). At 9 hours pi, the size of the tumor image was significantly smaller, and the tumor-to-background ratio was significantly lower than that at 1 hour pi (P<0.05). At 12 hours pi, the animals were still alive, and the tumor image was still clearly visible (). In contrast, no fluorescence signals were detected in the tumors in animals in the control groups between 0.5–12 hours pi ( and ).
Figure 3 In vivo visible images of HNSCC tumor-bearing mice at different times after injection of QD800-RGD.
Abbreviations: HNSCC, head and neck squamous cell carcinoma; QD800, quantum dots with emission wavelength of 800 nm; RGD, arginine-glycine-aspartic acid; h, hours.
Distribution of QD800-RGD in tumor and organs
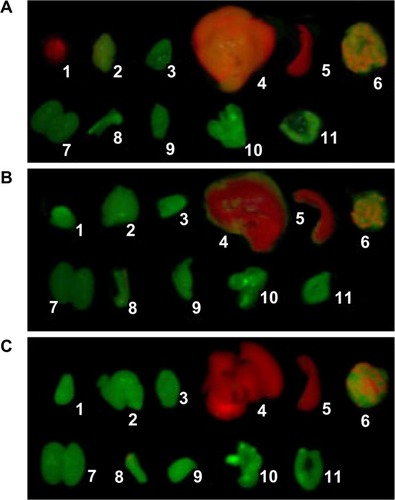
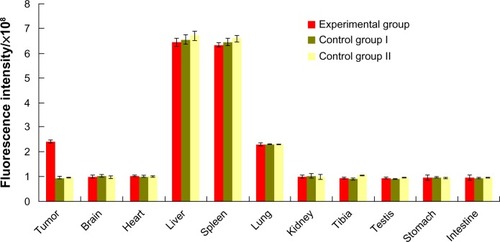
The tumors and other organs were dissected from the mice after completion of in vivo imaging at 12 hour pi, and were measured for fluorescence for each organ in vitro. The results indicated that there was clear QD800 fluorescence signal from liver, spleen, and lung in both experiment and control groups. However, the fluorescence signal was seen in tumor only in the experimental group (). No QD800 fluorescence signal was seen in brain, heart, kidney, testis, stomach, or intestine in both experimental and control groups (). In some mice bearing tumors, a weak QD800 fluorescence signal was seen in the tibia ().
Figure 4 Ex vivo NIR fluorescence images of tumor and organs 12 hours after intravenous injection of QD800-RGD or QD800.
Abbreviations: NIR, near-infrared; QD800, quantum dots with emission wavelength of 800 nm; RGD, arginine-glycine-aspartic acid.
We made semiquantitative analyses of the fluorescence intensity in the tumors and organs using tissue homogenate. The results are shown in . The highest level of fluorescence was in liver and spleen in both experiment and control groups, significantly higher than that of other organs (P<0.05). This was followed by the fluorescence in tumor in the experimental group and lung in the experimental and control groups. They were significantly higher than those in other organs, except liver and spleen (P<0.05). However, there was no significant difference in the fluorescence intensities between tumors in the experimental group and lungs in the experimental and control groups (P>0.05). The average fluorescence intensity in tumor was significantly higher in the experimental group than in the control groups (P<0.05), while no difference was seen in brain, heart, kidney, testis, stomach, or intestine between the groups (P>0.05).
Figure 5 Fluorescence intensity in homogenates of tumors and organs 12 hours after injection with equivalent doses of QD800-RGD or QD800.
Abbreviations: QD800, quantum dots with emission wavelength of 800 nm; RGD, arginine-glycine-aspartic acid.
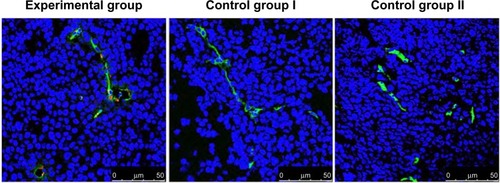
Stained nuclei (blue) and tumor angiogenic vessels (green) were clearly visualized in the frozen tumor sections under the laser confocal microscope in both experimental and control groups (). However, QD800 fluorescence signal was not found in the samples from control groups I and II but was clearly seen within tumor angiogenic vessels from the experimental group (), demonstrating the well-targeted, in vivo binding of QD800-RGD to integrin αvβ3 in tumor angiogenic vessels.
Figure 6 Immunofluorescence images of frozen tumor sections 12 hours after intravenous injection of QD800-RGD or QD800.
Abbreviations: CD105, cluster of differentiation 105; DAPI, 4′,6-diamidino-2-phenylindole; FITC, fluorescein isothiocyanate; QD800, quantum dots with emission wavelength of 800 nm; RGD, arginine-glycine-aspartic acid.
Discussion
It has been demonstrated that tumor progression depends on angiogenesis.Citation19,Citation20 In this study, we used integrin αvβ3 as target to investigate the feasibility of in vivo HNSCC imaging. Integrin αvβ3 is highly and specifically expressed in the endothelial cells of tumor angiogenic vessels.Citation19–Citation22 QD800-RGD was injected into an HNSCC nude mouse model intravenously, a mode often used in clinic practice. The results from in vivo and ex vivo imaging and histochemical studies of the tumors and major organs indicated that QD800-RGD is capable of targeting to integrin αvβ3 in vivo, and the fluorescence can be captured ex vivo to produce clear tumor fluorescence images. Our results showed that complete tumor images can be obtained 0.5 hour pi of QD800-RGD, and the size and fluorescence intensity of the images did not change from 0.5–6 hours pi and were reduced remarkably at 9 hours pi. This indicates that the optimal timing for imaging is from 0.5–6 hours pi for HNSCC, but the tumor image was still clearly visible at 12 hours pi. The reduction of the fluorescence intensity with time might be due to the enzymatic degradation of ligands on the surface of the probe, resulting in reduced binding ability and bleaching of QDs fluorescence.Citation15,Citation17,Citation23 It is worthy to note that in the present study, in vivo imaging was captured through the skin barrier. In surgical operations, tumors will be exposed under open wound, which may further increase the imaging sensitivity, thereby helping clinical doctors to remove the tumors in a more precise way and with personalized accuracy for individual patients.
The in vivo metabolism and distribution of QD800-RGD remain unclear. Our semiquantitative analysis based on in vitro organ imaging and fluorescence assays in tissue homogenates showed that at 12 hours pi, the fluorescence signals were strong in liver and spleen in both experimental and control groups. This was followed in intensity by the fluorescence in tumor in the experimental group and lung in the experimental and control groups, while no fluorescence was detected in brain, heart, kidney, testis, stomach, or intestine. This is because QD800-RGD, a type of nanoparticle, is easily phagocytosed by the mononuclear phagocytic system, leading to the accumulation of QD800-RGD in the liver and spleen, organs containing large amounts of mononuclear phagocytic cells. In this study, we did not observe any acute toxicity of the animals to QD800 or QD800-RGD, nor did we see any abnormal behavior following the injection.
QD in vivo imaging was previously reported based on QD-RGD targeting to integrin αvβ3 expressed in tumor angiogenic vessel endothelial cells only for glioblastoma xenografted in the front flank of nude mice.Citation23,Citation24 In this study, we established a HNSCC model by injecting human squamous cell carcinoma cell line BcaCD885 into the right cheek of nude mice. These animals were successfully imaged in situ to obtain visual tumor images after intravenous injection of QD800-RGD. In comparison with the in vivo glioblastoma imaging, our results yielded a similar time curve for imaging following the injection. That is, the most clear and intact tumor images, with the highest tumor-to-background ratio, were achieved within 6 hours after the QD800-RGD injection. In addition, the in vivo distribution of QD800-RGD was also similar to that observed previously. Results from both the early study and this study suggest that QD800-RGD may be applicable for in vivo imaging of different types of tumor in different parts of the body, with similar imaging-time response and in vivo QD800-RGD distribution. Therefore, the QD800-RGD probe has more potential and applicability than other previously reported QD-antibody probes.Citation14–Citation18 However, since QD-RGD is based on imaging tumor angiogenic vessels for tumor imaging, further study is needed to validate the accuracy of these images at the cellular level before being used in imaging-guided surgery.
Conclusion
This study demonstrates that QD800-RGD can specifically target and bind to integrin αvβ3 expressed in the endothelial cells of tumor angiogenic vessels in vivo, producing clear visual and in situ fluorescence images of HNSCC after the intravenous injection. The optimal time for image detection of HNSCC is 0.5–6 hours after QD800-RGD injection. This study indicates that this technique might have a broad range of applications in personalized treatment and diagnosis for HNSCC.
Acknowledgments
This study was supported by the National Natural Science Foundation of China (No 81172205).
Disclosure
The authors report no conflicts of interest in this work.
References
- VermorkenJBSpecenierPOptimal treatment for recurrent/metastatic head and neck cancerAnn Oncol201021Suppl 7vii252vii26120943624
- LeónXHittRConstenlaMA retrospective analysis of the outcome of patients with recurrent and/or metastatic squamous cell carcinoma of the head and neck refractory to a platinum-based chemotherapyClin Oncol (R Coll Radiol)200517641842416149284
- PusicALiuJCChenCMA systematic review of patient-reported outcome measures in head and neck cancer surgeryOtolaryngol Head Neck Surg2007136452553517418246
- HaddadRIShinDMRecent advances in head and neck cancerN Engl J Med2008359111143115418784104
- LiYZhangJYangKEvaluation of the efficacy of a novel radical neck dissection preserving the external jugular vein, greater auricular nerve, and deep branches of the cervical nerveOnco Targets Ther2013636136723596353
- WoolgarJATriantafyllouAA histopathological appraisal of surgical margins in oral and oropharyngeal cancer resection specimensOral Oncol200541101034104316129652
- RosenthalELKulbershBDDuncanRDIn vivo detection of head and neck cancer orthotopic xenografts by immunofluorescenceLaryngoscope200611691636164116954995
- YangKCaoYAShiCQuantum dot-based visual in vivo imaging for oral squamous cell carcinoma in miceOral Oncol2010461286486821051276
- CaoYYangKLiZZhaoCShiCYangJNear-infrared quantum-dot-based non-invasive in vivo imaging of squamous cell carcinoma U14Nanotechnology2010214747510421030774
- SunDYangKZhengGLiZCaoYStudy on effect of peptide-conjugated near-infrared fluorescent quantum dots on the clone formation, proliferation, apoptosis, and tumorigenicity ability of human buccal squamous cell carcinoma cell line BcaCD885Int J Nanomedicine2010540140520957161
- BentolilaLAEbensteinYWeissSQuantum dots for in vivo small-animal imagingJ Nucl Med200950449349619289434
- MichaletXPinaudFFBentolilaLAQuantum dots for live cells, in vivo imaging, and diagnosticsScience2005307570953854415681376
- MedintzILUyedaHTGoldmanERMattoussiHQuantum dot bioconjugates for imaging, labelling and sensingNat Mater20054643544615928695
- ShiCZhuYXieZVisualizing human prostate cancer cells in mouse skeleton using bioconjugated near-infrared fluorescent quantum dotsUrology200974244645119428067
- GaoXCuiYLevensonRMChungLWNieSIn vivo cancer targeting and imaging with semiconductor quantum dotsNat Biotechnol200422896997615258594
- TadaHHiguchiHWanatabeTMOhuchiNIn vivo real-time tracking of single quantum dots conjugated with monoclonal anti-HER2 antibody in tumors of miceCancer Res20076731138114417283148
- DiagaradjanePOrenstein-CardonaJMColón-CasasnovasNEImaging epidermal growth factor receptor expression in vivo: pharmacokinetic and biodistribution characterization of a bioconjugated quantum dot nanoprobeClin Cancer Res200814373174118245533
- YangKZhangFJTangHIn-vivo imaging of oral squamous cell carcinoma by EGFR monoclonal antibody conjugated near-infrared quantum dots in miceInt J Nanomedicine201161739174521980236
- BergersGBenjaminLETumorigenesis and the angiogenic switchNat Rev Cancer20033640141012778130
- XiongJPStehleTZhangRCrystal structure of the extracellular segment of integrin alpha Vbeta3 in complex with an Arg-Gly-Asp ligandScience2002296556515115511884718
- HoodJDChereshDARole of integrins in cell invasion and migrationNat Rev Cancer2002229110012635172
- JinHVarnerJIntegrins: roles in cancer development and as treatment targetsBr J Cancer200490356156514760364
- CaiWShinDWChenKPeptide-labeled near-infrared quantum dots for imaging tumor vasculature in living subjectsNano Lett20066466967616608262
- GaoJChenKXieRIn vivo tumor-targeted fluorescence imaging using near-infrared non-cadmium quantum dotsBioconjug Chem201021460460920369817
- ZrazhevskiyPGaoXMultifunctional quantum dots for personalized medicineNano Today20094541442820161004
- YangKZhaoCCaoYAIn vivo and in situ imaging of head and neck squamous cell carcinoma using near-infrared fluorescent quantum dot probes conjugated with epidermal growth factor receptor monoclonal antibodies in miceOncol Rep20122761925193122378320
- WallingMANovakJAShepardJRQuantum dots for live cell and in vivo imagingInt J Mol Sci200910244149119333416