
Abstract
Purpose
The tumor microenvironment (TME) plays a crucial role in the progression and prognosis of gastric cancer (GC). This study investigated TME-associated genes and explored their roles in the GC microenvironment.
Methods
A total of 330 GC samples were extracted from TCGA. ESTIMATE and CIBERSORT algorithms were utilized to evaluate the stromal and immune scores of GC samples and the fraction of 22 immune cells infiltrated in the TME. Then, the TME-related differentially expressed genes (DEGs) were determined through integrative analysis. Protein-protein interaction (PPI) network and Cox regression analysis were conducted to analyze DEGs, and CSF1R was determined as the most crucial gene. We further probed the role of CSF1R in the GC microenvironment and evaluated the prognostic value of CSF1R.
Results
We identified 560 TME-related DEGs and found CSF1R associated with the development and prognosis of GC. Further analysis showed that CSF1R was involved in immune-related signaling pathways. Furthermore, CIBERSORT analysis revealed that CSF1R expression correlated with several kinds of infiltrating immune cells, including tumor-associated macrophages (TAMs), B cells, NK cells, neutrophils, eosinophils, T cells, dendritic cells, and so on.
Conclusion
In summary, CSF1R might take part in the modulation of immune-active status in the GC microenvironment and could be a promising biomarker for GC therapy and prognosis.
Introduction
Gastric cancer (GC) is the fifth most commonly diagnosed cancer and the third leading cause of cancer mortality worldwide.Citation1 As patients at the early stage of GC are usually asymptomatic, most of them are diagnosed with advanced stages.Citation2,Citation3 Although progress has been made in treatments, including surgery, chemotherapy, molecular targeted therapy, and radiotherapy, the prognosis of advanced GC patients remains pessimistic.Citation3 Therefore, it is urgently needed to improve GC diagnosis, treatment, and prognosis.
The tumor microenvironment (TME) has recently attracted more and more attention from the cancer research community. A growing body of evidence has elucidated that the TME could influence gene expression of tumor tissues and is gradually recognized as a critical determinant in tumor development and therapeutic responses.Citation4–Citation6 The TME refers to the environment where tumor cells originate and develop. In addition to tumor cells, the TME also consists of stromal cells, the tumor vascular system, immune cells, the extracellular matrix (ECM), as well as the acidic and hypoxic environment of the tumor.Citation7–Citation9 Stromal cells and immune cells, as two major nontumor cell types in the TME, are considered to be of great value in tumor diagnosis and prognosis.Citation10–Citation13 Thus, an overall understanding of the TME may provide crucial vision into GC initiation and progression, and contribute to the development of promising diagnostic and prognostic biomarkers.
With the advent of the biological big data era, bioinformatics technique provides a more convenient platform for researchers to guide basic experiments.Citation14 ESTIMATE was developed to evaluate stromal and immune scores for reflecting the level of stromal and immune cells infiltrated in the TME according to the transcriptional profiles of tumor tissues.Citation15 This algorithm has been applied to colon cancer and glioblastoma, demonstrating the effectiveness of the big-data based algorithm.Citation16–Citation18 Besides, CIBERSORT algorithm was performed to evaluate the fraction of 22 infiltrating immune cells in the TME using the LM22 signature.Citation19 CIBERSORT algorithm also has been validated and applied to analyze the association between immune cell landscapes and treatment outcome in lung and breast cancer.Citation20,Citation21 In this study, the ESTIMATE and CIBERSORT algorithms were utilized to calculate the stromal and immune scores of GC cases and the proportion of 22 immune cells infiltrated in TME based on The Cancer Genome Atlas (TCGA) database. Furthermore, we explored the TME-related differentially expressed genes (DEGs) and found CSF1R correlated with the prognosis of GC and immune cells infiltrated in TME. We hypothesized that CSF1R might play an essential role in the GC microenvironment and could be a promising therapeutic target and prognostic biomarker.
Materials and Methods
Data Preparation
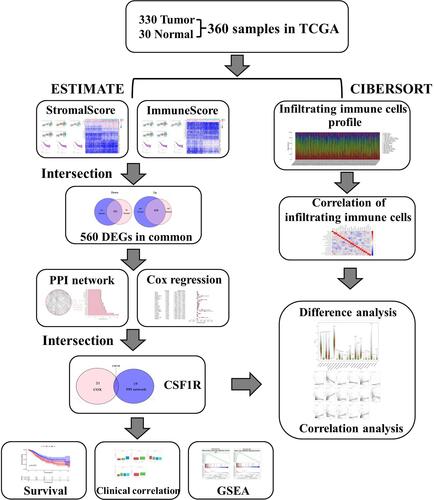
A flowchart of the study is shown in . Gene expression data of GC samples were downloaded from the TCGA database. The corresponding patients’ clinical information, including survival time, survival status, grade, and tumor stage, were also obtained from the TCGA database. Then, the ESTIMATE algorithm was applied to calculate the stromal, immune, and ESTIMATE scores for GC samples. The acquirement and application of all data involved in this study were performed following TCGA publication guidelines and data access policies.
Figure 1 Flowchart of this study.
Clinicopathological Characteristics Analysis and Survival Analysis
Based on the stromal, immune, and ESTIMATE scores, GC patients were classified into two groups: high-score group and low-score group. We evaluated the association between clinicopathological characteristics and the stromal/immune/ESTIMATE scores.Citation22 Furthermore, the Kaplan-Meier method was utilized to assess the association between the survival rate and the above scores. A Log rank test tested the association. The analyses were carried out through the R packages “survival” and “survminer”, and p < 0.05 was regarded as statistical significance.
DEGs Identification
Gene expression profiles were screened using the R package “limma”, and DEGs between the low-score and high-score groups were identified. The criteria for determining DEGs were an absolute value of log2fold change (|log2FC|) >1 and false discovery rate (FDR) <0.05. Heatmaps of DEGs were drawn by the package “pheatmap” in R, and the overlapping DEGs were determined by the package “Venn diagrams” in R.
Enrichment Analysis
Enrichment analysis of Gene Ontology (GO) terms and the Kyoto Encyclopedia of Genes and Genomes (KEGG) pathway for DEGs were performed by R language loaded with packages “ggplot2”, “enrichplot”, and “clusterProfiler”. The GO analysis showed the feature of DEGs in the biological process, cellular component, and molecular function and the KEGG analysis revealed the enrichment of DEGs in the signaling pathways. P and q <0.05 were considered statistically significant.
PPI Network and Cox Regression Analysis
The PPI network of DEGs was constructed based on the STRING database. Nodes with the confidence of interactive relationship > 0.7 were regarded as the threshold. Subsequently, CytoHubba, which is a plug-in of Cytoscape software, was utilized to identify the top 20 hub genes. Cox regression analysis was utilized to determine prognostic DEGs. DEGs with p < 0.05 for survival comparison were considered as prognostic DEGs. Venn diagrams were used to visualize the common gene CSF1R between prognostic DEGs in univariate Cox regression and the top 20 hub genes in the PPI network.
Gene Set Enrichment Analysis (GSEA) and CIBERSORT Algorithm
GC patients were classified into low-expression and high-expression groups based on CSF1R expression. To explore the role of CSF1R in regulating the GC microenvironment, Gene set enrichment analysis for the KEGG pathway was performed using GSEA version 3.0 downloaded from Broad Institute. KEGG gene sets for enrichment analysis were obtained from the Molecular Signatures Database. NOM p < 0.05 and FDR < 0.25 were regarded as the threshold.
Then, CIBERSORT algorithm was applied to assess the proportion of immune cells infiltrated in the TME using the LM22 signature. LM22 signature consisting of 547 genes was used to identify 22 types of infiltrating immune cells. Furthermore, we performed the difference and correlation analyses to explore the correlation between CSF1R expression and the immune cells infiltrated in the TME (P < 0.05).
Statistical Analysis
Statistical analyses were performed via R software (version 4.0.2) and Perl (version 5.30.1) in this study. All statistical methods and appropriate R packages were described throughout the study. P < 0.05 was set as the cutoff criterion.
Results
The Correlation of Stromal, Immune, and ESTIMATE Scores with Survival and Clinicopathological Characteristics
We downloaded gene expression information and clinical data of 330 GC cases from TCGA. All the patients diagnosed as adenomas or adenocarcinomas were included in our study. The clinicopathological characteristics of GC patients are listed in . Subsequently, we calculated the stromal, immune, and ESTIMATE scores of GC samples by the ESTIMATE algorithm. The stromal and immune scores ranged from −726.16 to 941.62 and −287.49 to 1418.40, respectively. The ESTIMATE scores, which are the combination of immune and stromal scores, were distributed between −788.22 to 2118.38.
Table 1 Clinicopathological Characteristics of GC Patients from TCGA Database
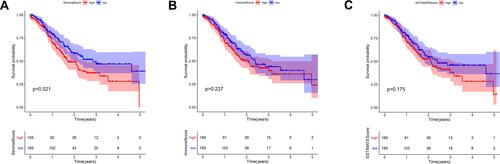
We compared the stromal/immune/ESTIMATE scores among the GC patients under grade, TNM classification, and stage. A significant correlation was observed between the above scores and grade, stage, and T classification. However, all scores were not associated with N classification and M classification (). Furthermore, to evaluate the correlation between the stromal/immune/ESTIMATE scores and survival of GC patients, we divided them into the low-score and high-score groups and compared the overall survival rate in the two groups. Intriguingly, the survival curves revealed that the stromal high-score group had a lower survival rate than the low-score group. Patients with high immune/ESTIMATE scores had a lower survival rate than those with low scores, although no statistical differences were found ().
Figure 2 The correlation of stromal, immune, and ESTIMATE scores with clinicopathological characteristics (A–E).
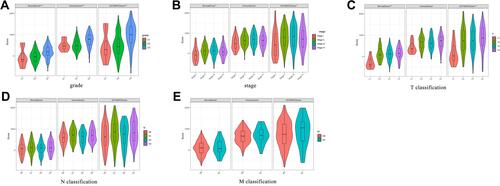
Figure 3 The correlation of stromal, immune, and ESTIMATE scores with the survival of GC patients (A–C).
DEGs Identification and Enrichment Analysis
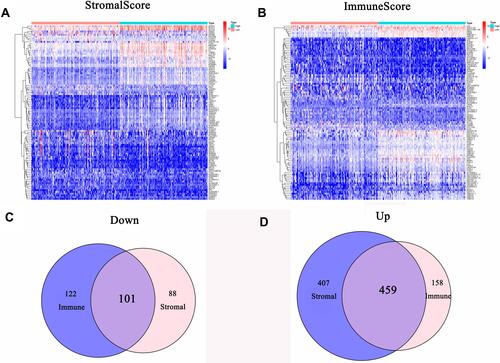
We performed the differential analysis to determine TME-related DEGs. Heatmaps showed the differential gene expression profiles according to the stromal and immune scores ( and ). A total of 1055 DEGs were identified between the stromal low-score and high-score groups. Among them, 866 genes were significantly upregulated, while the other 189 genes were downregulated (|log2FC| >1 and FDR <0.05). Simultaneously, 840 DEGs were obtained from the immune score groups, including 617 upregulated genes and 223 downregulated genes (|log2FC| >1 and FDR <0.05). Finally, 560 DEGs in both the stromal and immune score groups were identified as TME-related DEGs ( and ).
Figure 4 Gene expression profiles of GC patients with different stromal and immune scores. (A) Heatmap of DEGs between the stromal high-score and low-score groups. (B) Heatmap of DEGs between the immune high-score and low-score groups. (C) Venn diagram of commonly downregulated DEGs in the stromal and immune score groups. (D) Venn diagram of commonly upregulated DEGs in the stromal and immune score groups.
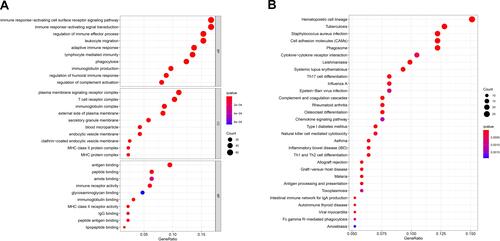
Furthermore, we performed functional enrichment analysis on 560 TME-related DEGs to identify their primary functions. GO enrichment analysis showed that DEGs were significantly enriched in the immune-related terms, including regulation of immune effector process, immune response−activating signal transduction, and immune response-activating cell surface receptor signaling pathway (). The KEGG enrichment analysis also indicated that most of the DEG-related pathways were correlated with immune response ().
Figure 5 Functional enrichment analysis of 560 DEGs. (A) GO enrichment analysis of DEGs. (B) KEGG enrichment analysis of DEGs.
PPI Network and Cox Regression Analysis
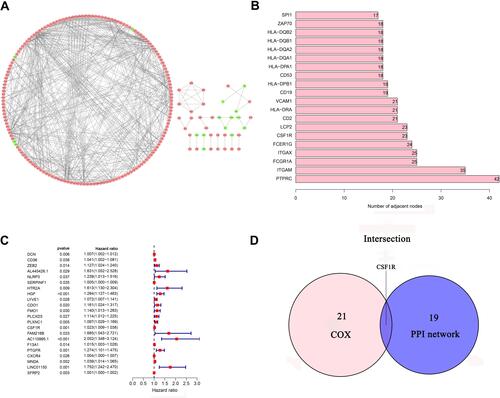
The PPI network was constructed through the STRING database to analyze the interaction of DEGs (). Using the CytoHubba plug-in, we identified the top 20 hub genes by calculating each node’s connection degree in the network (). Univariate Cox regression analysis for GC patients’ survival was conducted to identify 22 prognostic DEGs (). Furthermore, the intersection analysis between the top 20 hub genes in the PPI network and 22 prognostic DEGs was carried out, and CSF1R was found to be the most critical gene ().
Figure 6 PPI network and univariate Cox regression analysis. (A) PPI network of 560 DEGs. (B) The top 20 genes ordered by the number of nodes in PPI network. (C) Forest plot of univariate Cox regression analysis(D) Venn diagram showing the common DEGs shared by the top 20 genes in PPI network and prognostic genes in Cox.
The Correlation of the Survival and Clinicopathological Characteristics with CSF1R Expression
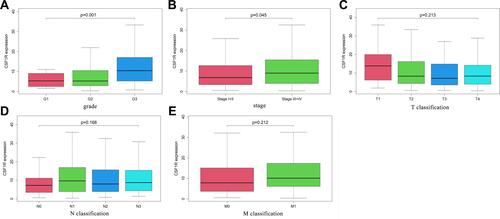
To evaluate the role of CSF1R in the GC patients’ survival, we classified all samples into low-expression and high-expression groups based on CSF1R expression. The Kaplan-Meier survival curve revealed that GC patients with CSF1R low expression had a better overall survival rate than those with CSF1R high expression (). Furthermore, we evaluated the relationship between the expression of CSF1R and clinicopathological parameters. The result revealed that CSF1R expression was associated with grade and stage ( and ). However, there were no significant differences in CSF1R expression among the GC patients with T classification, N classification and M classification ( and ).
Figure 7 The correlation of CSF1R expression with the survival of GC patients.
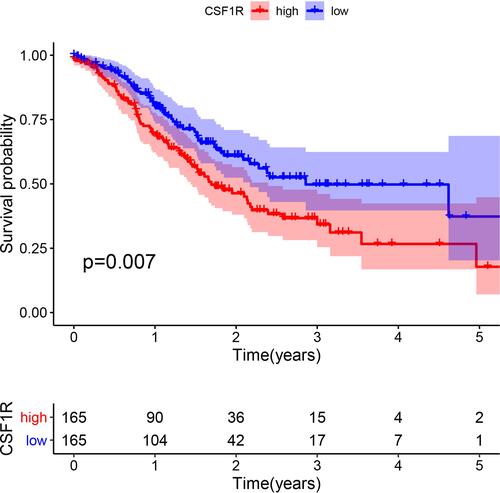
Figure 8 The correlation of CSF1R expression with clinicopathological characteristics of GC patients (A-E).
GSEA
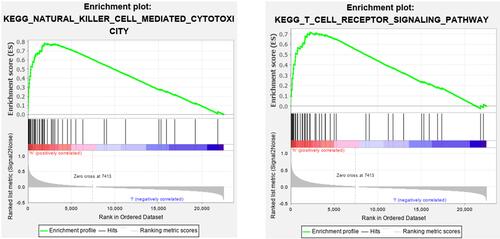
To explore the role of CSF1R in regulating the GC microenvironment, GSEA was performed based on the expression of CSF1R. We found that CSF1R was involved in immune-related signaling pathways, including T cell receptor signaling pathway and natural killer cell mediated cytotoxicity (). The results implied that CSF1R might take part in the modulation of immune-active status in the GC microenvironment.
Figure 9 Gene set enrichment analysis of CSF1R.
The Correlation of the Fraction of Infiltrating Immune Cells with CSF1R Expression
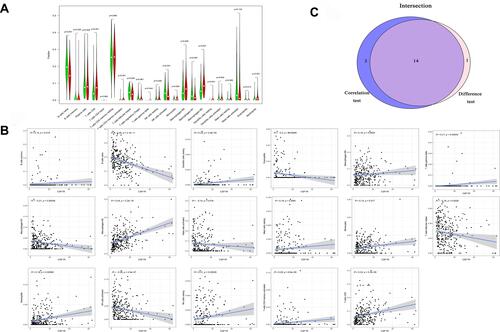
The fraction of immune cells infiltrated in the TME was analyzed through the CIBERSORT algorithm (). Then, the difference and correlation analyses were performed to explore the correlation between the immune cells infiltrated in the TME and CSF1R expression. The results indicated that a total of 14 kinds of infiltrating immune cells were related to the expression of CSF1R ().
Figure 10 Infiltrating immune cells profile in gastric cancer samples and correlation analysis. (A) The proportion of 22 kinds of infiltrating immune cells. (B) The correlation between 22 kinds of infiltrating immune cells.
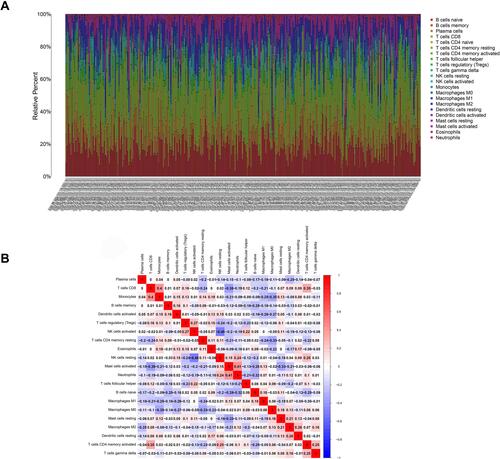
Figure 11 The association between the proportion of infiltrating immune cells and the expression of CSF1R. (A) Violin plot showed the ratio differentiation of infiltrating immune cells with the expression of CSF1R. (B) Scatter plot showed the correlation of infiltrating immune cells proportion with CSF1R expression. (C) Venn plot displayed 14 kinds of infiltrating immune cells associated with CSF1R expression by difference and correlation analysis.
Discussion
During the past decades, advances in high-throughput sequencing techniques and bioinformatics have improved our understanding of transcriptional alterations in GC. More and more biomarkers have been identified to be correlated with the diagnosis and prognosis of GC. However, the crucial regulators in the GC microenvironment and the change of the TME in GC progression have not been elucidated. In this study, the stromal, immune, and ESTIMATE scores were significantly related to the clinicopathological parameters of GC, such as grade, stage, and T classification. The results revealed that stromal and immune cells infiltrated in the TME might play a crucial role in GC progression. To explore the underlying mechanisms of TME change, we identified TME-related DEGs and performed enrichment analysis, construction of the PPI network, and COX regression analysis. GO and KEGG enrichment analysis indicated that most DEGs were remarkably involved in immune responses. Importantly, CSF1R was also found to be related to the clinicopathological characteristics (stage and grade) and the survival of GC patients. The results implied that CSF1R might play an essential role in modulating the TME and could be a promising therapeutic target and prognostic marker of GC.
CSF1R is a member of the type III protein tyrosine kinase receptor family and plays a central role in many diseases, such as chronic inflammatory diseases, bone disorders, and tumors.Citation23 CSF1R can be activated either in a paracrine manner or in an autocrine manner, then enhancing the progression and metastasis of tumors.Citation24,Citation25 For example, the expression of CSF1R and CSF1 in neoplastic epithelial cells was predictive for ipsilateral recurrence and significantly correlated with the survival of breast cancer patients.Citation26,Citation27 In addition, CSF1R was found to be upregulated in clear cell renal cell carcinoma, and its expression was positively associated with TNM stage, metastasis, and poor survival.Citation28 The elevated expression of CSF1R also was reported in Hodgkin/Reed–Sternberg (HRS) cell lines, and CSF1R signaling was demonstrated to be necessary for the growth of HRS cells.Citation29 Recently, the upregulated expression of CSF1R or CSF1 was greatly correlated with the progression and prognosis of patients with GC. Moreover, high coexpression of CSF1R and CSF1 was also an independent prognostic factor for overall survival.Citation30 Our results also showed that CSF1R was significantly related to the development and survival of GC patients. These findings further implied that CSF1R might be a potential biomarker for GC diagnosis and prognosis.
Furthermore, we further explored the potential role of CSF1R in regulating the TME. GSEA showed that CSF1R participated in immune-related pathways. The results implied that CSF1R might take part in the regulation of immune-active status in the GC microenvironment. Then, using the CIBERSORT algorithm, we estimated the proportion of immune cells infiltrated in the TME. The difference and correlation analyses were performed to explore the correlation between the expression of CSF1R and the immune cells infiltrated in the TME. The results revealed that the expression of CSF1R correlated with several kinds of infiltrating immune cells, including tumor-associated macrophages (TAMs), NK cells, B cells, Neutrophils, Eosinophils, T cells, Dendritic cells, and so on. Recently, several studies have indicated that inhibition of CSF1R can modulate both the number and the function of TAMs in different types of cancer.Citation31–Citation35 For example, Mitchem et al revealed that targeting TAMs by inhibiting CSF1R decreased the numbers of infiltrating immune cells, relieved immunosuppression, and improved chemotherapeutic efficacy of pancreatic ductal adenocarcinoma.Citation31 Pyonteck et al showed that an inhibitor of CSF1R was utilized to target TAMs in a mouse model of proneural glioblastoma multiforme, which significantly regressed established tumors and increased survival.Citation33 Furthermore, a recent study revealed that CSF1R inhibition decreased the abundance of TAMs within cervical tumors and the associated stroma and delayed the growth of established neoplasms.Citation35 In addition to TAMs, CSF1R can also be detected on other cells within the TME, including neutrophils, dendritic cells, and myeloid-derived suppressor cells.Citation36–Citation38 All data suggested that CSF1R might be a promising crucial regulator for the microenvironment of GC and participate in regulating immune-active status in TME. However, further studies are needed to identify the exact immune cell atlas in the GC patients’ microenvironment with different CSF1R expression levels.
Conclusion
In summary, we applied the ESTIMATE algorithm to estimate the stromal, immune, and ESTIMATE scores. Then, we concluded that stromal and immune cells infiltrated in the TME might play a crucial role in GC progression. We further explored the TME-related DEGs and found CSF1R associated with GC development and survival. More interestingly, CSF1R might participate in regulating immune-active status in TME and could be a promising biomarker for GC therapy and prognosis. However, more experiments are needed to clarify the potential mechanisms of CSF1R in the microenvironment of GC patients.
Author Contributions
All authors made substantial contributions to conception and design, acquisition of data, or analysis and interpretation of data; took part in drafting the article or revising it critically for important intellectual content; agreed to submit to the current journal; gave final approval of the version to be published; and agree to be accountable for all aspects of the work.
Acknowledgments
This study was supported by the National Key Research and Development Program of China (2018YFC2002000). We thank all those participants in this study.
Disclosure
The authors report no conflicts of interest in this work.
References
- Bray F, Ferlay J, Soerjomataram I, Siegel RL, Torre LA, Jemal A. Global cancer statistics 2018: GLOBOCAN estimates of incidence and mortality worldwide for 36 cancers in 185 countries. CA Cancer J Clin. 2018;68(6):394–424. doi:10.3322/caac.21492
- Rugge M, Genta RM, Di Mario F, et al. Gastric cancer as preventable disease. Clin Gastroenterol H. 2017;15(12):1833–1843. doi:10.1016/j.cgh.2017.05.023
- Smyth EC, Nilsson M, Grabsch HI, van Grieken NCT, Lordick F. Gastric cancer. Lancet. 2020;396(10251):635–648. doi:10.1016/S0140-6736(20)31288-5
- Zeng D, Li M, Zhou R, et al. Tumor microenvironment characterization in gastric cancer identifies prognostic and immunotherapeutically relevant gene signatures. Cancer Immunol Res. 2019;7(5):737–750. doi:10.1158/2326-6066.CIR-18-0436
- Binnewies M, Roberts EW, Kersten K, et al. Understanding the tumor immune microenvironment (TIME) for effective therapy. Nat Med. 2018;24(5):541–550. doi:10.1038/s41591-018-0014-x
- Pasini FS, Zilberstein B, Snitcovsky I, et al. A gene expression profile related to immune dampening in the tumor microenvironment is associated with poor prognosis in gastric adenocarcinoma. J Gastroenterol. 2014;49(11):1453–1466. doi:10.1007/s00535-013-0904-0
- Singh SR, Rameshwar P, Siegel P. Targeting tumor microenvironment in cancer therapy. Cancer Lett. 2016;380(1):203–204. doi:10.1016/j.canlet.2016.04.009
- Valkenburg KC, de Groot AE, Pienta KJ. Targeting the tumour stroma to improve cancer therapy. Nat Rev Clin Oncol. 2018;15(6):366–381.
- Chen Q, Liu G, Liu S, et al. Remodeling the tumor microenvironment with emerging nanotherapeutics. Trends Pharmacol Sci. 2018;39(1):59–74. doi:10.1016/j.tips.2017.10.009
- Jiang Y, Zhang Q, Hu Y, et al. ImmunoScore signature: a prognostic and predictive tool in gastric cancer. Ann Surg. 2018;267(3):504–513. doi:10.1097/SLA.0000000000002116
- Thompson ED, Zahurak M, Murphy A, et al. Patterns of PD-L1 expression and CD8 T cell infiltration in gastric adenocarcinomas and associated immune stroma. Gut. 2017;66(5):794–801. doi:10.1136/gutjnl-2015-310839
- Zeng D, Zhou R, Yu Y, et al. Gene expression profiles for a prognostic immunoscore in gastric cancer. Br J Surg. 2018;105(10):1338–1348. doi:10.1002/bjs.10871
- Chen F, Zhuang X, Lin L, et al. New horizons in tumor microenvironment biology: challenges and opportunities. BMC Med. 2015;13:45. doi:10.1186/s12916-015-0278-7
- He KY, Ge D, He MM. Big data analytics for genomic medicine. Int J Mol Sci. 2017;18(2):412. doi:10.3390/ijms18020412
- Yoshihara K, Shahmoradgoli M, Martinez E, et al. Inferring tumour purity and stromal and immune cell admixture from expression data. Nat Commun. 2013;4:2612. doi:10.1038/ncomms3612
- Jia D, Li S, Li D, Xue H, Yang D, Liu Y. Mining TCGA database for genes of prognostic value in glioblastoma microenvironment. Aging. 2018;10(4):592–605. doi:10.18632/aging.101415
- Xu WH, Xu Y, Wang J, et al. Prognostic value and immune infiltration of novel signatures in clear cell renal cell carcinoma microenvironment. Aging. 2019;11(17):6999–7020. doi:10.18632/aging.102233
- Alonso MH, Ausso S, Lopez-Doriga A, et al. Comprehensive analysis of copy number aberrations in microsatellite stable colon cancer in view of stromal component. Br J Cancer. 2017;117(3):421–431. doi:10.1038/bjc.2017.208
- Newman AM, Liu CL, Green MR, et al. Robust enumeration of cell subsets from tissue expression profiles. Nat Methods. 2015;12(5):453–457. doi:10.1038/nmeth.3337
- Bense RD, Sotiriou C, Piccart-Gebhart MJ, et al. Relevance of tumor-infiltrating immune cell composition and functionality for disease outcome in breast cancer. J Natl Cancer Inst. 2017;109(1):djw192. doi:10.1093/jnci/djw192
- Chen B, Khodadoust MS, Liu CL, Newman AM, Alizadeh AA. Profiling tumor infiltrating immune cells with CIBERSORT. Methods Mol Biol. 2018;1711:243–259.
- Washington K. 7th edition of the AJCC cancer staging manual: stomach. Ann Surg Oncol. 2010;17(12):3077–3079. doi:10.1245/s10434-010-1362-z
- El-Gamal MI, Al-Ameen SK, Al-Koumi DM, Hamad MG, Jalal NA, Oh CH. Recent advances of colony-stimulating factor-1 receptor (CSF-1R) kinase and its inhibitors. J Med Chem. 2018;61(13):5450–5466. doi:10.1021/acs.jmedchem.7b00873
- Stanley ER, Chitu V. CSF-1 receptor signaling in myeloid cells. Cold Spring Harb Perspect Biol. 2014;6(6):a021857. doi:10.1101/cshperspect.a021857
- Achkova D, Maher J. Role of the colony-stimulating factor (CSF)/CSF-1 receptor axis in cancer. Biochem Soc Trans. 2016;44(2):333–341. doi:10.1042/BST20150245
- Kluger HM, Dolled-Filhart M, Rodov S, Kacinski BM, Camp RL, Rimm DL. Macrophage colony-stimulating factor-1 receptor expression is associated with poor outcome in breast cancer by large cohort tissue microarray analysis. Clin Cancer Res. 2004;10(1 Pt 1):173–177. doi:10.1158/1078-0432.CCR-0699-3
- Maher MG, Sapi E, Turner B, et al. Prognostic significance of colony-stimulating factor receptor expression in ipsilateral breast cancer recurrence. Clin Cancer Res. 1998;4(8):1851–1856.
- Yang L, Liu Y, An H, et al. High expression of colony-stimulating factor 1 receptor associates with unfavorable cancer-specific survival of patients with clear cell renal cell carcinoma. Ann Surg Oncol. 2016;23(3):1044–1052. doi:10.1245/s10434-015-4911-7
- Lamprecht B, Walter K, Kreher S, et al. Derepression of an endogenous long terminal repeat activates the CSF1R proto-oncogene in human lymphoma. Nat Med. 2010;16(5):571–579, 571p following 579. doi:10.1038/nm.2129
- Okugawa Y, Toiyama Y, Ichikawa T, et al. Colony-stimulating factor-1 and colony-stimulating factor-1 receptor co-expression is associated with disease progression in gastric cancer. Int J Oncol. 2018;53(2):737–749. doi:10.3892/ijo.2018.4406
- Mitchem JB, Brennan DJ, Knolhoff BL, et al. Targeting tumor-infiltrating macrophages decreases tumor-initiating cells, relieves immunosuppression, and improves chemotherapeutic responses. Cancer Res. 2013;73(3):1128–1141. doi:10.1158/0008-5472.CAN-12-2731
- Mok S, Koya RC, Tsui C, et al. Inhibition of CSF-1 receptor improves the antitumor efficacy of adoptive cell transfer immunotherapy. Cancer Res. 2014;74(1):153–161. doi:10.1158/0008-5472.CAN-13-1816
- Pyonteck SM, Akkari L, Schuhmacher AJ, et al. CSF-1R inhibition alters macrophage polarization and blocks glioma progression. Nat Med. 2013;19(10):1264–1272. doi:10.1038/nm.3337
- Priceman SJ, Sung JL, Shaposhnik Z, et al. Targeting distinct tumor-infiltrating myeloid cells by inhibiting CSF-1 receptor: combating tumor evasion of antiangiogenic therapy. Blood. 2010;115(7):1461–1471. doi:10.1182/blood-2009-08-237412
- Strachan DC, Ruffell B, Oei Y, et al. CSF1R inhibition delays cervical and mammary tumor growth in murine models by attenuating the turnover of tumor-associated macrophages and enhancing infiltration by CD8(+) T cells. Oncoimmunology. 2013;2(12):e26968. doi:10.4161/onci.26968
- Cannarile MA, Weisser M, Jacob W, Jegg AM, Ries CH, Ruttinger D. Colony-stimulating factor 1 receptor (CSF1R) inhibitors in cancer therapy. J Immunother Cancer. 2017;5(1):53. doi:10.1186/s40425-017-0257-y
- Pedersen MB, Danielsen AV, Hamilton-Dutoit SJ, et al. High intratumoral macrophage content is an adverse prognostic feature in anaplastic large cell lymphoma. Histopathology. 2014;65(4):490–500. doi:10.1111/his.12407
- DeNardo DG, Brennan DJ, Rexhepaj E, et al. Leukocyte complexity predicts breast cancer survival and functionally regulates response to chemotherapy. Cancer Discov. 2011;1(1):54–67. doi:10.1158/2159-8274.CD-10-0028