
ABSTRACT
Background. An elevated risk of radiation-induced secondary cancer (SC) has been observed in prostate cancer patients after radiotherapy (RT), rising to as high as one in 70 patients with more than 10 years follow-up. In this study we have estimated SC risks following RT with both previous and contemporary techniques, including proton therapy, using risk models based on different dose-response relationships.
Material and methods. RT plans treating the prostate and seminal vesicles with either conformal radiotherapy (CRT), volumetric modulated arc therapy (VMAT) or intensity-modulated proton therapy (IMPT) were created for 10 patients. The risks of radiation-induced cancer were estimated for the bladder and rectum using dose-response models reflecting varying degrees of cell sterilisation: a linear model, a linear-plateau model and a bell-shaped model also accounting for fractionated RT.
Results. The choice of risk models was found to rank the plans quite differently, with the CRT plans having the lowest SC risk using the bell-shaped model, while resulting in the highest risk applying the linear model. Considering all dose-response scenarios, median relative risks of VMAT versus IMPT were 1.1–1.7 for the bladder and 0.9–1.8 for the rectum. Risks of radiation-induced bladder and rectal cancers were lower from VMAT if exposed at 80 years versus IMPT if exposed at 50 years.
Conclusions. The SC risk estimations for the bladder and rectum revealed no clear relative relationship between the contemporary techniques and CRT, with divergent results depending on choice of model. However, the SC risks for these organs when using IMPT were lower or comparable to VMAT. SC risks could be assessed when considering referral of prostate cancer patients to proton therapy, taking also general patient characteristics, such as age, into account.
A risk of developing a radiation-induced cancer follows radiation-exposed individuals and continues to increase throughout their lifetime [Citation1]. Secondary cancer (SC) risks rising to as high as one in 70 patients have been observed with more than 10 years follow-up after treatment for prostate cancer with older radiotherapy (RT) techniques [Citation2], such as conformal radiotherapy (CRT). The majority (about 2/3) of the SCs after RT of prostate cancer are located in directly irradiated tissues [Citation3] including the bladder and rectum [Citation4–6].
Volumetric modulated arc therapy (VMAT) has recently been introduced for prostate cancer, leading to reduced doses for organs at risk (OAR) [Citation7] compared to CRT. Prostate cancer patients are also referred to proton therapy, with further normal tissue sparing potential while maintaining planning target volume (PTV) coverage [Citation8]. Whereas VMAT achieves the reductions in high-dose volumes at the expense of increased volumes receiving lower doses, proton therapy has a considerable potential to reduce also the integral doses with similar or improved high-dose conformity [Citation9]. Nevertheless, long-term results in larger patient cohorts are required to determine whether the benefits of the physical properties of protons translate into clinically meaningful improvement in outcomes compared to advanced photon-based techniques [Citation10].
In this rapidly progressing technology development, follow-up data from long latency complications are usually not available until current RT techniques become outdated. Randomised clinical trials are thus not always the best suited method for validating new techniques, and the model-based approach was introduced in the Netherlands for both patient selection and validation of proton therapy [Citation11]. In this context accurate risk modelling is an essential component.
The dose-response relationships of radiation- induced SCs are uncertain, particularly in the dose-ranges relevant for RT [Citation12]. Different scenarios should therefore be considered and models accounting for varying degrees of cell-kill and repopulation have been developed and applied to estimate risks from contemporary techniques [Citation13]. At low doses, typically received by tissues located outside the primary field, the functional relationship is presumed to follow a linear-no-threshold (LNT) response as commonly extrapolated from atomic bomb survivor data [Citation1,Citation14]. At higher doses more relevant for in-field organs the risk may presume a plateau [Citation12,Citation15] or an exponential decrease [Citation16,Citation17]. There is also substantial data suggesting no downturn in risk for RT [Citation18,Citation19]. In a recent review of dose-response relationships for second solid cancer risk following high-dose fractionated RT, Berrington de Gonzalez and colleagues suggested a lower increase in risk per unit dose compared to the incidence based on atomic bomb data [Citation20]. The different dose-response relationships incorporated in risk modelling must be applied with an understanding of their limitations and sensitivities in order to attain meaningful results from the various RT scenarios.
Previously published studies comparing SC risk following proton therapy of prostate cancer versus other modalities mostly cover passively scattered proton therapy [Citation13,Citation21–24]. The studies including spot scanning, or intensity-modulated proton therapy (IMPT), are compared to three-dimensional (3D)-CRT and do not specifically address the bladder and rectum [Citation25,Citation26]. In this study we therefore estimated SC risks following RT with both previously used (CRT) as well as contemporary techniques, including VMAT and proton therapy, applying risk models based on different dose-response relationships. We further investigated sensitivities of the risk models and how these uncertainties should be interpreted and included in the context of selecting the appropriate RT technique.
Materials and methods
Treatment plans for 10 prostate cancer patients were generated in the Eclipse treatment planning system (TPS) (Varian Medical Systems, Palo Alto, CA, USA). For all treatment modalities, the same primary clinical target volumes (CTV) were used and included the prostate gland and the seminal vesicles. For VMAT and IMPT an additional CTV was generated comprising the prostate only and was used in simultaneously integrated boost plans. The rectum included volumes from the recto-sigmoid flexure to the anal verge and the bladder was contoured from apex to dome. When adding margins from the CTV to the PTV, we assumed patient positioning by bone matching for the CRT technique whereas image-guidance with fiducial markers was presumed for VMAT and IMPT. Differences in fractionation scheme are for illustrative purposes presented in corresponding 2 Gy fractions using parameters from Vogelius et al. [Citation27].
The CRT plans delivered 70 Gy in 35 fractions to the prostate and seminal vesicles. PTV margins of 15 mm were added to the CTV with the exception of 10 mm posteriorly for sparing of the rectum, in accordance with standard margins applied in our clinic 15 years back in time. The field configuration included anterior, posterior and two lateral opposing beams (all 15 MV beam quality), each with multi-leaf collimators used for beam shaping. The CTV dose coverage criterion was 95% of the prescribed dose while for the PTV 90% dose coverage was accepted posterior towards the rectum. The OAR dose restrictions were maximum 50 Gy to 50% of the rectum volume and maximum 60 Gy to 50% of the bladder volume.
The VMAT plans were generated according to our recent procedures using a partial 6 MV single arc with a 12° posterior avoidance sector. The primary PTV was generated by isotropically expanding the prostate and seminal vesicles by 5 mm, while the boost PTV was defined by a 2 mm margin to the prostate. A moderately hypo-fractionated dose regime applying 67.5 Gy to the prostate and 60 Gy to the seminal vesicles was administered with simultaneously integrated boost treatment plans delivered over 25 fractions. The planning aim was to cover the PTVs with 95% of the respective prescribed dose while maintaining the dose criteria for the rectum and bladder: less than half the circumference of the rectum should receive 50 Gy and not more than 10 cm3 should receive 60 Gy. A maximum of 35% of the bladder volume should receive doses above 45 Gy.
For the proton plans, 67.5 Gy(RBE) was prescribed to the prostate and 60 Gy(RBE) to the seminal vesicles over 25 fractions (same PTVs as for the VMAT plans). Also the same dose criteria as for the VMAT plans were applied during optimisation of the two opposing lateral fields, in addition to further constraining the doses to OAR and normal tissue wherever possible. The scanning proton beams were generated from generic beam data based on the first generation Varian ProBeam machine using the Proton Convolution Superposition algorithm: PCS_11.0.31-90MeV. Beam spot spacing was 5 mm in the scanning direction as well as between the 12 scanning layers delivering nominal energies just below 200 MeV.
Modelling risk of radiation-induced cancer
Risks of radiation-induced SC were estimated for the rectum and bladder based on dose/volume distributions for each individual patient and treatment technique. We considered the three following dose-response relationships, reflecting varying degrees of cell sterilisation ():
| 1) | A LNT dose-response from atomic bomb survivors adjusted by a reduction ratio estimated by Berrington de Gonzalez et al. [Citation20] in a recent review of high-dose fractionated RT. | ||||
| 2) | A linear-plateau (Lin-Plat) relationship with organ-specific parameters obtained from fit to follow-up data from Hodgkin's patients treated with RT [Citation15]. | ||||
| 3) | A bell-shaped competition model with reduction in risk at higher doses with incorporated effects of fractionation and cell sterilisation [Citation28]. | ||||
Figure 1. Dose-response relationships for the bladder according to reduced LNT, linear-plateau and competition model. Differences in dose-response relationships reflect varying degrees of cell sterilisation.
Schneider [Citation16] suggested the use of direct relative risk comparisons in order to limit the substantial uncertainty involved in absolute risk measures [Citation14,Citation29]: The organ equivalent dose (OED) measure represents the same radiation-induced hazard as the equivalent amount of uniform (organ) dose, and we adapted this method to all three dose-response relationships. The OEDs were obtained by using the originally published model parameters as listed in the Supplementary Appendix (where also further details of the calculation procedures are shown, available online at http://informahealthcare.com/doi/abs/10.3109/0284186X.2015.1061691). The results are quoted as median and range of all 10 patients.
We further calculated the lifetime attributable risk (LAR): the absolute risk of developing a radiation-related cancer throughout life (up to attained age 100 years) following radiation exposure using age-, gender- and site-specific risk coefficients estimated by Berrington de Gonzalez et al. [Citation30]. Their models were broadly based on the risk transport models developed by the Biological Effects of Ionizing Radiation (BEIR) VII committee [Citation14] for estimating organ-specific lifetime risks using data from Japanese atomic bomb survivors. However, Berrington de Gonzalez also included models for additional organs (e.g. rectum). These latter low-dose estimates of lifetime risk functioned as the initial slope of our non-linear models, while for the LNT dose-response the slope was in accordance with the organ-specific reduction factors [Citation20].
We calculated risks for patients receiving RT at ages 50, 60, 70 and 80 years. The median age at diagnosis for prostate cancer patients is 66 years [Citation31]. We present most generic LAR results corresponding to RT at age 60 years in order to remain on the conservative side with respect to our age subdivision.
The LAR models were developed and intended for low-dose rate (< 0.01 mGy/min) and low-dose (< 100 mGy) exposures and were originally adjusted (to a lower risk) by a dose and dose-rate effectiveness factor (DDREF) of 1.5, hence this was taken out by us in the following LAR calculations [Citation14,Citation30].
TPSs are in the context of photon RT considered accurate within clinically relevant doses, such as for organs located inside the primary fields [Citation32]. During proton therapy, the bladder and rectum are partially located outside the primary fields and we therefore treated these organs as partially out-of-field in the IMPT plans: To ascertain that the dose to these volumes were not underestimated we added a stray radiation dose of 0.3 Gy(RBE) from Fontenot et al. [Citation33] to the volumes that by the TPS was reported to receive doses below this dose. The consecutive dose bins below this threshold were shifted to 0.3 Gy while above this threshold the doses from the TPS were used. We present results both with and without this adjustment.
The (truncated) OED and LAR does not necessarily give an account of which dose levels are contributing to the resulting risk quantity, nor do they provide spatial information of risk origin. For the LNT model, increasing dose signifies increased risk, whereas the outcome based on dose-volume configuration for the non-linear models is less transparent: The Lin-Plat model reach the risk maximum and levels off at about 0.5 Gy for the bladder and 10 Gy for the rectum (). For the bell-shaped competition model we stratified the dose-volume distributions according to hazard level to highlight details of risk affiliation relative to the maximum risk at 4 Gy. Segments assigned risks below half of the risk maxima were stratified according to high- or low-dose ancestry. This corresponded to approximately 1 Gy on the low-dose side and 10 Gy on the high-dose side.
Results
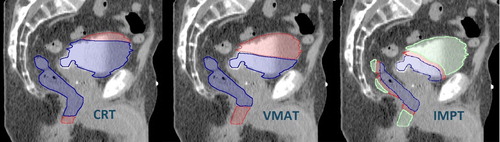
All plans fulfilled the required target dose coverage for all patients. IMPT achieved the most favourable results with respect to OAR mean doses while the combination of fields and wide margins during CRT lead to the highest mean doses. For IMPT, the volumes receiving lower and moderate doses were also significantly reduced compared to VMAT: V20Gy was reduced by 50% and V40Gy was reduced by 25%. shows the dose distributions for CRT, VMAT and IMPT, with further plan characteristics listed in .
Figure 2. Dose distributions for one of the patients: CRT and VMAT in Gy, and IMPT in Gy(RBE).
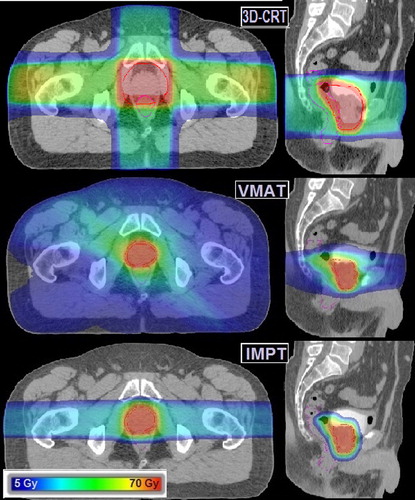
Table I. Treatment plan characteristics.
The SC risk models was found to rank the plans quite differently (): Assuming a linear dose-response resulted in IMPT having the most advantageous outcome with median LAR of 1.2% (bladder; 0.8%; rectum: 0.4%), while CRT gave a total risk for these organs of 3.9% (bladder; 2.9%; rectum: 1.0%). The non-linear models appointed lower risks to both organs with accumulated risks well below 1% for all techniques (). Applying the competition model the CRT plans were assigned the lowest risk, while IMPT had the lowest risks for both organs according to the plateau model.
Figure 3. The lifetime attributable risks for the bladder and rectum: median of all patients assuming age at treatment 60 years.
Table II. Median (range) OED and LAR range assuming age at exposure 60 years.
Considering ratios of the OED medians for VMAT versus IMPT, the relative risks were 1.2 (competition), 1.1 (Lin-Plat) and 1.7 (LNT) for the bladder and with corresponding ratios for the rectum: 0.9, 1.6 and 1.8.
Including age as a variable increased the SC risk for younger patients, resulting in five and 11 times higher risk for bladder and rectal cancer if patients were treated at 50 years versus 80 years. compares the age-stratified risks for VMAT and IMPT including all dose-response relationships.
Figure 4. Lifetime attributable risks for bladder and rectal cancer following VMAT and IMPT (including scatter doses) at age 50, 60, 70 and 80 years. The ranges include median risks for all patients for all dose-response models. Upper bounds defined by the LNT risk and lower bounds defined by Lin-Plat risk for IMPT and competition model risk for VMAT.
A variation in risk between patients was also evident as a result of individual differences in patient anatomy (Supplementary Figure A1, available online at http://informahealthcare.com/doi/abs/10.3109/0284186X.2015.1061691). The degree of fluctuation varied between patients depending on applied model and RT technique. Both the competition and LNT models resulted in strong inter-patient variations; with the competition model the systematic differences were smaller for VMAT compared to IMPT, while with the LNT model the situation was reversed. The competition model also ranked the plans less monotonous (sequentially) depending on technique, quite the opposite of the LNT which demonstrated strong intraclass correlation. From the Lin-Plat model the risks were approximately constant for CRT and VMAT which indicated that the majority of the risk was accumulated from doses exceeding the linear risk dose range. Reversely the IMPT plan revealed accumulation of risk weight from low-dose (or no dose) volumes. In general the risk estimates for the rectum fluctuated less than for the bladder.
illustrates the volume fractions of the bladder and rectum stratified according to associated risk level also differentiating depending on which side of the risk window accumulation of risk occurred. For IMPT the volume fractions receiving doses below 1 Gy were 48% (9–72%) for the bladder and 37% (18–58%) for the rectum. CRT was the favoured modality from the perspective of the competition model, yet with 90% of the volume located in the low-risk segments at the high-dose end of the risk window. For VMAT there was a shift from high doses with low risk exchanged with a larger volume fraction of lower dose segments (1–10 Gy) associated with high risk. In contrast to the two photon modalities, IMPT also sampled risk from lower doses.
Figure 5. Risk segments of the rectum and bladder according to the competition model. High risk 1–10 Gy (red). Low and moderate risk: from low dose < 1 Gy (green) and from high dose > 10 Gy (blue).
Discussion
In this study we have investigated SC risks for the bladder and rectum which during treatment of prostate cancer are either partially or fully in-field, depending on which RT technique is employed. There are considerable uncertainties in the SC dose-response in these scenarios and we therefore explored and compared several risk models proposed in the literature. CRT was by the LNT model associated with the highest risk while the competition model assigned the lowest risk to CRT among the explored RT techniques.
Most clinical studies compare SC incidence for prostate cancer patients treated with RT versus patients having undergone surgery, including cohort studies presenting lifetime risks with follow-up exceeding 10 years. The highest overall incidence of SC associated with RT (1.4%) has been reported by Brenner et al. [Citation2,Citation3], while Baxter et al. and Berrington de Gonzalez et al. both reported risks of 0.5% [Citation5,Citation20]. For CRT our estimates of lifetime risks of bladder cancer extended up to 0.4% based on the non-linear dose-responses, matching fairly well the clinically reported risks around 0.5–0.6% [Citation3,Citation34]. With the linear model these risks were overestimated (with predicted risks of 2.2–3.6%). A significant increase of rectal cancer following RT was found by Baxter et al. [Citation5] and Brenner et al. [Citation3] reporting incidences in the range 0.1–0.2%. The competition model estimates were on the lower side of these clinical data, while the Lin-Plat risks exceeded the reported incidence. The LNT model overestimated the clinically observed risk of rectal cancer by 10-fold. Brenner et al. found 37% of all SC in the bladder and 12% in the rectum [Citation3] and according to most reported clinical data [Citation2] the risks of secondary bladder cancer exceed the risk of rectal cancer. This proportional fit was in our results best described by the competition model and the linear model.
The majority of the clinical follow-up analyses is based on The Surveillance, Epidemiology, and End Results (SEER) registry data and covers a wide range of technical advances starting from the early 1970s and extending to mid-2000 [Citation31]. Our CRT plans represent RT closer related to techniques of the latter years which could indicate that some of the follow-up data also relates to less conformal dose distributions compared to the treatment plans used as basis for our estimations. In a recent study including a large cohort of prostate cancer patients, 3D-CRT was found to have reduced secondary rectal cancers compared to conventional (non-conformal) RT [Citation35]. 3D-CRT was gradually introduced in the mid-90s and is likely not very different from the wide margin CRT technique in our study. In such a case our results should preferably match the lower side of the clinically reported risks.
Murray and colleagues recently reviewed RT planning studies for localised prostate cancer addressing relative and absolute SC risks using different dose-response models [Citation13]. The studies including proton modalities found the lowest overall risks as well as reduced risks for the bladder and rectum when applying lateral opposing spot scanning protons. Fontenot et al. used the LNT model and found that passively scattered proton therapy significantly reduced the overall risk of SC compared to IMRT in three prostate patients [Citation21]. Yoon et al. estimated a five times higher overall risk after IMRT compared to passively scattered protons using Schneider's Lin-Plat model [Citation23]. As for the bladder and rectal cancers, the SC risks were twice as high for IMRT in the five patients included in their study. Only two of the reviewed studies considered (beam scanning) IMPT and both of these were compared to 3D-CRT [Citation25,Citation26]. None of the latter studies specifically addressed the bladder and rectum; however, the overall risk was found to be halved with IMPT. Rechner et al. estimated that (passive scatter) proton arc therapy did not increase the predicted risk of bladder and rectal cancer regardless of risk model applied when compared to VMAT in three patients [Citation24]. They compared their LNT results to IMRT and passively scattered proton therapy delivered with lateral opposing beams from Fontenot et al. (table 3 [Citation24]). The comparison showed that the estimated risk of bladder cancer was lowest for lateral-opposed proton beams while the lowest estimated risks of rectal cancer were from the lateral-opposed protons and VMAT. The superiority of protons delivered with as few beams as possible to minimise SC is also in accordance with the work of Timlin et al. [Citation36].
Whereas these studies did not directly compare VMAT and IMPT, our risk estimates for the bladder and rectum were for IMPT found to be lower or comparable to VMAT. It should be noted that our inclusion of scatter doses may represent a conservative (upper) estimate; assuming a uniform dose supplement to the out-of-field volumes might overestimate the dose as the contribution from neutrons is known to rapidly decrease moving away from the primary radiation field [Citation33].
In contrast to what is achievable with protons, contemporary photon techniques (IMRT and VMAT) obtain conformity by re-distributing the higher doses to the surrounding volumes successively resulting in a low-dose bath. The increased amount of in-field volumes from VMAT, yet with lower doses, should be carefully monitored considering the unknown biological effects of the dose re-distributions. Regarding radiation-induced out-of-field SC after treatment with older techniques, most of these have been observed in the lungs [Citation2], e.g. with 34% of the total radiation associated SC found in the lungs by Brenner et al. [Citation3]. While out-of-field scatter doses may increase with contemporary photon techniques (compared to CRT), IMPT scatter doses to the lungs are considered negligible for prostate cancer patients following proton RT [Citation33].
A highly topical application of SC risk modelling is that of prospective RT assessment aiming at reducing side effects and improving decision making tools. The substantial uncertainties in the absolute risk as well as in the functional relationship have made relative comparisons between RT techniques an important tool. Reasonably high confidence is placed in a linear risk relationship at dose levels relevant for out-of-field organs, which makes the relative risk a fairly accurate description of the actual risk in such scenarios. While SC risk reduction based on LNT models is synchronised to principles of maintaining normal tissue dose as low as possible, the non-linear dose-response models would involve more complex moderations. Furthermore, the narrow high-risk dose window of bell-shaped dose-responses makes such models sensitive in particularly to variations within the given dose interval. This feature does not only make (hypothetical) dose optimisation challenging considering uncertainties in dose delivery, but also contributes to substantial variation between individual patients as was illustrated in our results. These variations are to a large extent caused by the tendency of certain techniques to show fluctuations in the sensitive dose-levels of a particular model. For instance, different field-edge positions for IMPT caused the in-field volume fraction to vary considerably from patient to patient. The varying presence of low doses was furthermore observable as fluctuations in the Lin-Plat results. Another predicament of the non-linear models is the positive assignment of weight to high-dose volumes. In the context of ranking plans these volumes should be tagged as less favourable than risk collected on the low-dose side of the risk window. A more clarifying transcription would be to quote non-linear OEDs beside linear estimates (or mean dose) reflecting the integral dose, or the risks may be assessed accompanied by differential DVH as done by Dasu et al. [Citation17] and Ardenfors et al. [Citation37].
The competition model incorporates effects of fractionation, which is not accounted for in the LNT and Lin-Plat models. However, the effects of differences in fractionation had minimal impact on our competition model results by interchanging fractionation schemes for CRT and the contemporary techniques (less than 1% lower with the hypo-fractionation scheme). For comparing the overall biological impact, the biologically effective dose concept could also have provided further insight [Citation38]. For the LNT and Lin-Plat models, this would be expected to assign a slightly higher risk for the hypo-fractionated VMAT and IMPT plans than what was presented in our results. Smaller variations may also be seen from choice of other OED model parameters. Applying different α/β ratios was found to have little influence on the resulting competition model risk curve investigated by Dasu et al. [Citation39]. Yoon et al. varied the parameters in the Lin-Plat model and observed no significant impact on the relative risks [Citation23]. The results may also be affected by uncertainties related to carcinogenesis and constant RBE-weighting of protons [Citation38] which was not further investigated in our current study. Substantial uncertainties are associated with absolute risks apparent in the initial slope of the dose-response relationships. The LNT model is included in the majority of SC risk estimation studies whereas the same slope (factor) as applied for the non-linear models often is found to predict unrealistically high absolute risks [Citation17,Citation29]. The linear risk relationship following RT as observed by Berrington de Gonzalez et al. [Citation20], yet with a reduced slope compared to the atomic bomb survivors, is an interesting scenario and cannot be ruled out as a distinguishing factor between dose exposure of fractionated RT and acute exposures from atomic bomb survivors. Details of the dose-response at low doses (below 5 Gy) were not specifically addressed in the review from Berrington de Gonzalez and may involve additional features.
Our study was based on dose calculations on planning computed tomography (CT), which introduce further uncertainties in dose delivery due to organ motion in the pelvis. Our results demonstrated considerable fluctuations in SC risk due to inter-patient anatomy variations, indicating the relevance of also including the effects of variations in organ position and shape for individual patients. Our initial exploration of this topic has showed that the day-to-day variations in anatomy can lead to fluctuations in SC risk estimates that are of the same magnitude as the inter-patient variations. This is the subject of ongoing investigations at our institution; however, outside the scope of the present study.
Our focus has been on in-field and partly in-field organs where the benefit of IMPT may not be as pronounced as for out-of-field organs and the overall risk. Despite considerable uncertainties, similar or lower risks were estimated from IMPT compared to VMAT. If the advanced photon techniques should achieve their excellent result at the expense of higher SC risks compared to CRT we should carefully consider amongst the new available techniques which to choose. The clinical advantage of proton therapy for prostate patients is unclear [Citation10] and criteria for selecting patients who are expected to benefit from protons are under consideration as addressed in the model-based approach [Citation11]. Patients may be referred to proton therapy based on general improvements in the modelled complications on a population level, but also based on individual or other patient group-specific factors. From a SC risk perspective there may be patient-specific anatomy related predictors not yet identified, but considering the marked increase in SC risk for younger patients, age could be an important selection criterion to identify individuals with the greatest benefit of IMPT.
In conclusion, the SC risk estimations for the bladder and rectum revealed no clear relative relationship between the contemporary techniques and CRT with divergent results depending on the choice of model. When considering referral of prostate cancer patients to proton therapy, SC risks could be included considering the expected benefits of IMPT.
Supplementary material available online
Supplementary Appendix, Supplementary Figure A1 and Table AI available online at http://informahealthcare.com/doi/abs/10.3109/0284186X.2015.1061691
ionc_a_1061691_sm4224.pdf
Download PDF (190.7 KB)Declaration of interest: The authors report no conflicts of interest. The authors alone are responsible for the content and writing of the paper.
References
- Preston DL, Ron E, Tokuoka S, Funamoto S, Nishi N, Soda M, et al. Solid cancer incidence in atomic bomb survivors: 1958–1998. Radiat Res 2007;168:1–64.
- Murray L, Henry A, Hoskin P, Siebert FA, Venselaar J. Second primary cancers after radiation for prostate cancer: A systematic review of the clinical data and impact of treatment technique. Radiother Oncol 2014;110:213–28.
- Brenner DJ, Curtis RE, Hall EJ, Ron E. Second malignancies in prostate carcinoma patients after radiotherapy compared with surgery. Cancer 2000;88:398–406.
- Dörr W, Herrmann T. Cancer induction by radiotherapy: Dose dependence and spatial relationship to irradiated volume. J Radiol Prot 2002;22:A117–21.
- Baxter NN, Tepper JE, Durham SB, Rothenberger DA, Virnig BA. Increased risk of rectal cancer after prostate radiation: A population-based study. Gastroenterology 2005; 128:819–24.
- Davis EJ, Beebe-Dimmer JL, Yee CL, Cooney KA. Risk of second primary tumors in men diagnosed with prostate cancer: A population-based cohort study. Cancer 2014; 120:2735–41.
- Pesce GA, Clivio A, Cozzi L, Nicolini G, Richetti A, Salati E, et al. Early clinical experience of radiotherapy of prostate cancer with volumetric modulated arc therapy. Radiat Oncol 2010;5:54.
- Georg D, Hopfgartner J, Gòra J, Kuess P, Kragl G, Berger D, et al. Dosimetric considerations to determine the optimal technique for localized prostate cancer among external photon, proton, or carbon-ion therapy and high-dose-rate or low-dose-rate brachytherapy. Int J Radiat Oncol Biol Phys 2014;88:715–22.
- Cella L, Lomax A, Miralbell R. New techniques in hadrontherapy: Intensity modulated proton beams. Phys Med 2001;17:100–2.
- Mendenhall NP, Hoppe BS, Nichols RC, Mendenhall WM, Morris CG, Li Z, et al. Five-year outcomes from 3 prospective trials of image-guided proton therapy for prostate cancer. Int J Radiat Oncol Biol Phys 2014;88:596–602.
- Langendijk JA, Lambin P, De Ruysscher D, Widder J, Bos M, Verheij M. Selection of patients for radiotherapy with protons aiming at reduction of side effects: The model-based approach. Radiother Oncol 2013;107:267–73.
- Hall EJ, Wuu CS. Radiation-induced second cancers: The impact of 3D-CRT and IMRT. Int J Radiat Oncol Biol Phys 2003;56:83–8.
- Murray L, Henry A, Hoskin P, Siebert FA, Venselaar J, ESTRO BPgotG. Second primary cancers after radiation for prostate cancer: A review of data from planning studies. Radiat Oncol 2013;8:172.
- Committee to Assess Health Risks from Exposure to Low Level of Ionizing Radiation. Health risks from exposure to low levels of ionizing radiation: BEIR VII, Phase 2. Washington, D.C.: National Academies Press; 2006.
- Schneider U, Kaser-Hotz B. Radiation risk estimates after radiotherapy: Application of the organ equivalent dose concept to plateau dose-response relationships. Radiat Environ Biophys 2005;44:235–9.
- Schneider U, Kaser-Hotz B. A simple dose-response relationship for modeling secondary cancer incidence after radiotherapy. Z Med Phys 2005;15:31–7.
- Daşu A, Toma-Daşu I, Olofsson J, Karlsson M. The use of risk estimation models for the induction of secondary cancers following radiotherapy. Acta Oncol 2005;44: 339–47.
- Grantzau T, Thomsen MS, Vaeth M, Overgaard J. Risk of second primary lung cancer in women after radiotherapy for breast cancer. Radiother Oncol 2014;111:366–73.
- Sachs RK, Brenner DJ. Solid tumor risks after high doses of ionizing radiation. Proc Natl Acad Sci U S A 2005;102: 13040–5.
- Berrington de Gonzalez A, Gilbert E, Curtis R, Inskip P, Kleinerman R, Morton L, et al. Second solid cancers after radiation therapy: A systematic review of the epidemiologic studies of the radiation dose-response relationship. Int J Radiat Oncol Biol Phys 2013;86:224–33.
- Fontenot JD, Lee AK, Newhauser WD. Risk of secondary malignant neoplasms from proton therapy and intensity-modulated x-ray therapy for early-stage prostate cancer. Int J Radiat Oncol Biol Phys 2009;7:616–22.
- Fontenot JD, Bloch C, Followill D, Titt U, Newhauser WD. Estimate of the uncertainties in the relative risk of secondary malignant neoplasms following proton therapy and intensity-modulated photon therapy. Phys Med Biol 2010;55:6987–98.
- Yoon M, Ahn SH, Kim J, Shin DH, Park SY, Lee SB, et al. Radiation-induced cancers from modern radiotherapy techniques: Intensity-modulated radiotherapy versus proton therapy. Int J Radiat Oncol Biol Phys 2010;77: 1477–85.
- Rechner LA, Howell RM, Zhang R, Etzel C, Lee AK, Newhauser WD. Risk of radiogenic second cancers following volumetric modulated arc therapy and proton arc therapy for prostate cancer. Phys Med Biol 2012;57: 7117–32.
- Schneider U, Lomax A, Pemler P, Besserer J, Ross D, Lombriser N, et al. The impact of IMRT and proton radiotherapy on secondary cancer incidence. Strahlenther Onkol 2006;182:647–52.
- Schneider U, Lomax A, Besserer J, Pemler P, Lombriser N, Kaser-Hotz B. The impact of dose escalation on secondary cancer risk after radiotherapy of prostate cancer. Int J Radiat Oncol Biol Phys 2007;68:892–7.
- Vogelius IR, Bentzen SM. Meta-analysis of the alpha/beta ratio for prostate cancer in the presence of an overall time factor: Bad news, good news, or no news? Int J Radiat Oncol Biol Phys 2013;85:89–94.
- Daşu A, Toma-Daşu I, Franzén L, Widmark A, Nilsson P. Secondary malignancies from prostate cancer radiation treatment: A risk analysis of the influence of target margins and fractionation patterns. Int J Radiat Oncol Biol Phys 2011; 79:738–46.
- Stokkevåg CH, Engeseth GM, Ytre-Hauge KS, Röhrich D, Muren LP, Brydøy M, et al. Estimated risk of radiation-induced cancer following paediatric cranio-spinal irradiation with electron, photon and proton therapy. Acta Oncol 2014;53:1048–57.
- Berrington de Gonzalez A, Iulian Apostoaei A, Veiga LH, Rajaraman P, Thomas BA, Owen Hoffman F, et al. RadRAT: A radiation risk assessment tool for lifetime cancer risk projection. J Radiol Prot 2012;32:205–22.
- Howlader N, Noone AM, Krapcho M, Garshell J, Miller D, Altekruse SF, et al. SEER Cancer Statistics Review, 1975–2011, National Cancer Institute. Bethesda, MD. [SEER data submitted 2013 Nov]. [updated 2014 Apr]. Available from: http://seer.cancer.gov/csr/1975_2011/
- Howell RM, Scarboro SB, Kry SF, Yaldo DZ. Accuracy of out-of-field dose calculations by a commercial treatment planning system. Phys Med Biol 2010;55:6999–7008.
- Fontenot J, Taddei P, Zheng Y, Mirkovic D, Jordan T, Newhauser W. Equivalent dose and effective dose from stray radiation during passively scattered proton radiotherapy for prostate cancer. Phys Med Biol 2008;53:1677–88.
- Singh AK, Mashtare TL, McCloskey SA, Seixas-Mikelus SA, Kim HL, May KS. Increasing age and treatment modality are predictors for subsequent diagnosis of bladder cancer following prostate cancer diagnosis. Int J Radiat Oncol Biol Phys 2010;78:1086–94.
- Berrington de Gonzalez A, Wong J, Kleinerman R, Kim C, Morton L, Bekelman JE. Risk of second cancers according to radiation therapy technique and modality in prostate cancer survivors. Int J Radiat Oncol Biol Phys 2015;91:295–302.
- Timlin C, Houston M, Jones B. Malignant induction probability maps for radiotherapy using X-ray and proton beams. Br J Radiol 2011;84:70–8.
- Ardenfors O, Josefsson D, Dasu A. Are IMRT treatments in the head and neck region increasing the risk of secondary cancers? Acta Oncol 2014;53:1041–7.
- Dale RG, Jones B, Cárabe-Fernández A. Why more needs to be known about RBE effects in modern radiotherapy. Appl Radiat Isot 2009;67:387–92.
- Daşu A, Toma-Daşu I. Dose-effect models for risk-relationship to cell survival parameters. Acta Oncol 2005;44:829–35.