
Abstract
Objective: In the present study, Curcumin (CU)-loaded nanocarrier (NC) such as nanoemulsion (NE) was developed with the objective of increasing its cytotoxicity and bioavailability through lymphatic transport by enhancing its solubility and intestinal permeability.
Materials and methods: Based on the area obtained in pseudoternary phase diagram, various % combination of Labrafac Lipophile WL 1349, Solutol HS 15, Transcutol HP and distilled water were selected. Formulations which passed physical stability studies were selected for further studies such as globule size, zeta potential, in vitro release, ex vivo permeation, in vitro lipolysis studies, bioavailability studies and cytotoxicity against glioblastoma cells (U-87).
Result and discussion: The optimized NC (NE-SB1) had small average globule diameter of 67 ± 6 nm with zeta potential of −37 ± 2.5 mv which indicated long-term dispersion stability. During in vitro lipolysis study, the digestion rate of medium chain triglycerides increased with decreased globule diameter. Statistically significant difference was found in AUC0−inf of NC formulation (p < 0.05) compared to CU suspension. The relative bioavailability of NC was found 11.88 ± 0.47 with respect to CU suspension. During cytotoxicity studies, IC50 of CU solution on U87 cells was found 24.23 µM, while for the NE- SB1 it was 16.41 µM. The optimized formulation was found to be stable during 6 months of accelerated stability.
Conclusion: The overall results revealed that the CU-loaded NC is a very effective approach for enhancing the oral absorption of poorly water-soluble drug CU and have great potential for future clinical application.
Introduction
In recent years, extensive research has been carried out to study the health promotion properties of different phytochemicals such as polyphenols which are food supplements and commonly used in daily diet. One of the reasons for the growing interest in studying these compounds resides on their protector role against different type of cancer (Verma et al., Citation2009; Santos et al., Citation2012). The therapeutic efficacies of these dietary polyphenols were reduced because of restricted bioavailability which is not only due to the physiochemical properties (e.g. solubility, molecular weight, etc) of the bioactive compound, but also because of enzyme- and microbial-mediated biotransformation and active efflux (Kumar et al., Citation2010; Santos et al., Citation2012). The bioavailability of phytochemicals can be enhanced by encapsulating them into lipid based system which can change their pharmacokinetics (PK) and biodistribution (BD) (Huang et al., Citation2010).
Curcumin (CU), a diphenolic compound, is a natural, highly lipophilic bioactive with diverse pharmacological effects like antioxidant, anti-inflammatory, anti-diabetic, anti-depression, anti-agiogenic, hepatoprotective and anti-cancer activity (Duvoix et al., Citation2005; Aggarwal et al., Citation2007; Kumar et al., Citation2010). In solution, CU exists primarily in its enolic form characterized by strong intramolecular hydrogen bonds. The physicochemical properties of CU are due to the formation/disruption of both intra- and intermolecular H-bonds, along with charge delocalizations that are responsible for its therapeutic potential. Most of the CU (>90%) is rapidly degraded within 30 min of placement in phosphate-buffered saline (PBS) at pH 7.2 (Tonnesen & Karlsen, Citation1985; Zsila et al., Citation2003; Kumar et al., Citation2010). There is scientific evidence suggesting that CU is a highly pleotropic structure, that physically interacts with a wide range of molecular targets, e.g. transcription factors, growth factors and their receptors, cytokines, enzymes, and genes regulating cell proliferation. CU functions as an anti-cancer agent by activating apoptosis signalling and inhibiting cell proliferation (Duvoix et al., Citation2005; Bartik et al. Citation2010; Das et al., Citation2010). However, the main shortcoming associated with CU is its insignificant aqueous solubility, stability in gastrointestinal (GI) fluids and first pass metabolism which leads to poor bioavailability.
Despite extensive research and development, the restricted solubility of CU in aqueous solution remains a major barrier to its bioavailability and clinical efficacy. To improve bioavailability of CU, numerous approaches such as nanoparticles (Kakkar et al., Citation2011), liposome (Takahashi et al., Citation2009), microemulsion, (Hu et al., Citation2012) nanoemulsion (NE) (Kashif et al., Citation2012) self-microemulsifying drug delivery system (SMEDDS), (Cui et al., Citation2009) micelle (Zengshuan et al., Citation2007), solid dispersion (Onoue et al., Citation2010) and phospholipid-complexes (Maiti et al., Citation2007) had been developed. These systems provide certain advantages over dietary consumption such as longer circulation, better permeability, and resistance to metabolic processes. Design and development of lipid based drug delivery of therapeutic entities with improved bioavailability is the main research aspect on which extensive work had been done in the past few decades for different therapeutic drugs. One of the promising and exciting drug delivery system which can meet the above mentioned requirements is nanocarrier (NC) system such as NE. NEs are isotropic, highly kinetically stable, transparent (or translucent) systems of oil, water, and surfactant, frequently in combination with a co-surfactant having a droplet size usually in the nanometer range (typically in the range of 20–200 nm). The lipid and surfactant-based NC offers a practical advantage by improving the oral bioavailability of poorly water-soluble drugs by presenting and maintaining the drug in a dissolved state, at the molecular level, in small droplets of oil (<200 nm), throughout the GI tract during transit in GI tract (Amiji, Citation2007; Kumar et al., Citation2012).
The purpose of the present study was to develop stable CU-loaded NC such as NE (CU-NE) with food-acceptable ingredients, to augment the in vitro release by improving solubility and to enhance the bioavailability of CU by delivering it at the molecular level in the form of nano globule via lymphatic portal system in Wistar rat. Furthermore, the study was also aimed to evaluate the fate of drug on dispersion and digestion of the excipients, stability of CU in lipid NC at intestinal pH and efficacy by performing cytotoxicity studies using MTT assay method against glioma cells (U-87).
Materials and methods
Materials
Curcumin was received as a kind gift from Sami Labs, Mangalore, India. Labrafac Lipophile WL 1349 (Medium chain triglycerides [MCT]), Transcutol HP and Labrasol were obtained as a gift sample from Gattefosse (Mumbai, India). Linseed oil was purchased from Expo Essential Oils (New Delhi, India). Fish oil was a gift sample from Coastal exports (Mangalore, India). PEG 400, acetonitrile, and other chemicals and reagents used were purchased from Merck Limited (Mumbai, India) and were of analytical grade. Pancreatin (8 × USP), L-a-phosphatidylcholine, tris maleate and calcium chloride were purchased from Sigma-Aldrich Chemicals Pvt. Limited. Bangalore, India. Water was taken from Milli-Q water purification system (Millipore, Billerica, MA).
Instrumentation and chromatographic conditions
Curcumin was assayed by reversed-phase high-performance liquid chromatography (RP-HPLC) method using a Shimadzu HPLC system. The analysis was carried out on a LiChrospher®C18 (150 mm × 4.6 mm i.d., 5-µm particle size; Merck, India) column. The mobile phase used was acetonitrile: 3% Acetic acid solution (75:25). The flow rate was 1 mL/min and the retention time was 3.2 min. The detection was performed at 425 nm. The eluents were filtered (pore size, 0.45 µm) before use and then degassed by sonication in an ultrasonic bath for 10 min. The assays were performed at ambient temperature (25 ± 1 °C). Class VP 5.03 version software was used to process the chromatograms.
Formulation development and optimization
Screening of excipients
An important criterion for screening of components for high drug loading and more stability in NEs is the solubility of drug in oil and surfactant, and miscibility of oil with surfactant and co-surfactant. For determination of solubility of CU in different oils and surfactants, an excess quantity of CU was added to each 5-mL capacity stoppered vial containing 2 mL of Fish oil, Labrafac Lipophile WL1349, Sesame oil, Sefsol 218, Linseed oil, Solutol HS 15, Tween 80, Labrasol, Tween 20, Unitop FFT 40 and mixed using a vortex mixer (Optics Technology, Delhi, India) at room temperature. The mixture vial was then kept at 37 °C ± 1 °C in an isothermal shaker (Nirmal International, New Delhi, India) for 72 h to get equilibrium. The equilibrated samples were removed from the shaker and centrifuged at 5000 rpm for 15 min. The supernatant was taken and filtered through a 0.45-µm membrane filter and CU was assayed using validated high-pressure liquid chromatography (HPLC) method. For selection of suitable surfactant and co-surfactant, miscibility of oil (having maximum solubility of CU) was done with surfactants (having good solubility of CU) such as Solutol HS 15, Labrasol and Unitop FFT 40 and co-surfactants such as Lauroglycol FCC, Transcutol HP and 1, 2 Propylene glycol 1:1 ratio. The sample which showed transmittance more than 85% was considered clear, less than 85% and more than 70% was considered translucent and those have less than 70% transmittance was considered as turbid.
Process parameter optimization for construction of pseudo-ternary phase diagrams
On the basis of solubility/miscibility studies, Labrafac Lipophile WL1349 was selected as the oil phase, Solutol HS 15 as a surfactant and Transcutol HP as a co-surfactant. Double distilled water was used as an aqueous phase to avoid impurities. Surfactant and co-surfactant were mixed (Smix) in different weight ratios (1:1, 2:1, 3:1 and 1:0) with increasing and then decreasing (1:2) amount of surfactant with respect to co-surfactant.
Stirring speed
The effect of stirring speed (200, 400, 600 and 1000 rpm) of vortex mixer (Optics Technology, Delhi, India) on turbidity was investigated by adding the aqueous content to the mixture of oil and Smix (1:9 ratio) at 25 °C. For measuring turbidity, the formed NE sample was diluted 200 times with water. Turbidity was measured by using UV spectrophotometer (Shimadzu, Japan) at 704 nm in terms of percent transmission or transmittance, varies from 0 to 100% and is based on the amount of light that is able to penetrate through the sample.
Stirring time
The effect of stirring time (30, 60, 90 and 120 s) of vortex mixer (Optics Technology, Delhi, India) on turbidity was investigated by adding the aqueous content to the mixture of oil and Smix (1:9 ratio) at 25 °C. For measuring turbidity, the formed NE sample was diluted 200 times with water.
Temperature
The effect of temperature on turbidity was investigated by incubating the oil phase and non-ionic surfactant or Smix at different temperatures (20, 30, 40 and 50 °C for 30 min) prior to use for titration. For measuring turbidity, the formed NE sample was diluted 200 times with water.
Addition of oil and surfactant or Smix
The effect of addition of surfactant and oil on turbidity was investigated using two different approaches. In first approach the Smix was added drop wise to the oil phase followed by addition of aqueous phase drop wise. In second approach oil was added drop wise to the Smix phase followed by addition of aqueous phase drop wise. For measuring turbidity, the formed NE sample was diluted 200 times with water.
Construction of pseudo-ternary phase diagrams
For the development of CU-loaded NE, pseudoternary phase diagrams were constructed to recognize the zone of NE formation using aqueous titration method. Sixteen different combinations of oil and Smix (1:9, 1:8, 1:7, 1:6, 1:5 1:4, 1:3.5, 1:3, 3:7, 1:2, 4:6, 5:5, 6:4, 7:3, 8:2 and 9:1) were made so that maximum ratio could be covered for the study to mark out the boundaries of the phases formed precisely in the phase diagrams. Slow titration with the aqueous phase under moderate stirring (at 400 rpm for 60 s) was done for each weight ratio of oil and Smix, and visual observations were made for transparent and easily flowable oil-in-water (o/w) NEs. The physical state of NE was marked on a pseudo three component phase diagram with one axis representing the aqueous phase, second representing oil and the third representing a mixture of surfactant and co-surfactant at fixed weight ratio.
Selection of formulations from phase diagram
Formulations were selected from phase diagram, which formed maximum NE area. The criteria for the selection were based on the following points (Kumar et al., Citation2012):
The formulation having oil concentration such that it could dissolves maximum concentration of CU easily without any precipitation.
For each oil percentage selected, the concentration of surfactant should be minimum for NE preparation.
The formulation composition should be having maximum water content.
Physical stability study
To overcome the problem of metastable formulations, physical stability tests (Kumar et al., Citation2012) were performed. Selected formulations were subjected to physical stability stress tests as heating cooling cycle, freeze–thaw cycle and centrifugation. Heating cooling cycles between 45 ± 2 °C and room temperature (25 ± 2 °C) with storage time of not less than 24 h at each temperature (six cycles each).
Freeze thaw cycle at −20 ± 2 °C in a deep freezer (Vest frost, Hyderabad, India) and room temperature (25 ± 2 °C) for 24 h were carried out six times (six cycles each) followed by centrifugation at 5000 rpm for 20 min.
Formulation of CU-loaded nanoemulsion
Optimization of process of addition of drug
The effect of addition of drug on turbidity and drug precipitation was investigated using two different approaches. In first approach the drug (10 mg)) was added to the oil phase with stirring followed by addition of Smix and aqueous phase to form 1 mL NE. In second approach the drug (10 mg) was added to the formed NE. In order to observe the drug precipitation formed NE was centrifuged at 5000 rpm for 10 min. For measuring turbidity, the formed NE sample was diluted 200 times with water.
CU-loaded nanoemulsion
Nanoemulsifying properties of NE strongly depend upon the selected oil, surfactants, co-surfactants and their relative amounts. The utilization of oil and surfactant(s) mixtures gives the possibility to optimize the NE for a particular drug. CU was dissolved in required quantity of oily phase with stirring, Smix was added to the oily phase and finally required quantity of aqueous phase was added to the mixture. The mixture was vortex for 60 s to form NE formulations. The developed NE formulations were subjected to dispersibility studies.
Dispersibility studies
The in vitro process of emulsification of CU-NE was assessed using a standard USP dissolution apparatus. One mL of NE was dispersed in 500 mL of media (0.1 N HCl) maintained at 37 ± 0.5 °C. The paddle was rotated at a speed of 50 rpm to provide gentle mixing. The in vitro performance of the NE formulations were visually assessed using the grading system: grade A, quickly forming NE (<1 minute of dilution) with a clear, transparent appearance; grade B, a slightly less clear and rapidly forming NE (<1 minute of dilution) with a bluish–white appearance; grade C, a fine milky-white emulsion formed within 2 min of dilution; grade D, gradually formed (>2 min of dilution) oily emulsion with a greyish–white appearance; grade E, appearances of large oil globules on the surface of dilution medium with signs of phase separation.
Characterization of CU-loaded NE
Globule size analysis
Globule size of the NE was determined by photon correlation spectroscopy using Zetasizer Nano ZS90 (Malvern Instruments, Worcestershire, UK) at 633 nm which is based on the principle of dynamic light scattering. The measurements were performed using a He–Ne laser at 633 nm by using Avalanche photo diode detector. Light scattering was monitored at 25 °C at a scattering angle of 90°. The formulation was diluted with distilled water and filtered through 0.22-µm membrane filter in order to eliminate multi-scattering phenomena and experimental errors. Droplet size distribution studies were performed at refractive index 1.41, viscosity 5.0 PaS and dielectric constant 79.4. Zeta potential was measured by applying an electric field across the dispersion. Particles within the dispersion with a zeta potential migrated towards the electrode of opposite charge with a velocity proportional to the magnitude of the zeta potential. The velocity was measured by using M3PALS (Phase Analysis Light Scattering).
Viscosity determination
Brookfield DV III ultra V6.0 RV cone and plate rheometer (Brook-field Engineering Laboratories, Inc, Middleboro, MA) with spindle # CPE40 at 25 ± 0.5 °C was used for the determination of viscosity of the formulations. The optimized parameters used were: Sample size/wt: 0.5 g, Speed: 30 rpm, Data interval: 1.0, Loop start: 1, Wait time: 30 min, Temperature: 25 ± 0.3 °C, Shear rate: 60 s−1.
Refractive index
Refractive index of formulation was determined using an Abbes type of refractrometer (Precision Standard Testing Equipment Corporation, Delhi, India), which was calibrated using castor oil prior to use.
Robustness to dilution
The selected CU-NEs (10 mg/mL) were diluted 50, 100, 250 and 1000 times with distilled water and evaluated for changes in transmittance or turbidity.
Centrifugation test
The sample was diluted 100 times with distilled water, centrifuged at 5000 rpm on Remi centrifuge (Remi equipments, Mumbai, India) for 10 min and then examined visually for any phase separation.
Solubility characteristics of CU in NE
The CU loading potential was evaluated in the selected NE formulation SB1. The NE-SB1 was prepared using different CU concentration (10, 20, 40, 60 100 mg/mL) by optimized procedure. The formation of CU crystals within the NE was evaluated by measuring transmittance. The yellow sediment (if occur) was evaluated at the bottom of test tubes after centrifugation at 5000 rpm for 10 min. The amount of CU dispersed within the supernatant NE was evaluated using a validated HPLC method. The percentage of CU (CU %) encapsulated within the NE was calculated using the following equation:
where CUs is the CU concentration remained dispersed within the NE at a specific time and CUi is the initial CU concentration.
Surface morphology by transmission electron microscopy (TEM)
Morphology and structure of the NE-SB1 was studied using Morgagni 268D TEM (FEI, Netherland) operating at 70 KV and capable of point to point resolution. Combination of bright field imaging at increasing magnification and diffraction modes were used to reveal the form and size of NE droplets. In order to perform the TEM observations, a drop of NE (SB1) was applied on carbon coated grid with 2% phosphotungstic acid (PTA) and was left for 30 s. The dried coated grid was taken on a slide and covered with a cover slip. The slide was observed under the electron microscope.
Surface topography by atomic force microscopy (AFM)
The three dimensional characteristic of globule shape of NE-SB1 was further characterized by AFM (Nanonics MultiView 2000™, Nanonics Imaging Limited, Israel). A drop of NE-SB1 was placed on freshly cleaved mica plate. The sample was air dried at room temperature and mounted on the microscope scanner. The shape was observed and imaged in noncontact mode with frequency 312 kHz and scan speed 2 Hz.
Stability of CU-loaded NE in phosphate buffer (pH 6.8)
In order to assess the stability of CU-loaded NE (NE-SB1) in GI pH (pH 6.8), 10 mg/mL CU was loaded in NE and was diluted with phosphate buffer pH 6.8 up to 1000 ng/mL and kept in a dark place at room temperature. Remained amount of CU after predefined time interval (0, 1, 4, 8 and 24 h) was determined using validated stability indicating HPLC method.
In vitro release studies
The in vitro release studies were performed to compare the release of CU from CU-NE formulations (NE-SA2, NE-SB1, NE-SB3, NE-SB6 and NE-SC4) with CU suspension. CU was mixed with sodium carboxy methyl cellulose solution (2 %w/v) in mortar until the mixture became uniform and was then made up to volume to prepare 10 mg/mL of suspension (CUS). The dialysis bag (MWCO 1200 g/mole, Sigma Aldrich, Bangalore, India) was treated as per instruction of Sigma Aldrich. One mL of NE formulation (10 mg/mL) and CU suspension (CUS) was filled in treated dialysis bag which was tied using nylon thread. Integrity of bag was assessed visually. The release study was performed in 500 mL of simulated gastric fluid (SGF) (0.1N HCl) containing 0.1% w/v ascorbic acid using USP apparatus 1 (Basket), at 100 rpm, 37 ± 0.5 °C (Hanson Research SR8 plus, CA). The dialysis bag was kept inside the basket. 5 mL samples were withdrawn at regular time intervals (10, 20, 30, 60, 120, 180, 240, 300, 360 and 720 min) and aliquot amount of SGF was replaced in order to maintain sink condition. The samples were analyzed for the drug content using UV–Vis spectrophotometer method (Shimadzu, Kyoto, Japan) at 423 nm.
Ex vivo release studies
All animal experiments were carried out after approval of the protocol by Jamia Hamdard, Institutional Animal Ethics Committee, New Delhi and their guidelines were adhered for the complete study. In order to determine release study using rat intestinal membranes, duodenum was taken, washed with saline to remove excretory product present in the duodenum by flushing. One mL of NE formulation (10 mg/mL) and suspension was filled in duodenum separately which were tied using nylon thread. The release studies were performed in 500 mL of simulated intestinal fluid (pH 6.8 phosphate buffer) containing 0.1% w/v ascorbic acid using USP apparatus 1 (Basket), at 100 rpm, 37 ± 0.5 °C (Hanson Research SR8 plus, CA). The duodenum was kept inside the basket. 5 mL samples were withdrawn at regular time intervals (10, 20, 30, 60, 120, 180, 240, 300, 360 and 720 min) and aliquot amount of simulated intestinal fluid was replaced in order to maintain sink condition. The samples were analyzed for the drug content using UV–Vis spectrophotometer method (Shimadzu, Kyoto, Japan) at 424 nm.
In vitro lipolysis studies (pH stat method)
The procedure for the dynamic in vitro lipolysis experiment was designed to achieve maximum pseudo-physiological conditions to study the influence of NE composition on lipid digestion and CU bioaccessibility (BA), and was a modification of those described previously (Dahan & Hoffman, Citation2007; Li & McClements, Citation2010).
Preparation of lipolysis reagents
A digestion buffer pH 6.8 was prepared by adding the following ingredients to sufficient deionized water to prepare 1 l of the buffer; CaCl2·2H2O (5 mM), NaCl (150 mM), tris-maleate (50 mM), and NaOH (39.75 mM). The pH of the medium was adjusted with 1M NaOH or 1N HCl. In this study, pancreatin with an amylase activity not less than 25 USP, lipase activity not less than 2.0 USP and protease activity not less than 25 USP was used. Fresh pancreatin extract was prepared by adding 1 g of porcine pancreatin powder to 5 mL digestion buffer, stirring for 15 min by homogenizer to produce a 200 mg/mL suspension and incubated for 20 min at 37 °C.
Lipolysis medium was prepared by dissolving 0.26 g of taurocholic acid (5 mM) and 0.10 g of l-α-phosphatidylcholine (1.25 mM) (conditions mimicking fasted state GIT) in 100 mL of pH 6.8 digestion buffer at 50 °C with the aid of a magnetic stirrer/hot plate unit (Optics Technology, New Delhi, India). The heat and agitation was maintained for approximately 30 min until L-α-phosphatidylcholine was fully dissolved. The pH of the buffer was re-adjusted to 6.8 using 1.0M NaOH or 1N HCl.
In vitro lipolysis experiments using bio-relevant media
The experimental medium, which comprised of 35.5 mL of lipolysis medium (pH 6.8) was continuously stirred (100 rpm) and maintained at 37 ± 0.5 °C throughout the experiment. Prior to each experiment, the pH electrode of the pH meter (Mettler, India) was calibrated using standard buffers of pH values 4 and 10. The tip of the pH electrode was positioned 1 cm below the surface of the bio-relevant medium. At the beginning of each experiment, 1 g of the NE formulation was dispersed in the bio-relevant medium and stirred for 15 min. The pH of the buffer was re-adjusted to 6.8 using 1.0M NaOH or 1N HCl. About 3.5 mL of the pancreatin extract (200 mg/mL) was inserted into the medium and initiated the enzymatic digestion of the formulation. The pH of the reaction medium 6.8 was maintained with an accuracy of ±0.2 pH units using 0.15M NaOH as the titrant. This is important since during the lipolysis process of triglycerides, free fatty acids (FFA) are liberated and consequently the pH decreases. The experiment was continued for 30 min, in which time the enzymatic digestion process was completed, as indicated by the completion of the pH titration. The volume of NaOH added to the dispersed NE was recorded and used to calculate the concentration of FFA generated by lipolysis.
FFA are released from the sample when pancreatin lipase in the SSIF interacts with triacylglycerols in the digestion vessel. Each triacylglycerol molecule generates two FFAs when fully digested; hence, the fraction of FFA released from a sample can be calculated from knowledge of the total amount of triacylglycerols originally present within the digestion cell and the amount of FFAs released after a particular digestion time. The percentage of FFAs released is calculated from the number of moles of alkali (NaOH) required to neutralize the FFA divided by the number of moles of FFA that could be produced from the triacylglycerols if they were all digested (assuming two FFA produced per triacylglycerol molecule):
Here, VNaOH is the volume of sodium hydroxide required to neutralize the FFA produced (L), MNaOH is the molarity of the sodium hydroxide solution used (M), Wlipid is the total mass of triacylglycerol oil initially present in the digestion cell (in g), and Mlipid is the molecular mass of the triacylglycerol oil (in g mol−1). The data generated by this method consist of a curve of %FFA released versus time.
Bioaccessibility determination
The BA of CU was evaluated after the samples had passed through the simulated small intestine phase of the in vitro GI model. To determine the concentration of CU retained in the aqueous phase of the digestion medium post-lipolysis, 500 µL of the sample was taken out at time interval of 5 min, 10 min, 15 min, 20 min and 30 min. At the given time point, samples of the digestion medium were removed and immediately treated with digestion inhibitor (5 μL per 1 mL of digestion medium of 1.0 M 4-bromophenylboronic acid in methanol) to inhibit the digestion (Williams et al., Citation2012). Samples were then separated by centrifugation using ultracentrifuge (C-24, Remi Instrument Ltd, Mumbai, India) at 10 000 rpm for 60 min at 4 °C, into two phases, namely, a dispersed aqueous colloidal phase and sediment phase. After separation, the aqueous fraction was filtered through 0.45-μm membrane filter and analyzed for CU with HPLC. At the end of experiment sediment phase was dissolved in acetonitrile and centrifuged for 10 min at 10 000 rpm. Supernatant was taken out, filtered through 0.45-μm membrane filter and analyzed for CU content by HPLC. The BA of CU was determined using the following equation:
where, CCM is the CU concentration in micelle/colloidal phase and CCI is the CU initial concentration dissolved in fresh NE.
Ex vivo everted gut sac method
An improved everted gut sac model can be used as an in-vitro tool to study the mechanisms and kinetics of drug absorption. For the study, Male Wistar rats (200–250 g), after being fasted for 10–12 h with free access to tap water, were anesthetized by excessive ether inhalation. Following a midline incision in the abdomen, the small intestine was excised at two positions, at 4 cm distal to the stomach and at the ileocecal junction. The entire length of the small intestine was carefully removed and, before tissue preparation, placed in Krebs Ringer solution (pH 7.4) continuously aerated with the aid of an electrical aerator. Medial jejuna/duodenum segments (∼4 cm) were used for the permeation studies. This segment was cut and washed six to eight times with Krebs Ringer solution, ligated with nylon thread at one end, and carefully everted on the glass rod. The everted gut sac, filled with 1 mL of Krebs Ringer solution and ligated, was placed inside the conical flask containing 20 mL of the test solution (10 mg/mL of CU-NE and CUS) continuously bubbled with atmospheric air at 13–19 bubbles per minute separately. The gut sac bath was surrounded by an outer water jacket to control the temperature of the bath at 37° ± 5 °C. The Krebs Ringer solution outside the sac was termed mucosal fluid, and the solution inside the sac was termed serosal fluid. The amount of CU permeated across the intestine in serosal fluid was determined using HPLC method after predetermined time period (0.5, 1, 1.5, 2 h).
Permeability coefficient (Papp) of CU was calculated from mucosal to serosal direction according to the equation:
where, the dQ/dt is the rate of drug permeation from the tissue, A is the cross-sectional area of the tissue, and Co is the initial CU concentration in the donor compartment at t = 0.
Oral bioavailability studies
Animals and dosing
All animal experiments were performed in accordance with committee for the purpose of control and supervision on experiments on animals (CPCSEA) guidelines. Wistar rats of either sex (200–250 g) were housed in polypropylene cages and kept on fasting with free access to water for 12–18 h before the experimentation. The routine animal handling was performed according to Good Laboratory Practices. The animals were divided into two groups, each having three Wistar rats. One group was orally administered CU suspension at a dose of 100 mg/kg, where as other group was orally administered NE at a CU dose of 50 mg/kg. The rats were anesthetized using ether, and blood samples (0.5 mL) were taken from the retro-orbital plexus at 0 (predose), 0.25, 0.5, 1, 2, 4, 8 and 12 h post administration. The samples were collected in microcentrifuge tubes which were first rinsed with EDTA followed by addition of small quantity (4–8 mg) of powdered EDTA to the tube. Blood collected was mixed with anticoagulant properly by shaking and then centrifuged at 10 000 rpm at 4 °C for 10 min and stored at −20 °C until processed and analyzed.
Sample preparation and bioanalytical method for CU quantification
The plasma samples 100 µL was transferred to a 2 mL eppendorf tube and 50 µL (200 ng/mL) of β-estradiol (IS) were added to it with thorough mixing. Then 250 µL of acetonitrile was added, vortexes for 1 min and centrifuged at 10 000 × g for 10 min. All supernatant was transferred to new 2 mL eppendorf tube, 20 µL of the supernatant was injected directly into the HPLC system for analysis. CU in plasma samples was quantified by a validated HPLC method in a range of 200–1500 ng/mL with a linearity of 0.9982. The analysis was carried out on a LiChrospher®C18 (150 mm × 4.6 mm i.d., 5-µm particle size; Merck, India) column fitted with guard column LiChroCART®. The mobile phase used was acetonitrile: 2.5% Acetic acid solution (75:25). The flow rate was 1 mL/min and the retention time was 3.8 min. The detection was performed at 420 nm. Internal standard was β-estradiol. The assays were performed at ambient temperature (25 ± 1 °C). Class VP (5.03 version) data acquisition software was used to process the chromatograms.
Assessment of intestinal transport of CU through lymphatic system
The rats were fasted over-night (12–18 h) with free access to water as described previously. The rats were treated with either an intraperitoneal injection of 3 mg/kg cycloheximide in saline (0.6 mg/mL) or with an equal volume of saline. The animals were divided into two groups, each having three Wistar rats. One hour after the injection, one group was orally administered CU suspension at a dose of 100 mg/kg, where as other group was orally administered NE at a CU dose of 50 mg/kg. The blood sample were collected and processed as described previously.
Pharmacokinetic parameters
Non-compartmental analysis was performed by using Microsoft Excel PK Function. The area under the plasma concentration–time curve (AUC0−12h) was calculated using linear trapezoidal method. The peak plasma concentration (Cmax) and the time to reach the peak plasma concentration (Tmax) were observed from the values of experimental data. The elimination rate constant (Kel) was determined by regression analysis from the slope of best fit, and half-life (t1/2) was computed by the formula
Relative bioavailability was calculated according to Equation
In vitro cell viability assays against glioblastoma cells (cytotoxicity studies)
In order to evaluate the therapeutic effectiveness of NE-SB1 in human cancer cell line, U 87, a human primary glioblastoma cell line was selected. The cytotoxicity studies were performed with both solutions and the NE formulation at different concentrations of CU. Solutions were prepared by dissolving the CU in DMSO and then adding them to culture medium to obtain the desired concentrations of CU (5 µM, 10 µM, 25 µM, 50 µM and 100 µM) and maintaining the DMSO at 0.1% concentration in the well. Similarly, NEs were also prepared at the above mentioned concentrations of CU in minimum essential medium (MEM). The U87 cells were allowed to adhere on the surface of 96-well microplates at a density of 5000 cells per well. After 48 h, when the cells in the wells were approximately confluent, the culture media was replaced with the solutions and NEs of CU separately. After dosing, the U87 cells were incubated at 37 °C for 48 h. Cells treated with MEM containing 0.1% DMSO and also cells treated with MEM containing blank NE formulation alone was used as negative controls in determining the cytotoxicity of solutions and NE formulation, respectively.
For the cytotoxicity study, the MTT reagent was prepared at a concentration of 1 mg/mL by dissolving the yellow dye (3-(4, 5-dimethylthiazol-2-yl)-2,5-diphenyltetrazolium bromide, a tetrazole dye) in MEM. Following a 2-d (48 h) incubation period, the media from each well was replaced with 50 µL of freshly prepared MTT reagent into each well and again incubated for 2 h in the CO2 chamber at 37 °C. Then 150 µL DMSO was added into each well to dissolve the insoluble purple-colored formazan crystals formed in the mitochondria of living cells. MTT gets reduced to purple formazan in living cells by mitochondrial reductase. This reduction takes place only when reductase enzymes are active, and therefore this conversion is used as a measure of viable (living) cells. The absorbance in each well was measured using a UV/Visible/fluorescence microplate reader at 570 nm. The percentage cell viability was calculated at each concentration of CU by dividing the absorbance of the treated cells over the control cells and multiplying it by one hundred. Then IC50 was determined for the solutions and NE on U87 cells.
Stability studies
NE was assessed for any change during storage at accelerated condition as per ICH guidelines Q1A (R2). NE-SB1 was subdivided into 5-mL glass vials, sealed and were stored upright. Physical and chemical stability of NE-SB1 were evaluated for 6 months by storing them at 40 ± 2 °C/75 ± 5% RH. Samples were withdrawn at specified time intervals (0, 1, 2, 3, 6 months) and assessed for remained CU content and globule size. The NE was also observed for physical evaluation such as turbidity, phase separation and drug precipitation.
Statistical analysis
All experiments were carried out in triplicate using freshly prepared samples. The results were expressed as averages and standard deviations of these measurements and statistical analysis was performed using Student’s t-test. Significant difference was regarded as p < 0.05, and very significant as p < 0.01.
Results and discussion
Formulation development and optimization
Screening of components
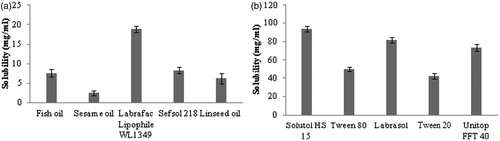
Oil represents one of the most important excipients in the NE formulation, which can solubilize sufficient amount of the lipophilic drug and help the NE to maintain the drug in solubilized form and allow for drug transportation to the target site. In the selection of surfactant safety assessment is an important criterion for selection. In this perspective, non-ionic surfactants are considered to be less toxic than ionic surfactants. They can also provide better stability to emulsion over a wider range of pH and ionic strength. The right blend of low and high HLB surfactant leads to the formation of a stable NE formulation (Kumar et al., Citation2012). The efficiency of a surfactant is usually determined by the amount of an amphiphile required to completely homogenize equal quantity of water and oil in order to avoid effects of domain curvature on the surfactant efficacy measurement. The surfactant type and concentration in the aqueous phase are chosen to provide good stability against coalescence, able to lower interfacial tension to a very small value to help in the dispersion process during the preparation of the NE, provide a flexible film that can readily deform around droplets and should be with appropriate lipophilic character to provide the correct curvature at the interfacial region for the desired NE type. Transient negative interfacial tension and fluid interfacial film is rarely achieved by the use of single surfactant, usually necessitating the addition of a co-surfactant. The presence of co-surfactant decreases the bending stress of interface and allows the interfacial film sufficient flexibility to take up different curvatures required to form NE over a wide range of composition (Kotta et al., Citation2012). Considering these facts the solubility of CU in different oils and surfactants was determined. After screening the oils and surfactants for CU solubility (), it was found that CU exhibited maximum solubility in Labrafac Lipophile WL 1349 (18.87 ± 0.82 mg/mL) oil and Solutol HS 15 (93.64 ± 2.92 mg/mL). Labrafac Lipophile WL 1349 is MCT which comprises glyceryl esters with predominantly saturated C8 (50–80%) and C10 (20–45%) fatty acids. MCT is a popular choice for use in lipid-based products because it is not subject to oxidation and promotes lymphatic transport of drug. For getting good NE region in ternary phase diagram, the miscibility of oil with surfactant and co-surfactant is important. Therefore, the miscibility of Labrafac Lipophile WL 1349 was performed with surfactants having good solubility and co-surfactants. On the basis of solubility and miscibility studies Solutol HS 15 and Transcutol HP were selected as surfactant and co-surfactant, respectively, for NEs development.
Figure 1. (a) Solubility of curcumin in different oils; (b) Solubility of curcumin in surfactants.
Process parameter optimization
Stirring speed
The effect of stirring speed on the formation of small droplets was investigated by preparing emulsion with fixed oil to Smix composition (1:9) at ambient temperature for less than 60 s. The formed emulsion of isotropic nature in such composition at different stirring speed was assessed by measuring transmittance after dilution. The decrease in turbidity or increase in transmittance is indicative of a decrease in light scattering by the droplets, which can be attributed to a reduction in their size when oil molecules moved from them into micelles. It was observed when stirring speed increased from 200 to 400 rpm, the transmittance increased from 73.41% to 94.43% which indicated very significant difference (p < 0.001). Meanwhile when the stirring speed was increased from 400 rpm to 1000 rpm, no significant difference (p > 0.05) was observed. So 400 rpm was selected as an optimum speed for NE formation.
Stirring time
Stirring time is another factor which influences the formation NE by providing more time for agitations which affect the spontaneous emulsification process. Effect of stirring time in the formation of emulsion at 400 rpm was assessed by measuring transmittance. It was observed when stirring time was increased from 30 s to 60 s, transmittance was also increased from 64.66% to 95.20% which indicated in the reduction of droplet size with time. But when the agitation was provided from 60 s to 120 s, there was no significant change (p > 0.05) was observed in transmittance which indicated there was no further reduction in globule size of emulsion. So 60 s was selected as optimum stirring time for NE formation.
Temperature
The temperature is an important parameter which effects in various ways to the formation of NE by spontaneous emulsification process. The excipients oil and Smix was heated to different temperatures prior to emulsion preparation. The emulsion was prepared by mixing oil and Smix at stirring speed of 400 rpm for 60 s, aqueous phase was adding it drop wise, which was maintained at ambient temperature (25 °C). It was observed that when temperature of excipients was increased from 20 °C to 40 °C there was a moderate increased in transmittance which indicated decrease in globule size with increasing holding temperature up to 40 °C. But when temperature was increased from 40 to 60 °C, there was decreased in transmittance. We recognized this apparently uncharacteristic behavior to changes in the size of globule with temperature causing changes in their light scattering efficiency.
Addition of oil and surfactant or Smix
Addition of surfactant to the oil or vice versa is important since it effects the formation of NE. The emulsion was prepared using oil and Smix in the ratio of 1:9 followed by addition of aqueous phase drop wise. In first approach the Smix was added drop wise to the oil phase followed by addition of aqueous phase and transmittance was fond to be 95.32%. In second approach when oil was added drop wise to the Smix phase followed by addition of aqueous transmittance was found to be 36.5%. So, for the preparation of pseudoternary phase diagram first approach was followed to get good NE area in the phase diagram.
Phase studies (construction of pseudo ternary phase diagram)
The phase behavior of NE system comprising of oil, water and Smix ratio was studied with the aid of pseudoternary phase diagram in which each corner of the diagram represents 100% of that particular component. The amount of aqueous phase added was varied to produce a water concentration in the range of 5% to 95% of total volume at around 5% intervals. Slow titration with the aqueous phase was performed for each combination of oil and Smix, separately. Care was taken to ensure that observations would not make on metastable system. The existence of NE region whether large or small depends on the solubilization characteristics of an emulsified oil phase in a surfactant micelle solution, can be characterized in terms of the solubilization kinetics and capacity. The solubilization kinetics is a measure of the rate at which oil molecules are transferred from NE droplets into micelles, whereas the solubilization capacity is a measure of the maximum amount of oil that can be incorporated into a given amount of surfactant (Rao & McClements, Citation2012). The area of NE isotropic region increased slightly as the ratio of surfactant in Smix was increased. In the phase diagrams (), the existence of large or small NE region depends on the capability of the particular Smix to solubilize the oil phase. Solubilization involves the transport of oil molecules from NE droplets to micelles, and therefore one would expect a change in the size of the various colloidal particles in the system: micelles should grow as oil is incorporated within them, whereas NE droplets should shrink as oil leaves them. The extent of solubilization results in a greater area with the formation of more clear solution. The area of NE isotropic region increased slightly as the ratio of surfactant in Smix was increased up to 2:1 concentration but on further increase in surfactant concentration, area decreased. In the phase diagrams (), it was observed that when Solutol HS 15 was used alone without co-surfactant, i.e. Smix ratio was 1:0, very low amount of oil (14% w/w) could be solubilized by using surfactant as high as 75% w/w. When co-surfactant was added and Smix ratio was 1:1, it was observed that 34% w/w of oil was solubilized but at higher percentage of Smix (55% w/w) by utilizing only 11% w/w water. When Smix ratio was 2:1, the NE region in the phase diagram increased significantly and the oil solubilized up to 35% w/w with the Smix concentration of 42% w/w. In Smix ratio of 3:1, it was observed that NE area decreased slightly as compared to 2:1 ratio and here also up to 35% w/w oil could be solubilized with a surfactant concentration of 46% w/w. There was no point in going for 4:1 Smix ratio which would have further resulted in decreased NE area. When the co-surfactant concentration was increased to 2 parts to 1 part of surfactant, the NE area increased as compared to 1:1 but it was less than 1:3 ratio and maximum amount of oil that could be solubilized was 30% w/w by utilizing higher concentration of Smix (60% v/v). This indicated no more role of co-surfactant in the formation of NE area. The rest of the region on the phase diagrams represented the turbid and conventional emulsion based on visual observation.
Figure 2. Pseudoternary phase diagram for optimization of NE.
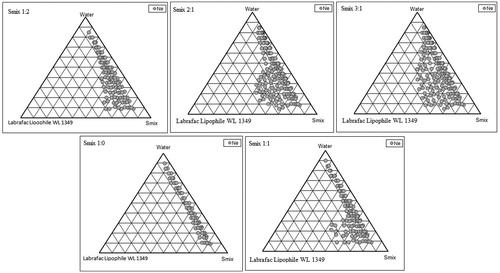
From the pseudoternary phase diagrams showing good NE area (1:2, 2:1 and 3:1), a number of NEs with different composition were selected. Almost entire range of NE occurrence in the phase diagrams were covered and different oil compositions with minimum surfactant and maximum water concentration showing NE existence were selected. The oil concentration was such that it dissolved the drug easily. From phase diagram having maximum NE area, different concentration of oil and Smix, which solubilized the maximum concentration of CU without precipitation on longer storage, was selected.
Physical stability studies
NEs are considered to be kinetically stable systems which are produced at a particular concentration of oil, surfactant/co-surfactant and water, with no phase separation, creaming or cracking. NE formulations selected from phase diagram () were subjected to stress stability testing such as centrifugation, freeze thaw cycle and heating cooling cycle. In physical stability testing some formulations became turbid and in some phase separation occurred. One reason of this instability in NE may be due to the Ostwald ripening in which molecules move as a monomer and coalescence of small droplets takes place, resulting in the formation of large droplets by diffusion processes driven by the gain in surface free energy. The other reason may be that when temperature quench occurs during stress stability study, instability of NE occurs due to separation of oil phase and droplet distribution of smaller size is favored by the change in curvature free energy (Wennerstrom & Olsson, Citation2009). Only those formulations, which showed no phase separation, creaming, cracking, coalescence and phase inversion during stress stability tests, were selected for further studies.
Table 1. NE formulations composition, physical stability and dispersion studies.
Formulation of CU-loaded nanoemulsion
For the formation of CU-loaded NE, first process of addition of drug was optimized then CU-loaded NE was developed.
Optimization of process of addition of drug
The drug-addition process in the formation of NE is very important since it have a major impact on its bioaccessibility of drug. In first approach CU (10 mg) was dissolved in oil phase with stirring followed by addition of Smix and aqueous phase. The obtained NE had transmittance of 97.46% and no precipitation of drug after centrifugation which indicated the complete internalization of CU in the oil phase. In the second approach, when the drug was added into the already formed NE, the transmittance 83.85% was obtained. The reduction in transmittance of the non-centrifuged NE was might be due to the undissolved crystal of CU. When the CU-loaded NE was subjected to centrifuged, the yellow sediment of CU was observed at the bottom of test tubes. So for the formation of NE the drug was solubilized in the oil phase then further processing was done to develop robust NEs.
CU-loaded nanoemulsion formulation
The NE formulations which passed physical stability test were subjected to CU loading (10 mg/mL). Further, it was observed that, incorporation of CU in the formulations had no effect on the phase behavior of NE. Drug-loaded NE formulations were investigated by conducting dispersibility studies.
Dispersibility studies
The drug and pH of dispersion medium may have considerable influences on the behavior of nanoemulsifying formulations. CU has a pH-dependent solubility and also has low solubility at lower pH such as pH 1.2. It was thought if the CU in NEs has possibility of precipitation at gastric pH in stomach it will precipitate during emulsification process. The efficiency of self-emulsification was assessed using USP 2 dissolution apparatus. NE systems form fine oil–water emulsions with only gentle agitations upon their introduction into aqueous media (0.1N HCl). Free energy of NE formation depends on the extent to which the surfactant lowers the surface tension of the oil–water interface and the change in dispersion entropy. Surfactants form a layer around the emulsion droplets and hence reduce the interfacial energy, as well as provide a mechanical barrier to coalescence. Some NE formulations failed during dispersion studies which might be due to, that formed NEs may have been coarse emulsions which on dilution became prone to coalescence as the lower internal pressure caused for significant deformation and made them vulnerability to rupture of the membranes surrounding the emulsion droplets, while finer emulsions acted as hard spheres. The NEs which formed clear transparent solution within 1 min were called as typical NE. The transparent solution was kept for 1 h in a beaker under static condition and was assessed for any precipitation of drug visually. The results of nano-emulsification encapsulating CU in SGF without enzyme are shown in . The formulations which passed the dispersibility test were subjected to further characterization.
Characterization of CU-loaded nanoemulsion
Globule size and zeta potential
The hydrodynamic diameter of globule and zeta potential are the most representative parameters in the control of NE stability. These parameters also affecting the in vivo fate of NE and also determines the rate and extent of drug release. It was observed that the ratio of oil to surfactant (O/S) affected the average droplet size of the NE formed. As the ratio decreased the globule size also decreased. It was also observed that when O/S ratio was constant then co-surfactant also have some role in the reduction of globule size (). This may be attributed to the fact that co-surfactant is responsible for the formation of flexible film which leads to stability in the NE system. The average globule size and polydispersity index of the formulation NE-SB1 was found to be 67 ± 6 nm () and 0.137 ± 0.01, respectively, indicating nanorange of droplets with minimum variation in globule size. Particles interact according to the magnitude of zeta potential and not their surface charge and therefore zeta potential can be used to predict dispersion stability of the system. Zeta potential for formulation NE-SB1 was −37 ± 2.5 mV which indicated good dispersion stability as it represents significant distance between charged particles in dispersion system. The increase in electrostatic repulsive forces between the globules prevents the coalescence of NE. On the contrary, decrease in electrostatic repulsive forces can cause phase separation.
Figure 3. (a) The globule size distribution of NE-SB1; (b) Surface morphology of NE-SB1by TEM; (c) Surface topography of NE-SB1 by AFM.
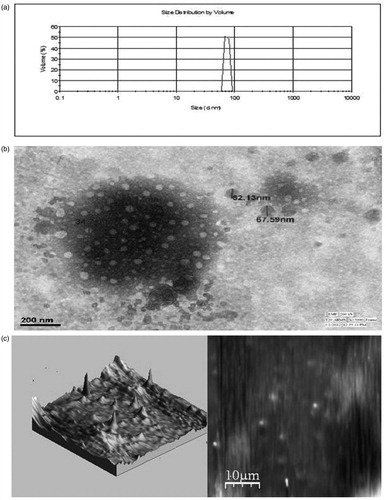
Table 2. Parameters of selected NE formulations.
Refractive index and viscosity of NE
Refractive index of NE formulations indicates isotropic nature of formulation and basically signifies the chemical interaction among drug and excipients. No significant difference (p > 0.05) in the refractive index of placebo and drug-loaded NE () was observed so it was concluded that the NE formulations were chemically stable and remained isotropic in nature thus showing no interaction between excipient and drug. Viscosity studies are necessary for NE to characterize the system physically and to control its stability. The viscosities of optimized formulations were presented in the .
Robustness to dilution
It is important to ensure that uniform globules are formed from self-emulsification of NE at different dilutions. Also, dilution may affect drug release profile and the drug may get precipitated at higher dilutions “in vivo”, which may significantly retard its absorption. Hence, robustness to dilution was monitored by diluting the NE to 50, 100, 250 and 1000 times with distilled water and transmittance were observed for the NEs. In dilution all NEs formed clear NE with no precipitation of drug and no significant difference (p > 0.05) in transmittance from 250 to 1000 times dilution were observed which indicated the robustness of the NEs. This also indicated the probability of uniform drug release profile “in vivo” where the formulation is expected to encounter gradual dilution.
Centrifugation test
Centrifugation test was performed to assess the precipitation of drug after dilution which indicated the precipitation of drug in vivo. All the NEs passed the centrifugation test. Neither phase separation nor any precipitation was observed upon centrifugation, indicated the stability of the NE.
Solubility characteristic
One of the main factors determining the efficacy of a delivery system is the maximum amount of bioactive component that can be successfully solubilized within it. Below this saturation level the bioactive component is fully solubilized, but above this level it may form a separate solid phase, i.e. a dispersed or amorphous phase. The maximum amount of CU that could successfully be incorporated into the NE at ambient storage temperatures was determined using HPLC method. Measurements of the turbidity of non-centrifuged samples were used to determine the presence of non-dissolved (dispersed) CU, whereas measurements of the absorbance of centrifuged samples (to remove any dispersed particles) were used to determine the concentration of dissolved CU. The amount of CU (10, 20, 40, 60 and 100 mg) was dissolved in oil phase and NE was developed by using optimized procedure and diluted to 10 times with distilled water. Transmittance for the drug loaded from 10 mg to 60 mg was almost 100% but when 100 mg/mL drug was loaded in NE-SB1 transmittance was found to be 81.26 ± 2.1% which indicated the presence of crystalline CU in the NE. The entrapment efficiency of NE was found in the range of 99–64%. The entrapment efficiency of NE containing 100 mg/mL of CU was found to be 64.29% which indicated remained amount of drug precipitated at the bottom of test tube.
Surface morphology by transmission electron microscopy
The morphology of the diluted (500 times) CU-loaded NE-SB1 formulation was observed using TEM to get more insight about the morphology of the NE systems. NE consists of discrete, spherical oil globules with diameters ranging from 20 nm to 80 nm () and appeared dark with bright surrounding which was in accordance to the findings using Malvern Zetasizer. As the oil globules were discrete and non-aggregated, it can be stated that the NE was physically stable.
Surface topography by atomic force microscopy
For a precise determination of single particle or globule dimensions, microscopic techniques such as AFM are commonly used for three dimensional imaging. This technique does not require a specific sample preparation and can be performed easily without any contamination. The globule size of NE formulation SB1 under AFM observation was found to be less than 100 nm () which also confirmed result obtained during TEM and DLS studies.
Stability of CU-loaded NE in phosphate buffer (pH 6.8)
It was reported that most of the CU (>90%) is rapidly degraded within 30 min of placement in PBS at pH 7.2 (Kumar et al., 2010; Tonnesen et al., 1985; Zsila et al., 2003). The stability of CU was increased when it was loaded in NE. The assay of CU in NE after 4, 8 and 24 h storage in phosphate buffer (pH 6.8) was found to be 99.1 ± 5.4, 97.6 ± 3.6 and 95.4 ± 42%, respectively. These data indicated the stability of CU in NE which might be due to the encapsulation of CU inside oil globules. The encapsulation of CU inside oil globule may prevent the contact of CU with the phosphate buffer (pH 6.8) which leads to the increased stability of CU in NE.
In vitro release study
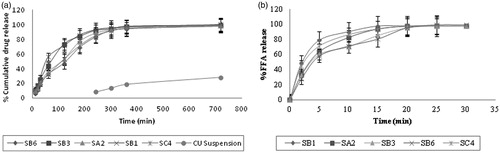
In vitro release experiments in 0.1N HCl were done to evaluate the effect of NE formulations (NE-SA2, NE-SB1, NE-SB3, NE-SB6 and NE-SC4) on drug solubility/release. A very significant (p < 0.001) increase in percentage drug release was achieved in the case of NE as compared to CU suspension. In CU suspension the drug was not released even up to a detectable level in the 180 min (3 h) and drug precipitation was observed in the dialysis bag. After 3 h the CU released up to a detectable level and 21.7 ± 1.57% CU release was observed till 12 h. The concentration was determined by extrapolation of calibration curve and graph was plotted between time and percentage cumulative release. The highest release 84.9 ± 1.8% at 180 min (3 h) and 100.5 ± 1.4% at 720 min (12 h) of CU was obtained in case of SB1. A minimum release 70.1 ± 1.8% was observed in SB6 formulation at 180 min, due to bigger globule size, which might have slowed down the release of the drug from NE formulation. All the NE formulations showed better results as compared to CU suspension because of small globule size and existence of CU in molecular level in the form of NE. The complete dissolution of CU in oily phase showed maximum release because of small droplet size, and eventually higher surface area, which allowed faster rate of drug release.
Ex vivo release study
Curcumin permeation form NE and CU suspension was investigated using the small intestine of rat as a diffusional barrier. It was found that formulation SB1 showed 85.8 ± 2.95% and 100.3 ± 4.89% drug release at 3 h and 12 h, respectively, as compared to 28.2 ± 1.73% release at 12 h from CU suspension (). Moreover at 180 min the release from CU suspension was not detectable. Hence, availability of CU at the molecular level in the form of nanosized emulsion droplets has a remarkable enhancing potential on drug release from NE. The pattern of drug release in simulated gastric fluid and intestinal fluid was found very similar to each other in all NE formulations. It was further observed that as the droplet size decreased the permeation of drug increased. Thus, NE provides a larger surface area available for partitioning of the drug across the intestinal membrane.
Figure 4. (a) Ex vivo release profile of CU in phosphate buffer (pH 6.8); (b) % FFA release profile with time.
In vitro digestion (in vitro lipolysis)
There is increasing interest in understanding and controlling the digestibility of emulsified lipids within the human GI tract. This knowledge is being used by the pharmaceutical industry to develop lipid-based delivery systems that deliver drugs to specific locations within the GI tract. In vitro digestion models are increasingly being used to assess the performance of lipid-based formulations (LBF) under conditions that mimic lipid digestion in the small intestine. Digested lipids are solubilized in the lumen of the intestine by at least two types of particles: bile salt micelles and unilamellar vesicles that are composed mainly of phospholipids. These particles deliver digested lipids to the aqueous-enterocyte membrane interface and the lipid molecules are subsequently absorbed either by passive diffusion through the phospholipid bilayer of the enterocyte plasma membrane or by active transport involving specific proteins in the enterocyte brush border membrane (McClements et al Citation2009; Singh et al., Citation2009). We had evaluated the in vitro digestibility of the NE by lipase to obtain a better understanding of their potential behavior under GI conditions. pH-stat method is designed to simulate lipid digestion within the small intestine (where the majority of lipid digestion normally occurs), and is based on measurements of the amount of FFA released from lipids (usually triacylglycerols) after lipase addition at pH values close to neutral. Lipid digestion is an interfacial phenomenon that involves adsorption of lipase molecules to lipid droplet surfaces so that the enzyme can come into close proximity with its substrate (triacylglycerols) (Li et al., 2011; McClements & Li, 2010). In experimentation, it was observed that lipolysis process depends on the size of the globule. The rate of FFA released () per unit time (FFA% min−1) in the digestion period increased with decreasing oil droplet diameter. As the droplet size decreases, the interfacial area increases, and therefore there will be less free Solutol HS 15 present in the aqueous phase to compete with bile salt or lipase adsorption. The NE contains medium chain triglyceride which was easily digested within 15 min and released almost all FFA. The globule size distribution of NE may be an important parameter in determining their behavior because the activity of lipolytic enzymes is highly dependent on the properties of the substrate water interface.
Determination of curcumin content in the aqueous phase (bioaccessibility)
Following oral administration, dissolution of the drug molecule in the intestinal tract is a prerequisite for the absorption process. The drug molecules solubilized in the aqueous phase of the lipolysis medium are thought to be available for absorption, in contrast to drug in the sediment which will not be available for absorption in in vivo conditions. After the completion of the lipolysis process, the experimental medium is ultracentrifuged, and a two-phase separation is obtained: (1) an aqueous phase, containing bile salts, fatty acids and MG; (2) sediment, containing un-dissolved fatty acids. The aqueous phase was analyzed for drug content. The lipid based formulation using medium chain triglycerides were digested completely producing a dispersed aqueous phase that was capable of supporting supersaturated drug concentrations. The lipolysis process throughout time influences dissolution of CU in the aqueous phase, more than 90% of the CU was available in the aqueous dispersed phase which will be available for the absorption. The rate of appearance of CU also depends on the globule size of the NE as reflected in the formulation NE-SB1 in which more than 90% drug is available in the aqueous phase in 10 min.
Ex vivo everted gut sac method
The everted gut sac model has been extensively explored to carry out pharmacokinetic investigations such as drug absorption, drug inter-actions, drug metabolism or prodrug conversion in GI segments, efflux transport and the impact of efflux transport modulators on the absorption of drugs (Takahashi et al., Citation2009). A CU-loaded NE (NE-SB1) produced a Papp up to 4.36 × 10⁻⁵ cm/s with flux of 0.436 μg/cm2/h at 120 min, where as drug suspension has 0.488 × 10⁻⁵ cm/s with flux of 0.0488 μg/cm2/h. The permeability result indicated that CU in suspension form was poorly permeated across the intestinal membrane since CU is not available in the soluble form in the donor compartment. But when CU loaded in the NE, the globule size significantly decreased and CU easily solubilized in the donor compartment and simply permeated from the intestinal membrane. This indicated that the absorption of CU occurred within the oil globule. The permeability of CU from NE was found to be significantly higher (∼9 times) when compared to drug suspension.
Bioavailability studies
The observations of the dissolution properties of CU-loaded NE formulations encouraged to clarify the possible improvement in the bioavailability of CU by the assessment of the pharmacokinetic behaviors of CU-loaded NE formulations in rats. The profile of the plasma concentration of CU versus time after the oral administration of CU-loaded NE are depicted in . The corresponding pharmacokinetic parameters for these two groups are shown in . The experimental results showed a significant difference (p < 0.05) occurred between the pharmacokinetic profile of CU-loaded NE and that of free CU suspension. At each time point, the plasma concentration of CU from NE was significantly (p < 0.05) much higher than that from free CU suspension. Oral administration of CU-loaded NE (50 mg/kg) resulted in a rapid elevation of CU blood levels up to Cmax 803 ± 24.06 ng/mL within 30 min and the AUC0−inf value was calculated to be 1027.86 ± 30.76 ng/mL h. The plasma concentration of CU decreased rapidly with elimination half-life of 1.77 ± 0.06 h. The relative bioavailability of CU is 11.88 ± 0.47. While in case of CU suspension (100 mg/kg) Cmax was found to be 126 ± 13.56 ng/mL at 1.0 h and the AUC0−inf value was found to be 173.01 ± 18.5 ng/mL h. The CU concentration was not able to detect in blood after 2 h which indicated rapid elimination of CU with elimination half-life of 1.17 h. These result revealed that formulation of CU as NE results in a significantly increased absorption of CU, compared with that from the aqueous suspension. The improved absorption of CU was probably due to the enhanced solubilization of CU due to the small droplet size of less than 100 nm of oil in water NE.
Figure 5. Plasma concentration-time profile of curcumin after oral administration of NE-SB1 (50 mg/kg) to rats. Each data point represents the mean ± S.D. of three determinations.
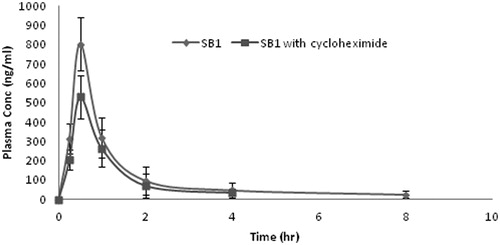
Table 3. Pharmacokinetic parameters after oral administration of CU formulations to rats.
Lymphatic transport is a post-absorption happening and the fraction of drug transported through the mesenteric lymphatic are not subjected to hepatic first-pass metabolism. The feasibility of lymphatic transport of CU from NE was assessed using cycloheximide model. Intraperitoneal administration of the protein synthesis inhibitor cycloheximide has been shown to affect the lipid absorption in vivo. Although the protein moiety of the chylomicron is very small (1–2%), this component is essential for the synthesis and movement of this lipoprotein out of the enterocyte by lymphatic system. In the present study, when formation of chylomicron was inhibited, the plasma level of CU at each time point was reduced. The comparisons of pharmacokinetic parameters were given in the . The AUC0−inf and Cmax and was found to be 802.73 ± 26.02 ng/mL h, 549 ± 16.96 ng/mL, respectively. These parameters indicated that after inhibiting the chylomicron formation the AUC0−inf and Cmax was reduced approximately 20% and 30%, respectively, which revealed contribution of lymphatic transport of CU. The elimination half-life was reduced from 1.77 ± 0.06 h to 1.68 ± 0.05 h which indicated the more elimination of CU from the blood. Generally, CU undergoes extensive metabolism, mainly conjugation reaction like sulfation and glucuronidation in the liver and intestinal wall. So, rapid systemic elimination of CU was attributed to the rapid metabolism. The medium chain triglycerides used in the formulation is probably protecting the drug from enzymatic degradation. Non-ionic surfactant present in the formulation not only improved the solubility and dissolution of the CU but may also reduce the interfacial tension and enhance permeation of the drug through the epithelial cells.
In vitro cell viability assays against glioblastoma cells (cytotoxicity studies)
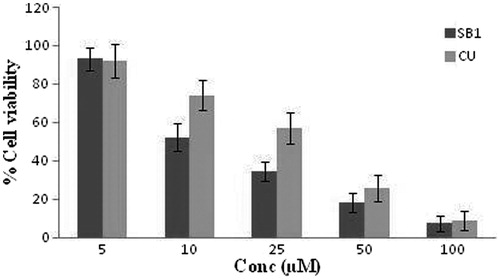
The cytotoxicity experiments were carried out with both solutions and NE formulations (NE-SB1). Cells treated with equivalent amounts of DMSO or placebo NE (no CU) were used as controls for CU and CU-loaded NE, respectively. It was observed that with CU solution and CU-loaded NE (NE-SB1), the anti-proliferative activity increased dose dependently. At the lowest dose (5 µM), no significant difference in activity was observed in CU solution and NE formulation (NE-SB1). However, at the concentrations of 10 µM and above, significant difference (p < 0.05) was observed in cell viability between NE formulations with respect to CU solution. At 10 µM dose, the cell viability was 74.2 ± 8.1% () for CU solution while for formulation NE-SB1 it was 52.2 ± 6.9%. IC50 (concentration of drug required to kill 50% of cells) values were determined and the efficiency of NE-SB1 formulation over solutions was evaluated. IC50 of CU solution alone when administered on U87 cells was found 24.23 µM, while for the NE- SB1 it was 16.41 µM. These result indicated that NE- SB1 formulation was easily taken up by cancerous cell when compared with solution which was due to smaller size of globule.
Figure 6. Anti-proliferative activity study of CU solution and NE-SB1 formulation.
Stability studies
In liquid state, there is a potential for phase separation or precipitation of drug substance to occur with time. Therefore, the CU-loaded NE (NE-SB1) was monitored closely for any occurrence of phase separation, precipitation and globule size during the stability period (6 months). The NE appeared as transparent, homogenous liquids without any signs of phase separation and drug precipitation (). The average globules size of NE-SB1 at the end of 6 months was found 105 ± 9.15 nm with transmittance of 98.01 ± 0.39. No significant changes were observed in drug content in the NE formulation up to 6 months. This indicated the long-term stability of CU-loaded NE.
Table 4. Accelerated stability studies observation of NE-SB1 formulation.
Conclusion
In the current investigation, NE formulation of CU was proposed for increasing its bioavailability by lymphatic transport. NEs containing CU were successfully formulated by aqueous titration method. The developed NE formulations were evaluated for surface morphology by TEM, in vitro and ex vivo release, in vitro lipolysis studies followed by lymphatic absorption and cytotoxicity against glioma cells. TEM studies demonstrated the spherical shape of the globule in the system. The drug release studies revealed higher and uniform release of CU from NE. The results of ex vivo studies showed enhanced absorption of the drug from the intestine with NE as compared to plain drug suspension. The in vitro lipolysis study showed the effect of globule size in the release of FFA and CU. The developed NE formulation also favor for lymphatic transport of drug, which enhanced the relative bioavailability of CU by 11.88. The CU and CU-loaded NE showed good cytotoxic result against glioblastoma cells which indicated the effectiveness of CU. The CU-loaded NE was found to be physically and chemically stable for 6 months under accelerated condition. Thus, it can be inferred that physico-chemically stable CU-loaded NE have the potential to improve the permeability of CU, reduce pH-dependent variability in its absorption and consequently increased its oral bioavailability.
Declaration of interest
The authors report no conflicts of interest. The authors alone are responsible for the content and writing of this article.
Acknowledgements
The authors are thankful to University Grant Commission (UGC), Government of India for providing financial assistance to this project. The authors are also grateful to AIIMS, Delhi, India for providing facility to conduct TEM analysis of NE formulations. The authors are also thankful to Gattefose, India for providing oil, surfactant and co-surfactant as a gift sample.
References
- Aggarwal BB, Surh YJ, Shishodia S. (2007). The molecular target and therapeutic uses of curcumin in health and disease. Advances in experimental medicine and biology series, Vol. 595. : Springer, 1–66
- Amiji MM. (2007). Nanotechnology for cancer therapy. : CRC Press. Taylor and Francis, Chapter 35 (723–40)
- Bartik L, Whitfield GK, Kaczmarska M, et al. (2010). Curcumin: a novel nutritionally derived ligand of the vitamin D receptor with implications for colon cancer chemoprevention. J Nutr Biochem 21:1153–61
- Cui J, Yu B, Zhao Y, et al. (2009). Enhancement of oral absorption of curcumin by self-microemulsifying drug delivery systems. Int J Pharm 371:148–55
- Dahan A, Hoffman A. (2007). The effect of different lipid based formulations on the oral absorption of lipophilic drugs: the ability of in vitro lipolysis and consecutive ex vivo intestinal permeability data to predict in vivo bioavailability in rats. Eur J Pharm Biopharm 67:96–105
- Das RK, Kasoju N, Bora U. (2010). Encapsulation of curcumin in alginate-chitosan-pluronic composite nanoparticles for delivery to cancer cells. Nanomedicine 6:153–60
- Duvoix RB, Delhalle S, Schnekenburger M, et al. (2005). Chemopreventive and therapeutic effects of curcumin. Cancer Lett 223:181–90
- Hu L, Jia Y, Niu F, et al. (2012). Preparation and enhancement of oral bioavailability of curcumin using microemulsions vehicle. J Agric Food Chem 60:7137–41
- Huang Y, Qiaomei RU. (2010). Bioavailability and delivery of nutraceuticals using nanotechnology. J Food Sci 75:R51–7
- Kakkar V, Singh S, Singla D, Kaur IP. (2011). Exploring solid lipid nanoparticles to enhance the oral bioavailability of curcumin. Mol Nutr Food Res 55:495–503
- Kashif A, Yan Li, McClements DJ, Xiao H. (2012). Nanoemulsion and emulsion-based delivery systems for curcumin: encapsulation and release properties. Food Chem 132:799–807
- Kotta S, Khan AW, Pramod K, et al. (2012). Exploring oral nanoemulsions for bioavailability enhancement of poorly water-soluble drugs. Expert Opin Drug Deliv 9:585–98
- Kumar A, Ahuja A, Ali J, Baboota S. (2010). Conundrum and therapeutic potential of curcumin in drug delivery. Crit Rev Ther Drug Carrier Syst 27:279–320
- Kumar A, Ahuja A, Ali J, Baboota S. (2012). Curcumin loaded nano globules for solubility Enhancement: preparation, characterization and ex vivo release study. J Nano Nanotech 12:8293–302
- Li Y, Hu D, McClements DJ. (2011). Factors affecting lipase digestibility of emulsified lipids using an in vitro digestion model: proposal for a standardised pH-stat method. Food Chem 126:498–505
- Li Y, McClements DJ. (2010). New mathematical model for interpreting pH-Stat digestion profiles: impact of lipid droplet characteristics on in vitro digestibility. J Agric Food Chem 58:8085–92
- Maiti K, Mukherjee K, Gantait A. (2007). Curcumin - phospholipid complex: preparation, therapeutic evaluation and pharmacokinetic study in rats. Int J Pharm 330:155–63
- McClements DJ, Decker EA, Park Y. (2009). Controlling lipid bioavailability through physicochemical and structural approaches. Critical Re Food Sci Nut 49:48–67
- Onoue S, Takahashi H, Kawabata Y, et al. (2010). Formulation design and photochemical studies on nanocrystal solid dispersion of curcumin with improved oral bioavailability. J Pharm Sci 99:1871–81
- Rao J, McClements MD. (2012). Lemon oil solubilization in mixed surfactant solutions: rationalizing microemulsion & nanoemulsion formation. Food Hydrocolloids 26:268–76
- Santos IS, Ponte BM, Boonme P, et al. (2013). Nanoencapsulation of polyphenols for protective effect against colon–rectal cancer. Biotechnol Adv 31:514–23
- Singh H, Aiqian Y, David H. (2009). Structuring food emulsions in the gastrointestinal tract to modify lipid digestion. Prog Lipid Res 48:92–100
- Takahashi M, Uechi S, Takara K, et al. (2009). Evaluation of an oral carrier system in rats: bioavailability and antioxidant properties of liposome-encapsulated curcumin. J Agric Food Chem 57:9141–9
- Tonnesen HH, Karlsen J. (1985). Studies on curcumin and curcuminoids. VI. Kinetics of curcumin degradation in aqueous solution. Z Lebensm Unters Forsch 180:402–4
- Verma B, Hucl P, Chibbar RN. (2009). Phenolic acid composition and antioxidant capacity of acid and alkali hydrolysed wheat bran fractions. Food Chem 116:947–54
- Wennerstrom H, Olsson U. (2009). Microemulsion as model systems. CR Chimie 12:4–17
- Williams HD, Anby MU, Sassene PJ, et al. (2012). Toward the establishment of standardized in vitro tests for lipid based formulations, part 2: the effect of bile salt concentration and drug loading on the performance of Type I, II, IIIA, IIIB and IV formulations during in vitro digestion Method parameterization and comparison of in vitro digestion profiles across a range of representative formulations. Mol Pharm 9:3286–300
- Zengshuan M, Shayeganpour A, Brocks DR, et al. (2007). High-performance liquid chromatography analysis of curcumin in rat plasma: application to pharmacokinetics of polymeric micellar formulation of curcumin. Biomed Chromatogr 21:546–52
- Zsila F, Bikádi Z, Simonyi M. (2003). Molecular basis of the cotton effects induced by the binding of curcumin to human serum albumin. Tetrahedron Asymmetr 14:2433–44