
Abstract
In roll compaction, the specific compaction force, the gap width and the roll speed are the most important settings as they have a high impact in the products obtained. However the mechanical properties of the mixture being compacted are also critical. For this reason, a multilevel full factorial design including these parameters as factors plus three repetitions of the center point was performed for microcrystalline cellulose, mannitol and five binary mixtures (15, 30, 50, 70 and 85% MCC). These two reference excipients were chosen in order to investigate the plastic/brittle behavior of mixtures for the roll compaction process. These materials were roll compacted in a 3-W-Polygran® 250/50/3 (Gerteis) and the ribbons obtained were collected and milled into granules which were characterized regarding granule size distribution. After statistical evaluation, it was found that the most critical factors affecting the D10, D50, D90 and the fines fraction from the granules were the gap width and the specific compaction force, as well as the proportion of MCC together with its quadratic effect and the interaction between force and proportion of MCC. The microhardness of the ribbons from the center point as well as the D10, D50, D90 and the fines fraction from the granules produced at these same conditions were characterized. In all the cases, the proportion of MCC, i.e. the composition of the mixture, showed also an important effect on these properties measured. In this sense, the percolation theory was applied in order to study further the importance of the plastic/brittle ratio by calculating the percolation threshold or the limit over which the behavior of the system changes. This resulted in values of 34% for the HU (expression of microhardness), 27% and 28% for the D10 and fines, respectively (percolation of MCC) and 84% and 85% for the D50 and D90, respectively (percolation of mannitol).
Introduction
Most of the drugs used in the pharmaceutical industry are not suitable for direct compression and therefore a granulation process is previously required in order to successfully accomplish the tableting process. Roll compaction/dry granulation is a continuous process, in which powder is being compacted while passing through two counter-rotating rolls obtaining a densified ribbon, which is subsequently milled in order to produce granules that can be later compressed into tablets. The roll compaction process is not completely understood and many parameters, configurations and process conditions can be changed in order to obtain different properties of their final and intermediate products as it has been already investigated and shown in the literatureCitation1–3. In particular, several studies have been performed in order to evaluate how the properties of the granules are affected by the roll compaction settingsCitation4–8 for different formulations and in order to prepare diverse final products. However, another critical aspect that has a high impact in the roll compaction process is the properties of the material which is being compacted.
Microcrystalline cellulose (MCC) and mannitol are two excipients widely used in the pharmaceutical industry due to their beneficial properties and numerous applications, although normally both are used as diluentsCitation9,Citation10. However, these materials present different behavior against compression. MCC is a material that principally suffers plastic deformation while mannitol is a typical brittle materialCitation11. These two opposed behaviors, together with their high presence in the pharmaceutical industry, make these two materials interesting to develop a study. Several authors have investigated how the roll compaction of MCCCitation1,Citation12–14 and mannitolCitation15,Citation16 affects the granule properties. Nevertheless, all these studies focused on one of these excipients either as pure material or as a mixture with other powders.
Several authors have also investigated the importance of the mixture composition and their mechanical properties on the roll compaction process by studying several properties of the ribbons, granules and mostly tabletsCitation13,Citation15,Citation17–21. Some of these studies have been done in order to understand the impact of a plastic/brittle-material mixture in roll compactionCitation16–18,Citation20,Citation21, but most of the work is focused on the tablet characterization. Malkowska et al.Citation17 already observed different behavior for the plastic/brittle mixture (consisting in MCC and dicalcium phosphate dehydrate) than for the pure materials in the re-working potential. Freitag et al.Citation18 studied the plastic/brittle interaction by using mixtures containing magnesium carbonate and powdered cellulose (PC) of different particle sizes. The ranges used were 0, 5, 10, 15, 20 and 25% of PC. After roll compacting these mixtures, they concluded that when using the PC type with the smaller particle size, more fines and smaller mean size are obtained. The higher proportion of bigger granules and the lower amount of fines were obtained when using smaller proportion of PC in the mixture. Pérez Gandarillas et al.Citation21 investigated the properties of another plastic/brittle mixture consisting of MCC and lactose in proportions of 25, 50 and 75% of MCC. Regarding granule properties, no great differences on the granule size distribution (GSD) were found.
Binary mixtures can be described using the percolation theoryCitation22–24, which basically refers to the interaction between the elements of a system. This theory addresses the formation of clusters inside a lattice, which can connect and affect the behavior of the system. Those clusters can be either a single particle or a group thereof adjacent, and they can be finite if they are isolated or infinite if they are connected. This change from finite to infinite clusters affects the behavior of the system and is determined by the percolation threshold or critical concentration. From the pharmaceutical point of view, this theory can refer to the interaction between the powders forming part of a binary mixture. It is possible to apply the percolation theory, if the system is well defined by a lattice. When a powder A and a powder B are mixed, the particles of both form a lattice by random occupation resulting in the formation of clusters. At low concentrations of A, the particles of this material will form finite or isolated clusters inside a matrix of B but once the percolation threshold is overcome, the particles of A will form an infinite cluster affecting the behavior of this whole mixture. For a binary mixture, two percolation thresholds can be defined: a lower threshold where one of the components starts to percolate (form an infinite cluster) and an upper threshold where the other powder stops to have an infinitive clusterCitation24. However, in occasions, only one percolation threshold can be visualized as shown in Blattner et al.’s workCitation23. They applied the percolation theory to study the properties of tablets prepared from a mixture formed of a hard and brittle material (α-lactose) in three different sieve fractions and a plastic and soft substance (Polyethyleneglycol or PEG 10 000). They concluded that the percolation threshold is a function of the geometrical packaging which depends on the particle size, particle size distribution and the shape of the particles. The percolation theory has been mostly applied for studying matrix systems (generally tablets) in order to design the best formulation regarding drug release and tablets disintegrationCitation25–31. However, not much work applying the percolation theory in roll compaction has been reported on the literatureCitation32,Citation33.
Therefore, the objective of this work is to investigate the impact of the properties of a plastic/brittle-material mixture roll compacted under different conditions in the properties of the out-coming products. For this purpose, the percolation theory has been applied in order to study the interactions between a typical plastic material, a characteristic brittle one and five mixtures thereof. With this intention, ribbons and granules from MCC, mannitol and their five combinations of 15, 30, 50, 70 and 85% MCC were produced according to a design of experiments (DOE) consisting of a full factorial design including the gap width, roll speed and the specific compaction force as factors.
Experimental method
Design of experiments
DOE was used to investigate the behavior of the two materials and their combinations under different conditions of roll compaction as it has been proved to be a useful tool for the study of the roll compaction processCitation8. The same DOE was performed for all mixtures but following different randomization orders. A multilevel full factorial design consisting of two factors in two levels, one factor in five levels and three repetitions of the center point, which means a total of 23 batches, is proposed and presented in . The factors considered are the gap width, roll speed and specific compaction force, and this latter one, due to its importance, is investigated in five levels. Taking all mixtures into account, a new factor, percentage of MCC was added with the purpose of building a unique and more informative DOE, which summarizes all data. All the statistical evaluations of the DOEs were performed in Modde 9.0 (Umetrics, Malmö, Sweden).
Table 1. Description of the DOE performed with the different factors and levels.
Preparation of mixtures
A total of five mixtures were prepared for performing the DOEs. MCC (Avicel® PH 101, FMC Bio Polymer, Philadelphia, PA, Lot 61333C, container 20781, and Lot 61351C, containers 20598 and 20999) and mannitol (Pearlitol® 200 SD, Roquette, France, Lot E355G, containers 0595, 0597, 0599 and 0600; and Lot E884G, container 0422) were kindly provided by Bayer Pharma AG (Berlin, Germany) and were used as pure materials and the elaboration of the mixtures were performed by following a mixing–sieving–mixing process. A lubricant was not added, as it can drastically affect the processCitation14,Citation34 and the idea behind this study is to understand the powder behavior.
The specified amounts of powder were weighted using a ground balance (Mettler ID5 MultiRange, Mettler Toledo, Germany) and mixed in the drum hoop mixer Rhönrad (RRM 100, J. Engelsmann AG, Ludwigshafen, Germany) which is equipped with the motor Sew-Eurodrive (RF40DT80K4BMG/TF, Germany). The mixer was set at 29 rpm for 10 min. Afterwards, the powder was sieved in a Frewitt mill (GLV ORV, Frewitt, Switzerland) using a 1 mm mesh sieve and the speed chosen was 154 rpm (velocity number 5) in the oscillation mode. When all the powder has passed through the sieve, the mixing process was repeated under the same conditions.
Roll compaction and granulation
MCC, mannitol and their mixtures were roll compacted in a Gerteis roll compactor 3-W-Polygran® 250/50/3 (Gerteis Machinen +Processengineering AG, Rapperswil-Jona, Switzerland) using knurled rolls and cheek plates or long side sealing system. The feeding was carried out by the feeding auger (FA) and the tamping auger (TA), and the roll position, as characterized by the Gerteis roll compactors, is inclined. The different production parameters were changed according to the DOE described above, as well as the FA and TA speeds (ratio between themselves 1:3.5), which were automatically adapted in order to reach the desired gap size by the gap control. During the compaction no vacuum was used. The temperature and relative humidity (RH) were measured for every batch using a humidity and temperature indicator (Hygromer® A2, Rotronic, Germany) after 5–10 min of equilibration time, as the humidity plays an important role in the roll compaction process, especially when working with hygroscopic materials.
Once the roll compaction started, only when the steady-state conditions were achieved, a minimum of 800 g of ribbons was collected. Approximately 300 g of the ribbons collected was milled in a Frewitt sieving machine (GLA ORV 0215, Frewitt, Granges-Paccot, Switzerland) under standard conditions. Several authors have reported that the characteristics of the granules milled under similar conditions are an extrapolation of the properties of the ribbonsCitation35,Citation36 as changing them and the machine can drastically affect the properties of the granules obtainedCitation37. This mill was assembled with a 1 mm mesh sieve and the speed, in oscillation mode, was set at 154 rpm. The ribbons were milled following the same randomization order as for their production and the sieve machine was cleaned between each batch with a vacuum cleaner for minimizing inter-batch contamination. The samples were kept in a climate room under 21 °C and 45% RH at least 24 h before performing any characterization.
Characterization of ribbons: microhardness
The hardness of the microstructure was measured using a commercial microindenter (Fischerscope Hm 2000 Microhardness System, Helmut Fischer GmbH, Sindelfingen, Germany) built with a ball indenter of 0.4 mm diameter. This metal piece consists of a ball which penetrates the surface of the ribbon until a predetermined force is achieved during a particular time. For this experiment, the force was linearly increased to 1000 mN (1 N) during 20 s followed by 5 s of loading. The universal microhardness (HU) and the maximal height (hmax) were obtained. The HU for the ball indenter is defined by the following equation (N/mm2):
(1)
where Fmax is the maximal force applied (which in this case is constant, 1 N), r is the radius of the ball that is 0.2 mm for the indenter used (although this value can slightly change based on the penetration area) and hmax.corr which represents the depth reached inside the ribbon, considering its surface as starting point, and it is obtained at the end of the 5 s of loading. A correction was performed in order to avoid some errors occurred during measuring. As a result, it was decided to subtract the height reached at 10 mN force from the original hmax and, hence, hmax.corr was obtained.
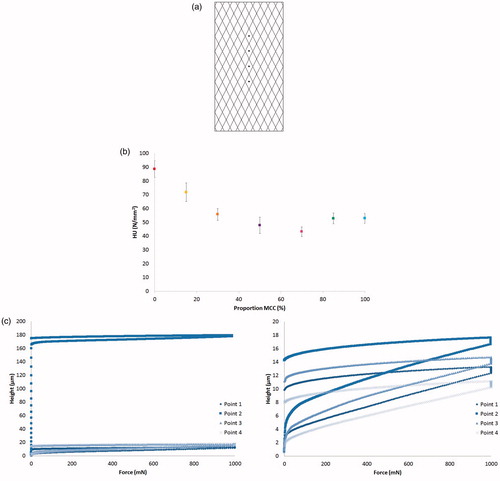
The HU and hmax.corr were only measured for the ribbons belonging to the repetitions of the center point for each of the materials evaluated. For each of the three repetitions of the center point, three ribbons were characterized (which means a total of nine ribbons for each material) and in each ribbon a minimum of four points were measured following the pattern on the surface of the ribbons, as shown in . As the compaction conditions were kept constant, this means that the effect of the material was evaluated.
Figure 1. (a) Scheme of a ribbon in which can be observed the measuring points. (b) Representation of the average HU for the center point ribbons with the confidence interval against the proportion of MCC. (c) Two examples of indentation curves: a case with the problem of high height reached at low values of force (left) and normal case showing the expected variability between the curves (right).
Characterization of granules: GSD, percentiles and amount of fines
In order to obtain representative samples of a batch, the granules were sampled using a rotary sample divider (PT, Retsch Technology, Haan, Germany). The GSD was measured using a dynamic image analyzer (Camsizer® XT, Retsch Technology GmbH, Haan, Germany) with the x-jet module. The dispersion pressure used for this purpose was 30 kPa and approximately 9 g was measured for each sample. Every batch was analyzed considering a minimum of three replicates. The class sizes were defined at 0–1, 1–10, 10–31, 31–45, 45–63, 63–90, 90–125, 125–180, 180–250, 250–355, 355–500, 500–710, 710–1000, 1000–1400 and 1400–2000 μm. The diameter chosen to express the results was Xc min, which is the particle diameter most similar to the one, which would be obtained in a sieving process. It is defined as the diameter of a circle that has the same area than the particle being characterized, calculated as the shortest of all the chords projected by the particleCitation38. GSD was described as the q3 and Q3 curves as well as tenth, fiftieth and ninetieth percentiles (D10, D50 and D90).
The amount of fines was also determined by establishing the lower limit according to the particle size of the mannitol before compaction which is, according to the supplier, 180 μmCitation39 as it is the material having the bigger starting particles.
Results and discussion
Microhardness of the ribbons
The HU and hmax.corr of the ribbons of the center point (6 kN/cm specific compaction force, 2.25 mm gap and 3 rpm roll speed) were analysed, meaning that the roll compaction conditions were kept constant and only the material affected the results. As it was previously shown in EquationEquation 1(1) , the values of HU are inversely related to hmax.corr, so if this last one decreases (and in consequence the indenter penetrates less inside the sample), the HU increases as the hardness of the material is higher.
shows the average values of the HU for all the ribbons from the center point of each material together with the confidence interval (CI) against the percentage of MCC. This value of HU is calculated as the average of all the points measured for the three repetitions of the center point. The confidence interval is calculated using Student's t-distribution for an error of α = 0.05 using the equation below:
(2)
where x is the mean HU value of the sample, s its standard deviation, t the value of Student's t-distribution and n the size of the sample.
This representation shown in is the result of a correction. Probably due to the irregular surface of the knurled ribbons and the problems to establish the zero point where the penetration starts, for some of the samples it was noticed that low forces were generating extremely high values of hmax. In , an example graph from the measurement of a sample showing the variability in the curves that is expected (right) is plotted together with another case (left) in which this problem can be observed.
For microhardness, a clear impact of the composition is observed. MCC, as a plastic material is softer while mannitol is harder due to its brittle characterCitation11. The high proportion of mannitol leads to harder ribbons while pure MCC to softer ribbons. However, the combination between these two materials can even result in softer ribbons, being those from mannitol the hardest ones and the softest from 70% MCC. This stresses out how the interaction between both materials affects the final behavior of the mixture.
The measurements were always performed in the middle of the ribbon and along its surface () as the density distribution and therefore the strength of the ribbon changes across the widthCitation40,Citation41. Nevertheless, several authors have also investigated how the density varies longwise the ribbonCitation42–45 and it was found out that the screws belonging to the feeding system generate a spiral distribution of the density along the ribbon. This fact may explain the obtained variability.
Granule size distribution (GSD)
All granules produced were analyzed in the Camsizer® XT. Due to the high amount of measurements performed, an average curve was prepared for each one of the 23 batches from each mixture. If the q3 curve is taken into consideration, in all the batches a bi-modal distribution is observed which is characteristic from the granules obtained in roll compaction as no liquid binder is used during the production and therefore the amount of fines, represented by the first component, is higher than in a wet granulation process. In order to facilitate the outlook of this first element, the q3 curve (left) together with its logarithmic representation (right) is represented in and classified depending on the mixture.
Figure 2. Linear and logarithmic q3 curves for mixtures of: 100% (a), 85% (b), 70% (c), 50% (d), 30% (e), 15% (f) and 0% MCC (g).
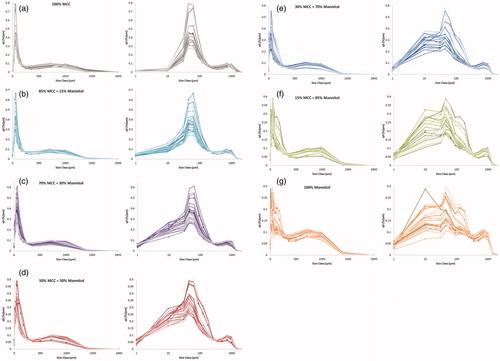
When evaluating the effect of the plastic/brittle interaction, a more linear evolution is observed for the general tendency of all the GSD curves together. As all combinations of parameter settings evaluated are plotted together, it cannot be attributed to any mixture effect. Nevertheless, the q3 representation permits to perceive how the first component decreases as well as the amount of bigger particles increases while increasing the proportion of brittle material on the mixture. In general MCC shows high amount of fines from 10 to 250 μm and lower amount of larger particles from 500 to 1400 μm, while mannitol presents a more homogenous distribution as there are similar proportions of granules for each interval.
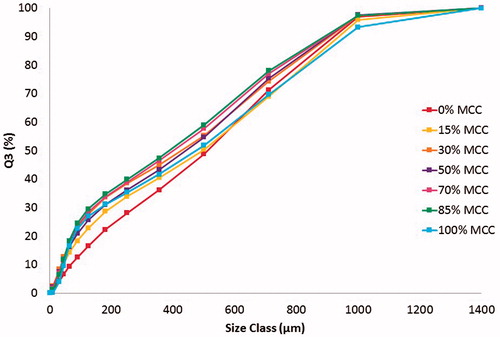
For better understanding of how the different materials respond to the milling process, an average Q3 curve of the granules obtained at the center point conditions was calculated for each material. The center point (6 kN/cm specific compaction force, 2.25 mm gap and 3 rpm roll speed) was chosen as it is the only batch performed three times. These curves are plotted in to evaluate the effect of the material. The mixtures show a non-additive behavior in respect to the pure materials. The differences between the mixtures depend on the segment from the whole distribution taken into consideration, thus, below 250 μm the mixtures show a behavior more similar to MCC. However, from 800 μm, the tendency of these mixtures is closer to the mannitol, i.e. more brittle. In the middle sector, around 500 μm the higher differences for the mixtures (from 30 to 85% MCC) in respect to the pure materials are observed.
Figure 3. Average cumulative curves Q3 for the center points of each mixture.
Amount of fines
As it was previously commented, in the q3 curve the amount of uncompacted material is almost represented by the first component already mentioned but not completely. This is due to the fact that the limit for distinguishing between granules and fines was established at 180 μm (particle size of mannitol according to the distributor) although for MCC the particle size is, according to the supplier, 50 μmCitation46. The logarithmic form of the q3 (see ) is used for facilitating the understanding of this first element almost unreadable in the linear representation.
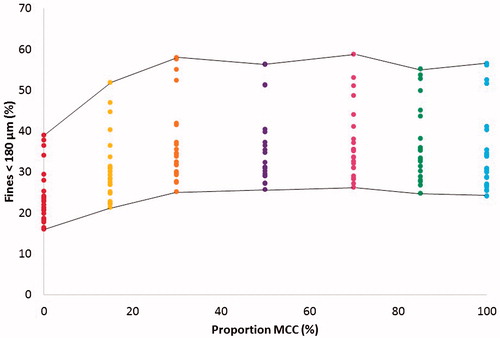
However, in order to see, in which range the percentage of uncompacted material are varying, the fines fraction for the 23 runs is plotted against the proportion of MCC in . In this sense, fraction of fines considering all conditions and materials vary in general, from a minimum of 16% (mannitol) to a maximum of 59% (mixture 70% MCC). In general, MCC has higher amount of uncompacted material than mannitol batches. The combination of the mixtures results in higher or lower values that the pure materials, pointing out the interaction between MCC and mannitol.
Figure 4. Percentage of fines smaller than 180 μm obtained for all the DOEs against the proportion of MCC.
In , the average value of the HU for the three repetitions of the center was plotted against their amount of fines. The correlation coefficient has a value of 0.799 for this relationship and considering that there are 21 points (20 degrees of freedom) the trend of the curve is statistically significant for an α < 0.1%.
Figure 5. Amount of fines for the center point granules against the microhardness obtained for the same batches of ribbons.
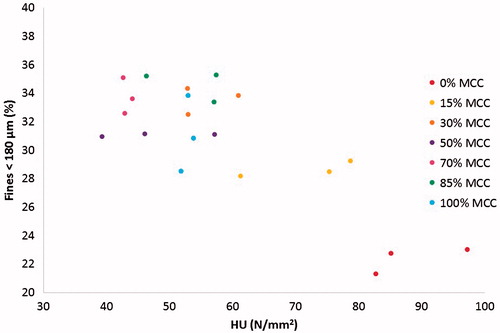
Mannitol ribbons which are the hardest ones, show the smallest amount of fines. A tendency of increasing the fines when decreasing the HU is followed also by the 15% and 30% MCC, but for the other mixtures and pure MCC the values are concentrated in an area between 39.3 and 61.0 N/mm2 for HU and 28.5 and 35.3% of fine fraction. However the replicates of each material for 30%, 50% and 85% MCC show different values of HU for similar values of fines fraction, while for the 0%, 15%, 70% and 100% MCC is the opposite, the HU is slightly changing for different amount of fines.
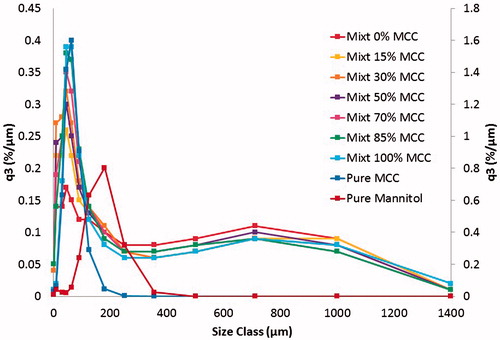
As the fine fraction exceeded in some cases a value of 50%, as it is observed in , it might be questioned, if the roll compaction process is really achieving the goal of size enlargement. For this purpose, shows an average q3 curve for the center point of each mixture together with the q3 curves obtained for the raw powder of MCC and mannitol analyzed on the Camsizer® XT under the same conditions that the granules, these latter ones are represented in a second y-axis which allows to see both mixtures and powder in a visible scale. In these representations it is possible to observe that in spite of the high amount of fines previously mentioned, it is also clear that roll compaction increases the particle size of the raw powder, and therefore is a useful process for obtaining granules.
Figure 6. q3 curves for the center point of each mixture together with the pure materials so that the size enlargement can be observed. Please note that the raw powder is represented using a second axis.
D10, D50 and D90 percentiles for granules
A new and summarized DOE was prepared for the study of the D10, D50, D90 and fines, including the percentage of MCC as a new factor. After the statistical analysis performed by Modde it can be concluded which are the factors that affect the variation of these responses and in the coefficient plot is presented. Only the significant responses are shown, therefore, the roll speed and its interactions were deleted.
Figure 7. Coefficient plots for the D10, D50, D90 and fines.
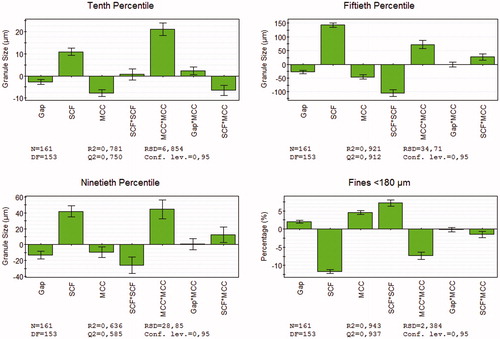
The specific compaction force (SCF in ) and the quadratic effect of the proportion of MCC have a proportional influence for the three percentiles and an indirect effect for the fines. On the contrary, the gap and the percentage of MCC have an inverse effect but a direct influence for the fines. The interaction between force and MCC is also significant for the four responses, but it has an inverse effect for the D10 and fines, while for the D50 and D90 is proportional. Similarly, the interaction between gap and MCC is only significant with a proportional effect in the case of the D10. However, the quadratic effect of the specific compaction force has no significant influence for this response but it does have it for the D50 and D90 with an inverse relationship and a direct effect for the fines.
The percentiles give another point of view of the GSD as they are another manner to express the distribution curve and here the effect of the mixture composition can be clearly evaluated. Therefore, from this statistical analysis it can be basically concluded that higher specific compaction force, smaller gap and lower proportions of MCC generate larger granules. This direct effect of the specific compaction force and the gap on the GSD was already described in the literatureCitation5,Citation7. Nevertheless, the roll speed showed no significant effect for the tested speed values although in the literature has been found to have an influence on the GSDCitation6,Citation8. This difference with the bibliography may be explained by the fact that the roll speed varies only from a minimum of 2 to a maximum of 4 rpm.
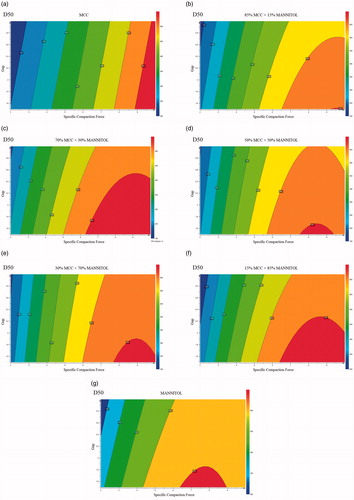
From all these percentiles, the response, which is more informative is the D50 as it gives an average value of the size of the granules. In , the contour plots for D50 of all the mixtures were collected in order to compare them. These representations were obtained after the statistical analysis of the seven individual DOEs. All the mixtures but the pure MCC are influenced by the gap and the quadratic effect of the specific compaction force indirectly, while the force itself has a proportional relationship with the D50. For the 0% MCC, the interaction between gap and force shows a direct effect although not significant for the specific case of the D50, and similarly, for the 70% MCC, the speed has an inverse influence slightly significant for this percentile but illustrated at the respective contour plot. Finally, for pure MCC the only factor significant is the specific compaction force, as the gap presents an indirect influence not significant, which justifies the pattern followed for this percentile.
Figure 8. Response contour plots for D50 of the mixtures: 100% (a), 85% (b), 70% (c), 50% (d), 30% (e), 15% (f) and 0% MCC (g).
Effect of material: percolation threshold
The ratio of plastic/brittle material for the mixtures has shown a clear impact on the final properties of ribbons and granules. Hence, the percolation theory was used in order to understand the relationship between material composition and mechanical behavior by identifying the percolation threshold. As it has been already reported on the literatureCitation32,Citation47,Citation48, the percolation threshold can be obtained by calculating the intersection point of the best fit lines for two data sets.
In , a mean value of the microhardness was presented, and now in the data from the three replicates is used to draw the best-fit lines. The intersection between these two lines occurs at 34% of MCC. If MCC does not percolate the system the microhardness is higher and depends on the concentration of mannitol.
Figure 9. Percolation thresholds for (a) the microhardness (HU), (b) D10 and fines and (c) D50 and D90 by intersection of the best fit lines.
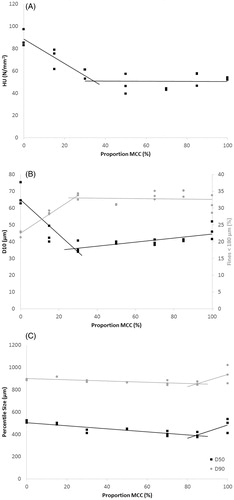
Similar procedure was followed for the three percentiles and the fines fractions. Similar percolation thresholds were found for D10 and the fines as well as for the D50 and D90, so these data were paired in two groups. A graph containing both calculations of the percolation threshold was prepared for both couples. shows the graphical calculation of the percolation thresholds for D10 and the fines (b) and for D50 and D90 (c). In the case of D10 and the fraction of fines the values for the intersection between the two best fit lines are 27% and 28%, respectively. Below the percolation threshold of MCC the fraction of fines decreases and D10 increases with the mannitol fraction. However, in the case of D50 and D90, the percolation threshold is 84% and 85%, respectively, so in this case, the differences on the behavior are due to the percolation of mannitol.
Conclusion
A DOE consisting of a multilevel full factorial design plus three repetitions of the center point was performed for seven mixtures of MCC and mannitol in order to evaluate how the ratio of plastic/brittle material (variation of the proportion of MCC in the mixture) affects the GSD of the granules and the microhardness of the ribbons of these materials produced under different roll compaction conditions. A bi-modal GSD was found independently for the compaction conditions or the material used. The individual DOEs were merged into one, which included the proportion of MCC as a factor. The percentiles D10, D50 and D90 as well as the amount of fines were studied through this combined DOE in order to identify the most critical factors affecting. On the one hand, the specific compaction force and the quadratic effect of the proportion of MCC showed a clear direct relation in the evolution of the percentiles, as well as an indirect effect for the amount of fines. On the other hand, for the gap and proportion of MCC an indirect influence was also detected for the percentiles while for the fines it was a proportional effect.
The GSD of the granules produced under the center point conditions was evaluated. The proportion of MCC shows a clear non-additive effect on this property, meaning that the mixtures have a behavior more similar to the pure plastic or to the pure brittle material depending on the size classes considered. The microhardness of the center point ribbons was measured resulting in stronger ribbons for pure mannitol while the 70% MCC mixture had the weakest ones. The range of plastic/brittle material also shows an impact on these results.
The importance of the proportion of the two excipients in the plastic/brittle mixture was further evaluated by application of the percolation theory. For the microhardness, the percentiles and the fine fraction, the percolation threshold was identified by calculating the intersection point from the best fit lines of the data divided in two sets. A proportion of MCC of 34% was obtained as percolation threshold for the microhardness. D10 and the fines fraction as well as D50 and D90 were paired according to the threshold values, which were 27% and 28% (percolation of MCC) and 84% and 85% (percolation of mannitol), respectively. In this sense, the importance of the plastic/brittle ratio when preparing a mixture for roll compaction was proved. Depending on the proportion of MCC, the behavior of a hypothetical mixture will be more plastic or more brittle, which will be reflected as well on the properties of ribbons and granules.
Acknowledgements
The authors would like to thank Bayer Pharma AG located in Berlin (Germany) and the team of Dr. Susanne Skrabs, especially Dr. Sarah Just, Dr. Dejan Djuric and Mr. Christian Nienerza for their different roles in this work.
Disclosure statement
This work was supported by the IPROCOM Marie Curie initial training network, funded through the People Program (Marie Curie Actions) of the European Union’s Seventh Framework Program FP7/2007–2013/under REA grant agreement No. 316555.
References
- Falzone AM, Peck GE, McCabe GP. Effects of changes in roller compactor parameters on granulations produced by compaction. Drug Dev Ind Pharm 1992;18:469–489.
- Hervieu P, Dehont F, Jerome E, et al. Granulation of pharmaceutical powders by compaction – an experimental study. Drug Dev Ind Pharm 1994;20:65–74.
- Guigon P, Simon O. Roll press design – influence of force feed systems on compaction. Powder Technol 2003;130:41–48.
- Inghelbrecht S, Remon JP. The roller compaction of different types of lactose. Int J Pharm 1998b;166:135–144.
- Rambali B, Baert L, Jans E, Massart DL. Influence of the roll compactor parameter settings and the compression pressure on the buccal bio-adhesive tablet properties. Int J Pharm 2001;220:129–140.
- Weyenberg W, Vermeire A, Vandervoort J, et al. Effects of roller compaction settings on the preparation of bioadhesive granules and ocular minitablets. Eur J Pharm Biopharm 2005;59:527–536.
- am Ende MT, Moses SK, Carella AJ, et al. Improving the content uniformity of a low-dose tablet formulation through roller compaction optimization. Pharm Dev Technol 2007;12:391–404.
- Souihi N, Josefson M, Tajarobi P, et al. Design space estimation of the roller compaction process. Ind Eng Chem Res 2013;52:12408–12419.
- Guy A. Cellulose, Microcrystalline. In: Rowe RC, Sheskey PJ, Quinn ME, eds. Handbook of pharmaceutical excipients. London: Pharmaceutical Press and American Pharmacists Association; 2009: 129–133.
- Armstrong NA. Mannitol. In: Rowe RC, Sheskey PJ, Quinn ME, eds. Handbook of pharmaceutical excipients. London: Pharmaceutical Press and American Pharmacists Association; 2009: 424–428.
- Ragnarsson G. Force-displacement and network measurements. In: Alderborn G, Nystrom C, eds. Pharmaceutical powder compaction technology. New York: Marcel Dekker, Inc.; 1996: 77–97.
- Inghelbrecht S, Remon JP. Roller compaction and tableting of microcrystalline cellulose drug mixtures. Int J Pharm 1998a;161:215–224.
- Herting MG, Klose K, Kleinebudde P. Comparison of different dry binders for roll compaction/dry granulation. Pharm Dev Technol 2007;12:525–532.
- Yu S, Adams M, Gururajan B, et al. The effects of lubrication on roll compaction, ribbon milling and tabletting. Chem Eng Sci 2013;86:9–18.
- Souihi N, Dumarey M, Wikstrom H, et al. A quality by design approach to investigate the effect of mannitol and dicalcium phosphate qualities on roll compaction. Int J Pharm 2013;447:47–61.
- Wagner CM, Pein M, Breitkreutz J. Roll compaction of granulated mannitol grades and the unprocessed crystalline delta-polymorph. Powder Technol 2015;270:470–475.
- Malkowska S, Khan KA. Effect of re-compression on the properties of tablets prepared by dry granulation. Drug Dev Ind Pharm 1983;9:331–347.
- Freitag F, Runge J, Kleinebudde P. Coprocessing of powdered cellulose and magnesium carbonate: direct tableting versus tableting after roll compaction/dry granulation. Pharm Dev Technol 2005;10:353–362.
- Herting MG, Kleinebudde P. Roll compaction/dry granulation: effect of raw material particle size on granule and tablet properties. Int J Pharm 2007;338:110–118.
- Yu S, Gururajan B, Reynolds G, et al. A comparative study of roll compaction of free-flowing and cohesive pharmaceutical powders. Int J Pharm 2012;428:39–47.
- Perez-Gandarillas L, Mazor A, Souriou D, et al. Compaction behaviour of dry granulated binary mixtures. Powder Technol 2015;285:62–67.
- Stauffer D, Aharony A. Introduction to percolation theory. London: Taylor and Francis; 1994:1–14.
- Blattner D, Kolb M, Leuenberger H. Percolation theory and compactibility of binary powder systems. Pharm Res 1990;7:113–117.
- Leuenberger H. The application of percolation theory in powder technology. Adv Powder Technol 1999;10:323–352.
- Bonny JD, Leuenberger H. Matrix type controlled release systems. II. Percolation effects in non-swellable matrices. Pharm Acta Helvet 1993;68:25–33.
- Caraballo I, Fernández-Arévalo M, Holgado MA, Rabasco AM. Percolation theory: application to the study of the release behaviour from inert matrix systems. Int J Pharm 1993;96:175–181.
- Leuenberger H, Bonny JD, Kolb M. Percolation effects in matrix-type controlled drug release systems. Int J Pharm 1995;115:217–224.
- Fernandez Hervas MJ, Vela MT, Gonzalez Rodriguez MLG, Rabasco AM. Using the percolation theory to explain the release behavior from inert matrix systems. Drug Dev Ind Pharm 1996;22:201–210.
- Fuertes I, Miranda A, Millan M, Caraballo I. Estimation of the percolation thresholds in acyclovir hydrophilic matrix tablets. Eur J Pharm Biopharm 2006;64:336–342.
- Caraballo I. Factors affecting drug release from hydroxypropyl methylcellulose matrix systems in the light of classical and percolation theories. Expert Opin Drug Deliv 2010;7:1291–1301.
- Grund J, Körber M, Bodmeier R. Predictability of drug release from water-insoluble polymeric matrix tablets. Eur J Pharm Biopharm 2013;85:650–655.
- Boersen N, Carvajal MT, Morris KR, et al. The influence of API concentration on the roller compaction process: modeling and prediction of the post compacted ribbon, granule and tablet properties using multivariate data analysis. Drug Dev Ind Pharm 2015;41:1470–1478.
- Heiman J, Tajarobi F, Gururajan B, et al. Roller compaction of hydrophilic extended release tablets-combined effects of processing variables and drug/matrix former particle size. AAPS PharmSciTech 2015;16:267–277.
- He X, Secreast PJ, Amidon GE. Mechanistic study of the effect of roller compaction and lubricant on tablet mechanical strength. J Pharm Sci 2007;96:1342–1355.
- Campbell GM, Bunn PJ, Webb C, Hook SCW. On predicting roller milling performance: Part II. The breakage function. Powder Technol 2001;115:243–255.
- Morrison RD, Shi F, Whyte R. Modelling of incremental rock breakage by impact – for use in DEM models. Miner Eng 2007;20:303–309.
- Sakwanichol J, Puttipipatkhachorn S, Ingenerf G, Kleinebudde P. Roll compaction/dry granulation: comparison between roll mill and oscillating granulator in dry granulation. Pharm Dev Technol 2012;17:30–39.
- Retsch. Bedienungsanleitung/Handbuch Korngrößenmesssystem Camsizer® und Camsizer® XT. Retsch Technology GmbH; 2012, Haan (Germany).
- Roquette. Pearlitol®, Mannitol for pharmaceutical applications; 2006.
- Farber L, Hapgood KP, Michaels JN, et al. Unified compaction curve model for tensile strength of tablets made by roller compaction and direct compression. Int J Pharm 2008;346:17–24.
- Miguélez-Morán AM, Wu CY, Seville JPK. The effect of lubrication on density distributions of roller compacted ribbons. Int J Pharm 2008;362:52–59.
- Simon O, Guigon P. Correlation between powder-packing properties and roll press compact heterogeneity. Powder Technol 2003;130:257–264.
- Lim H, Dave VS, Kidder L, et al. Assessment of the critical factors affecting the porosity of roller compacted ribbons and the feasibility of using NIR chemical imaging to evaluate the porosity distribution. Int J Pharm 2011;410:1–8.
- Nesarikar VV, Patel C, Early W, et al. Roller compaction process development and scale up using Johanson model calibrated with instrumented roll data. Int J Pharm 2012;436:486–507.
- Souihi N, Nilsson D, Josefson M, Trygg J. Near-infrared chemical imaging (NIR-CI) on roll compacted ribbons and tablets – multivariate mapping of physical and chemical properties. Int J Pharm 2015;483:200–211.
- FMC BioPolymer. Binders (Data sheet for Avicel® PH 101); 2008.
- Sinko CM, Carlson GT, Gierer DS. The identification of percolation and mechanical thresholds during the compaction of hydroxypropyl methylcellulose: comparison to thresholds determined from out-of-die indentation experiments. Int J Pharm 1995;114:85–93.
- Castellanos Gil E, Iraizoz Colarte A, Bataille B, et al. Estimation of the percolation thresholds in ternary lobenzarit disodium–dextran–HPMC hydrophilic matrices tablets: effects of initial porosity. Eur J Pharm Sci 2009;38:312–319.