Abstract
QSAR analysis using multiple linear regression and partial least squares methods were conducted on a data set of 47 pyrrolidine analogs acting as DPP IV inhibitors. The QSAR models generated (both MLR and PLS) were robust with statistically significant s, F, r, r2 and r2 (CV) values. The analysis helped to ascertain the role of shape flexibility index, Ipso atom E-state index and electrostatic parameters like dipole moment, in determining the activity of DPP IV inhibitors. In addition to QSAR modeling, Lipinski’s rule of five was also employed to check the pharmacokinetic profile of DPP IV inhibitors. Since none of the compounds violated the Lipinski’s rule of five indicating that the DPP IV inhibitors reported herein have sound pharmacokinetic profile and can be considered as potential drug candidates for diabetes mellitus Type II.
Introduction
Diabetes mellitus is a chronic metabolic disease resulting from insulin deficiency. There are roughly 35 million diabetics in the seven major world market with only about half being diagnosed, and these numbers are expected to double by 2030 [Citation1]. Among all other types, type2 diabetes is the most dangerous one and is typically a polygenic disease that results from a complex interplay between genetic predisposition and environmental factors such as diet, degree of physical activity, and age [Citation2]. Although diabetes mellitus is recognized by its characteristic hyperglycemia, the metabolic derangements are more pervasive involving altered metabolism of carbohydrates, fats, and proteins. As a function of time and consequent to the metabolic disruption, diabetic patients may suffer the tragic ravages of long-term damage, dysfunction, and failure of various organs, especially the eyes, kidneys, nerves, heart, and blood vessels [Citation3]. Thus, there is an urgent need for effective therapeutic approaches for glycemic control.
An incretin-based therapy represents a novel class of therapeutic agents for the treatment of type 2 diabetes that not only targets deficits in insulin secretion, but also reduces postprandial glucose and glucagon levels [Citation4]. Human body secretes certain peptide hormones called incretins following meal ingestion. These Incretins potentiate glucose-stimulated insulin secretion. The two predominant incretins are glucose-dependent insulinotropic polypeptide (GIP) and glucagon-like peptide-1 (GLP-1) [Citation5]. GIP and GLP-1 share a common effect of enhancing insulin secretion, but their other biological activities differ and are mediated via distinct receptors [Citation6]. The feasibility of GIP as an antidiabetic target is not fully clear in that its insulinotropic properties are impaired in experimental [Citation7] and clinical [Citation8, Citation9] diabetes. When blood glucose levels are high, the incretin hormone glucagon like peptide 1 (GLP-1[Citation7-36] amide or GLP-1) stimulates insulin secretion and biosynthesis and inhibits glucagon release. In addition, it serves as an “ileal brake”, slowing gastric emptying and reducing appetite. GLP-1 also appears to regulate the growth and differentiation of the insulin-producing cells in pancreatic islets in rodents [Citation10]. Thus, GLP-1 therapy for the treatment of type 2 diabetes is an area of active research.
One such approach involves the administration of degradation-resistant GLP-1 receptor (GLP-1R) agonists, such as exendin-4 [Citation11]. An alternative approach for enhancing incretin action involves the development of inhibitors of dipeptidyl peptidase- IV (DPP-IV), the principal enzyme responsible for inactivation of both GIP and GLP-1. Both incretin peptides contain an alanine residue at position 2, and are rapidly inactivated by N-terminal cleavage following secretion from gut endocrine cells [Citation12, Citation13, and Citation14].
DPP-IV is a serine protease that removes the dipeptides from the N terminus of the substrate peptide by cleaving post proline or alanine residues, and exists as both a membrane-bound protein in several tissues and as a soluble protein in plasma [Citation15].
The purpose of this study is to find the potential descriptors affecting the DPP-IV inhibitory activity which would retrieve important structural information about the target so that structural modifications in the present inhibitors could be done which would help in evaluating the biological activity of novel untested inhibitors. In view of above, there is a definite need for the development of robust QSAR model and identification of essential structural and physicochemical features important for the DPP IV antagonistic activity. The method adopted herein for developing QSAR model is multivariate statistical analysis, which was developed by Hansch and Fujita. The present study (multiple linear regressions (MLR) and partial least square (PLS) analysis) was performed using TSAR 3.3 software [Citation16].
Materials and Methods
Data set generation, Molecular Representation and Descriptor Calculation
The IC50 values for all the pyrrolidine analogs used in the present study were obtained from three different published literatures [Citation17, Citation18, and Citation19] as described in . In present research study, the biological activity of each compound was expressed as the negative logarithm of IC50 in order to reduce the skewness of data set.
Table 1. Structure and biological activity of DPP IV inhibitors used in QSAR analysis.
Chemical structures of all the compounds were sketched with the help of Accelrys (Discovery Studio version 2.0) [Citation16] and were imported into the work sheet of TSAR 3.3 software as mol 2 files. The series had one major substitution, which was defined using “define substituent” option in the Tsar worksheet’s tool bar to study the impact of varying substitutions. A correct alignment is of the utmost importance for creating useful and predictive models of biological activity; therefore three-dimensional structures of all loaded structures were generated using “Corina-make3D” option. Corina is a 3D structure generator designed by Jens Sadowski and Johann Gasteiger which is an automatic 3D-model building kit which combines monocentric fragments with standard bond lengths and angles and uses appropriate dihedral angles to built 3-D model of a molecule [Citation20].
Partial charges were derived using “Charge2-derive charges” option. Charge-2 is an empirical method which has been used successfully in a wide variety of chemical classes. It is based on two fundamental chemical concepts:
| (i) | Inductive effect in saturated molecules operating via the atomic electronegativity and polarizability and | ||||
| (ii) | Huckel molecular orbital calculations for n systems operating through the appropriate Coulomb and resonance integrals. | ||||
Energy optimization of all 3D structures was performed using “Cosmic-Optimize 3D” option of the software, which includes valence terms as bond potentials, bond angles, torsional potential and non bonded terms as electrostatic interactions and Van der Waals interaction.
To obtain a QSAR model, the structural features of the molecule were encoded, which were named as molecular descriptors. TSAR affords the calculation of various descriptors (molecular, electronic, topological, ADME, VAMP etc.). Descriptors were calculated for the entire molecule and their substituents.
Initially more than 150 descriptors were calculated for each series separately. The descriptors with the same values for all the compounds were discarded. Pair wise correlation analysis of the descriptors was performed, to identify highly correlated pairs of variables, and to identify redundancy in the dataset. The descriptors with lower t-value were also discarded.
Statistical analysis and pharmacokinetic check
The compounds of the series were divided into training set and test set. The object of this selection was to generate two sets with similar molecular diversity in order to be reciprocally representative and to cover all the main structural and physicochemical characteristics of the global data set [Citation21].Out of total 47 compounds, 39 were taken in training set and 8 were included in test set. Test set compounds included for analysis were 5, 8, 13, 16, 19, 29, 31 and 33.
The reduced data set was subjected to MLR and PLS analysis to establish correlation between most statistically significant descriptors and biological activity data. MLR was used for modeling quantitative relationships between a y-variable (dependent variable) and a block of x-variables (independent variables).
Often in QSAR, outliers are encountered. Outlier is any observation in a set of data that is inconsistent with the remainder of the observations in that data set. The outlier is inconsistent in the sense that it is not indicative of possible future behavior of data sets coming from the same source [Citation22, Citation23]. In this series five outliers were encountered which were compound no. 14, 22, 23, 27 and 46.These were deleted to improve the quality of the model.
PLS regression is described as a predictive method which can handle more than one dependent variable, and is not critically influenced by correlations between independent variables [Citation24]. PLS has been recommended as an alternative approach to enlarge the information contained in each model and avoids the danger of overfitting. It comes in to existence under the assumptions that the higher the number of variables used the better the prediction ability of PLS [Citation25].
Since for a well defined problem, both PLS and MLR techniques should give similar prediction, the PLS analysis was performed on the same data set. The models generated (both MLR & PLS) were validated using leave out group of rows cross validation. In Leave out group of rows cross-validation, the original sample is partitioned into K sub samples. Of the K sub samples, a single subsample is retained as the validation data for testing the model, and the remaining K − 1 subsamples are used as training data. The cross-validation process is then repeated K times (the folds), with each of the K subsamples used exactly once as the validation data. The K results from the folds then can be averaged (or otherwise combined) to produce a single estimation [Citation26, Citation27, Citation28]. In addition to internal validation, the developed models were also validated using external set of components (test set).
To ascertain that these inhibitors possess suitable pharmacokinetic properties, Lipinski’s rule of five was applied on whole data set. According to Lipinski’s rule of five - to be drug-like, a candidate should have less than five hydrogen bond donors (HBD), less than 10 hydrogen bond acceptors (HBA), a molecular weight of less than 500 dalton, and a partition coefficient log P of less than 5. This rule describes only the molecular properties related with pharmacokinetics of molecules which refers to the absorption, distribution, metabolism and excretion (ADME) of bioactive compounds in a higher organism. The aim of the “rule of five” is to highlight possible bioavailability problems if two or more properties are violated. [Citation29].The violation of above rule was analyzed by calculating the above parameters for all the whole molecules under consideration.
Results and Discussion
As an initial approach MLR model was developed with entire data set of molecular descriptors. The model generated, had r2 value of 0.69 and r2 (CV) value of 0.06. This model showed considerable value of r2 but very poor value of r2 (CV), so it was envisaged that refinement of descriptors can improve the statistical quality of model. Data reduction assisted in the retrieval of nine parameters which were independent to each other. Consequently, model was developed using these nine parameters with zero stepping, showed an r2 value 0.73 & r2 (CV) value of 0.31. The developed model is represented by equation 1.
Where X1, S1 = verloop B1 (substituent R1), X2, S2 = inertia moment 2 length (substituent R1), X3, S3 = total dipole moment (subst.1), X4, S4 = dipole moment X component (whole molecule), X5, S5 = dipole moment Y component (substituent R1), X6, S6 = log P (whole molecule), X7, S7 = shape flexibility index (whole molecule), X8, S8 = ipso atom E-state index (substituent R1) and X9, S9 = first atom E-state index.
The model developed with nine parameters exhibited an improvement in the value of r2 and r2 (CV). In view of the fact that, r2 (CV) > 0.6 can only be considered, we attempted to improve the model by checking the statistical quality of each descriptor and it was found that four descriptors (log P (whole molecule), verloop B1 (substituent R1), first atom E-state index (substituent R1), inertia moment 2 length [substituent R1]) were having low t-value. So these four descriptors were omitted one by one and resulted in an increase in the value of r2 (CV). The gradual increase in r2 (CV) after omitting four descriptors is shown in . As a final point in context to the selection of descriptors the model was developed with remaining 5 descriptors which resulted in r2 (CV) value of 0.54. So the final model included five descriptors namely total dipole moment (substituent R1), dipole moment X component (whole molecule), dipole moment Y component (substituent R1), shape flexibility index (whole molecule), ipso atom E state index (substituent R1) and is represented by equation 2.
Table 2. Table showing gradual improvement in the value of r2(CV) with deletion of following descriptors.
In order to further improve the statistical quality of the model (Eq.2), potential outliers were identified and it was discovered that five compounds are behaving as outliers and were removed from the model. The model developed after deletion of these outliers satisfied all the statistical criteria of a robust model. So the best model generated using MLR analysis for this data set resulted in r2 value of 0.87 and r2 (CV) of 0.84. Value of r2 closer to 1.0 indicates good correlation while the value of r2 (CV) above 0.6 indicates the good internal predictive capability of the developed model. Moreover the small difference between r2 and r2 (CV) values also augments the high prognostic quality of the model.
Many other statistical tests were also performed on the training set to assure that the model formed is sound. For example, F-test which indicates the degree of statistical confidence. So its higher value (36.42) reveals that the model constructed is statistically significant. The standard deviation of the data (SD) shows how far the activity values are spread about their average. Its lower value (0.28) indicates soundness of the model. The efficacy of the model was also evaluated by checking its statistical stability using predictive and residual sum of squares [Citation30].The statistical values of these tests are given in and the final regression equations obtained is equation 3:
Table 3. Statistical tests and their values obtained after performing MLR analysis.
Where X1= total dipole moment (substituent R1), X2= dipole moment X component (whole molecule), X3= dipole moment Y component (substituent R1), X4= shape flexibility index (whole molecule), X5= ipso atom E state index (substituent R1).
PLS analysis was also performed on the same data set to check the soundness of the MLR model. The resulted r2 (CV) value of 0.82 clearly demonstrates the high predictive ability of the developed PLS model (Equation 4). The other statistical test values of this model are given in .
Table 4. Statistical tests and their values obtained from PLS analysis.
Since for a well defined problem, both MLR and PLS should generate comparable results [Citation31], the r2 (CV) values of MLR the PLS models were evaluated and it was found that both the models have comparable r2(CV) value of 0.84 and 0.82 for MLR and PLS respectively. The actual and predicted biological activity values of MLR and PLS analysis for training and test are given in and and their respective plots are depicted in , , and .
Table 5. Table showing the actual and predicted values of biological activity obtained after MLR and PLS analysis of training set.
Table 6. Table showing the actual and predicted values of biological activity obtained after MLR and PLS analysis of test set.
Figure 1. Plot of Experimental vs. Predicted IC50 values for training set (MLR analysis).
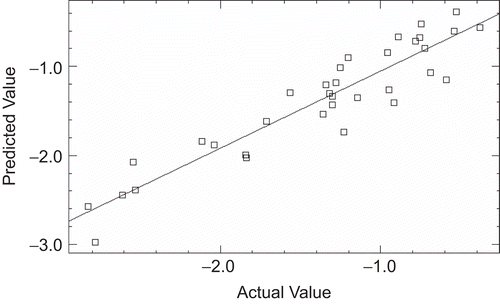
Figure 2. Plot of Experimental vs. Predicted IC50 values for test set (MLR analysis).
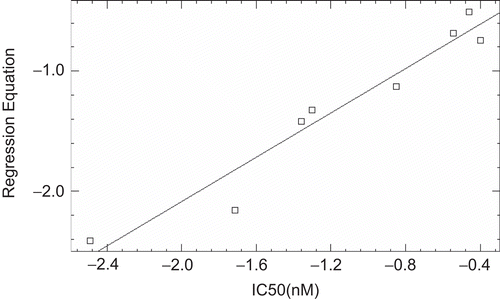
Figure 3. Plot of Experimental vs. Predicted IC50 values for training set (PLS analysis).
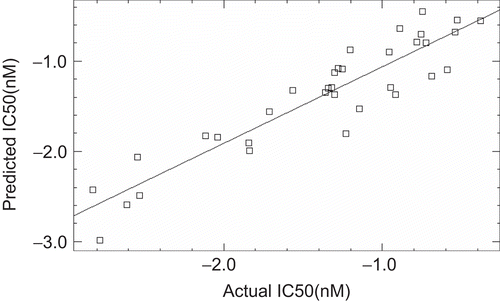
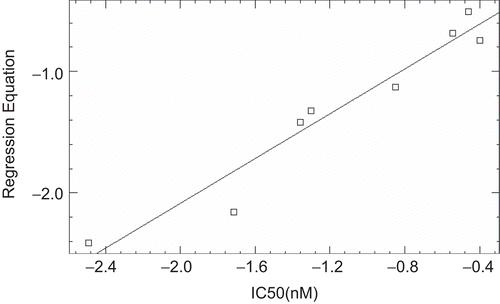
Figure 4. Plot of Experimental vs. Predicted IC50 values for test set (PLS analysis).
Analysis of Descriptors Entered
Total dipole moment, dipole moment X component (whole molecule) and dipole moment Y component (substituent R1) are electrostatic descriptors which explain the charge distribution in a molecule [Citation32]. So as in the regression equation all three dipole moment descriptors are negatively correlated with the biological activity, this indicates that decreasing the polarity of the molecule or lead compound by substituting such groups that decrease the polarity of the molecule as a whole will account for an increase in the biological activity. This clearly shows that the active site on DPP IV is lipophilic in nature and will show hydrophobic interactions. The earlier findings of the presence of catalytically active serine hydroxyl (Ser630) at the active site of DPP IV also confirms this fact [Citation33].
Shape flexibility index was another descriptor that entered the model. This descriptor is based on structural properties that restrict a molecule from being “infinitely flexible”, the model for which is an endless chain of C (sp3) atoms. The structural features considered for preventing a molecule from attaining infinite flexibility are: (a) fewer atoms, (b) the presence of rings, (c) branching, and (d) the presence of atoms with covalent radii smaller than those of C (sp3). These features are encoded in the index as follows:
Φ = κ1ακ2α / N Where N = number of vertices [Citation34].
Shape flexibility index correlates positively with the biological activity which proves that it is responsible for preventing the molecule from becoming infinitely flexible and it has also been revealed from earlier findings that substitution with quite big branched side chains, e.g. tert-butyl glycin, normally increases activity and chemical stability which could lead to longer-lasting inhibition of the DPP-4 enzyme [Citation33]. So substitution with groups that lower the flexibility or which increase the value of this index may account for an enhancement in biological activity.
Another descriptor which entered the model was Ipso atom E-state index. It is a type of topological descriptor introduced by Kier and Hall. The E-state variable encodes the intrinsic electronic state of the atom as influenced by the electronic environment of all other atoms within the topological framework of the molecule [Citation35]. Ipso atom is a C-atom at the juncture of two aromatic rings as in the 9 and 10 positions in naphthalene and an aromatic carbon which is bonded to a substituent. So ipso atom E-state index gives three very important aspects of structure information. They are:
The electron accessibility associated with ipso atom type, characteristic of the E-state index,
An indication of the presence of ipso atom type, and
The count of the number of atoms of a ipso atom type [Citation32].
As ipso atom E-state index is positively correlated with biological activity in the regression equation, so if substitution is made with groups that increases its value will definitely lead to an increase in biological activity of lead molecule.
This study clearly indicates that reducing the dipole moment of whole molecule and substituents1 (negatively correlated parameters) and optimizing the values of shape flexibility and ipso atom E state index (positively correlated parameter) will increase the DPP IV inhibitory activity of the pyrrolidines as evident form the present series in which high activity of compounds 1, 4, 7, 9, and 10 are in agreement to the descriptors entering the MLR and PLS models.
Further to check the druggability of the present series Lipinski’s rule of five was applied. Four molecular descriptors i.e. number of H-bond donors, number of H-bond acceptors, molecular weight and log P were calculated () separately for the whole data set and violations from Lipinski’s rule were checked. None of the compounds violated the Lipinski’s rule of five (not even in a single property). This proves these DPP IV inhibitors have a sound pharmacokinetic profile and hence have tremendous potential for their development as drug candidates for treatment of type II diabetes mellitus.
Table 7. Values of calculated parameters for Lipinski’s rule of five.
Conclusion
A comparison was made between the models derived from both PLS and MLR analyses using conventional QSAR descriptors on the 39 pyrrolidine analogs in the training and 08 pyrrolidine analogs in the test datasets acting against DPP IV. Both statistical analysis reported comparable results which proved that the model formed is sound and has good predictability and hence can be used to design novel DPP IV inhibitors. All the results discussed above indicated that by using either PLS or MR analysis with traditional descriptors, highly robust models can be derived that also possess very powerful predictive abilities. The predicted affinities of the eight compounds in the test set were also very close to their actual activities. According to the classical QSAR models presented in the current work, molecular parameters encoding the shape, polarity and electronic architecture of pyrrolidine analogs are considered to be important contributors to their biological properties.
It can be concluded that a validated highly predictive QSAR model has been obtained which could provide a powerful tool for predicting the affinity of related compounds with DPP-IV inhibitor activity and it can also be used for the design and discovery of new DPP-IV antagonists with the improved activities.
Also, pharmacokinetic properties such as absorption across cell membranes, distribution and solubility of these derivatives are under the criteria of Lipinski’s rule of five, which keep them in an acceptable range of druggability.
Acknowledgements
Authors are thankful to the Vice Chancellor, Prof. Aditya Shastri, Banasthali University, Rajasthan for providing necessary facilities to complete this work.
Declaration of interest
The authors report no conflict of interest.
Related Research Data
References
- Morral N. Novel targets and therapeutic strategies for type 2 diabetes. Trends Endocrinol Metab 2003; 14:169–75.
- Ross S A, Gulve E A, and Wang M. Chemistry and biochemistry of Type 2 Diabetes. Chem Rev. 2004; 104 (3):1255–1282.
- Skyler JS. Diabetes Mellitus: Pathogenesis and Treatment Strategies. J Med Chem. 2004; 47: 4113–4117.
- Vilsbøll T, Knop FK. Effect of incretin hormones GIP and GLP-1 for the pathogenesis of type 2 diabetes mellitus. Ugeskr Laeger 2007; 169: 2101–5.
- Drucker DJ. The biology of incretin hormones. Cell Metabolism 2006; 3:153–165.
- Nauck MA, Bartels E, Orskov C, Ebert R, Creutzfeldt W. Additive insulinotropic effects of exogenous synthetic human gastric inhibitory polypeptide and glucagon-like peptide-1-(7-36) amide infused at near-physiological insulinotropic hormone and glucose concentrations. J Clin Endocrinol Metab 1993; 76: 912–917.
- Lynn FC, Pamir N, Ng EHC, McIntosh CH.S, Pederson RA. Defective glucose-dependent insulinotropic polypeptide receptor expression in diabetic fatty Zucker rats. Diabetes 2001; 50:1004–1011.
- Jones I R, Owens DR, Moody A J, Luzio SD; Morris T, Hayes, TM. The effects of glucose-dependent insulinotropic polypeptide infused at physiological concentrations in normal subjects and Type 2 (non-insulin-dependent) diabetic patients on glucose tolerance and B-cell secretion. Diabetologia 1987; 30: 707–712.
- Meier JJ, Hucking K, Holst JJ, Deacon CF, Schmiegel WH, Nauck MA. Reduced insulinotropic effect of gastric inhibitory polypeptide in first-degree relatives of patients with type 2 diabetes. Diabetes 2001; 50: 2497–2504.
- Knudsen LB. Glucagon-like Peptide-1: The Basis of New Class of Treatment for Type 2 Diabetes. J Med Chem 2004; 47: 4128–4134.
- Eng J, Kleinman WA, Singh L, Singh G, Raufman JP. Isolation and characterization of exendin 4, an exendin 3 analogue from Heloderma suspectum venom. J Biol Chem 1992; 267: 7402–7405.
- Mentlein R, Gallwitz B, Schmidt WE. Dipeptidyl-peptidase IV hydrolyses gastric inhibitory polypeptide, glucagon-like peptide-1(7-36) amide, peptide histidine methionine and is responsible for their degradation in human serum. Eur J Biochem 1993; 214: 829–835.
- Kieffer TJ, McIntosh CH, Pederson RA. Degradation of glucose-dependent insulinotropic polypeptide and truncated glucagon-like peptide 1 in vitro and in vivo by dipeptidyl peptidase IV. Endocrinology 1995; 136: 3585–3596.
- Hansen L, Deacon CF, Orskov C, Holst JJ. Glucagon-like peptide-1-(7-36)amide is transformed to glucagon-like peptide-1-(9-36)amide by dipeptidyl peptidase IV in the capillaries supplying the L cells of the porcine intestine. Endocrinology 1999; 140: 5356–5363.
- Mentlein R. Dipeptidyl-peptidase IV (CD26)-role in the inactivation of regulatory peptides. Regul Pept 1999; 85: 9–24.
- http://accelrys.com/products/accord/desktop/tsar.html: TSAR 3.3, Oxford Molecular Limited
- Takashi K, Sugimoto I, Nekado T, Ochi K, Ohtani T, Tajima Y, Yamamoto S, Kawabata K, Nakai H. Toda M (2007) Design and synthesis of long-acting inhibitors of Dipeptidyl peptidase IV. Biorg Med Chem 2007; 15: 2715–2735.
- Takashi K, Sugimoto I, Nekado T, Ochi K, Takai S, Kinoshita A, Hatayama A, Yamamoto S, Kawabata K, Nakai H., Toda M. Discovery of long-acting N-(cyanomethyl)-N-alkyl-L-prolinamide inhibitors of dipeptidyl peptidase IV. Biorg Med Chem 2008; 16: 190–208.
- Takashi K, Sugimoto I, Nekado T, Ochi K, Takai S, Kinoshita A, Hatayama A, Yamamoto S, Kishikawa K, Nakai H., Toda M. Design and synthesis of DPP IV inhibitors lacking the electrophilic nitrile group. Biorg Med Chem 2008; 16: 1613–1631.
- Sadowski J, Gasteiger J. From Atoms and Bonds to Three-Dimensional Atomic Coordinates: Automatic Model Builders. Chem Rev 1993; 93: 2567–2581.
- Benfenati E, Quantitative structure activity relationships [QSAR]. for pesticide regulatory purposes. Elsevier 2007:186.
- Balakrishnan N; Childs A. “Outlier”, in Hazewinkel, Michiel, Encyclopaedia of Mathematics, 2001, Kluwer Academic Publishers, ISBN 978-1556080104
- Kim KH. Outliers in SAR and QSAR: 2. Is a flexible binding site a possible source of outliers? J Comput Aided Mol Des 2007; 21: 421–435.
- Spanier A M, Okai H, Tamura M. Food Flavor and Safety: Molecular Analysis and Design. ACS Symposium Series 1993; 103–104.
- Paliwal S, Narayan A, Paliwal Shailendra. Quantitative Structure Activity Relationship Analysis of Dicationic Diphenylisoxazole as Potent Anti-Trypanosomal Agents. QSAR Comb Sci 2009; 28: 1367 – 1375.
- Kohavi, Ron. A study of cross-validation and bootstrap for accuracy estimation and model selection. Proceedings of the Fourteenth International Joint Conference on Artificial Intelligence 1995; 2 (12): 1137–1143. (Morgan Kaufmann, San Mateo).
- Chang J, Luo Y, Su, K. GPSM: a Generalized Probabilistic Semantic Model for ambiguity resolution. In Proceedings of the 30th Annual Meeting on Association For Computational Linguistics (Newark, Delaware, June 28 - July 02, 1992). Annual Meeting of the ACL. Association for Computational Linguistics, Morristown, NJ,1992; 177–184.
- Devijver P A, Kittler J. Pattern Recognition: A Statistical Approach, Prentice-Hall, London, 1982
- Quinn RJ, Carroll AR, Pham NB, Baron P, Palframan ME, Suraweera L, Pierens GK, Muresan M. Developing a Drug-like Natural Product Library. J Nat Prod 2008; 71: 464–468.
- Dessalew N. QSAR study on aminophenylbenzamides and acrylamides as histone deacetylase inhibitors: An insight into the structural basis of antiproliferative activity. Med Chem Res 2007; 16:449–460.
- Paliwal SK, Pal M, Siddiqui AA. Quantitative structure activity relationship analysis of angiotensin II AT1 receptor antagonists. Med Chem Res DOI 10.1007/s00044-009-9205-9.
- Karelson M. Molecular Descriptors in QSAR / QSPR, Wiley Interscience, New York, February. 2000.
- Peters, Jens-Uwe. 11 years of Cyanopyrrolidines as DPP-IV Inhibitors. Current topics in Med Chem 2007;7: 579–595.
- Hall L H, Kier LB. The molecular connectivity chi indexes and kappa shape indexes in structure-property modeling. Reviews in Computational Chemistry II 1991; 367–422.
- Sapre NS, Pancholi N, Gupta S, Sapre N. Computational modeling of tetrahydroimidazo-[4,5,1-jk][1,4]. benzodiazepinone derivatives: an atomistic drug design approach using Kier-Hall electrotopological state (E-state) indices. J Comput Chem 2008; 29: 1699–706.