
Abstract
Ingestion of peanuts may have a beneficial effect on weight control, possibly due to the satietogenic action of trypsin inhibitors. The aim of this study was to isolate a new trypsin inhibitor in a typical Brazilian peanut sweet (paçoca) and evaluate its effect in biochemical parameters, weight gain and food intake in male Wistar rats. The trypsin inhibitor in peanut paçoca (AHTI) was isolated. Experimental diets were prepared with AIN-93G supplemented with AHTI. Animals had their weight and food intake monitored. Animals were anesthetized, euthanized, and their bloods collected by cardiac puncture for dosage of cholecystokinin (CCK) and other biochemical parameters. Supplementation with AHTI significantly decreased fasting glucose, body weight gain, and food intake. These effects may be attributed to increased satiety, once supplemented animals showed no evidence of impaired nutritional status and also because AHTI increased CCK production. Thus, our results indicate that AHTI, besides reducing fasting glucose, can reduce weight gain via food intake reduction.
Introduction
Obesity stands out among the diseases caused by nutritional inadequacies. It is growing in many regions of the world, in developed and underdeveloped countries, reaching epidemic levelsCitation1–3. This makes the investment in resources to find natural products for the prevention and treatment of obesity a growing field.
Thus, advances in the scientific expertise that involves quality, safety, and efficacy inherent to herbal medicinal products in recent years have placed the area of bioactive natural products in an outstanding position. In the treatment of obesity, factors such as the high cost of drugs and its side effects, have increased the demand by the population for natural products using plants with slimming actionsCitation4–6.
Oilseeds intake, regardless their high fat composition, have shown beneficial effects on healthCitation7,Citation8. Peanut, among these seeds, is one of the most consumed in Brazil, representing an important source of protein and fat. Its great economic impact is mainly due to the various forms of consumption in the countryCitation9.
Although peanuts present high energy content, researches have shown a relationship between its consumption and a reduction in weight gain. There are several hypotheses to justify these findings. One of them is that part of the energy is not available due to components that prevent digestionCitation8,Citation10,Citation11. Another possibility is that the satietogenic peanut effect may be attributed to its peculiar lipid, fiber, and protein composition. Also, there are reports in the literature that postulate that the presence of trypsin inhibitors in peanutsCitation12–16 may lead to a reduction in weight gainCitation11. In this context, it is noteworthy that the trypsin inhibitors increase the concentration of cholecystokinin (CCK), which has a satietogenic effectCitation17–20.
As new studies are developed investigating the effects of peanuts ingestion, various foods peanut derived are increasingly being consumed in Brazil, including: peanut oil, peanut butter, and paçoca, the latter consumed as a typical Brazilian Northeastern dessert, made with sugar, flour, and condensed milk. In addition, in 2010, a research conducted by the Brazilian Institute of Public Opinion and Statistics (Ibope) demonstrated that 66% of the Brazilian population consumes peanutsCitation21.
Sequiz et al.Citation11 showed that consumption of peanut paçoca, a food high in trypsin inhibitor, derived from peanut, could help to promote satiety and reduced weight gain, without causing damage to the pancreas, or cause changes in biochemical parameters analyzed. However, it is not known if the presence of trypsin inhibitor was a determining factor in this weight reduction. In this sense, it is important the isolation and characterization of this trypsin inhibitor of peanut paçoca, as well as, research if this inhibitor is responsible for weight reduction and satiety.
Experimental section
Reagents
Trypsin, Azocasein 1%, α-N-benzoyl-arginine-p-nitroanilide, dimethylformamide, bovine serum albumin (BSA), dimethyl sulfoxide, acrylamide, N′N′-methylenebisacrylamide, N,N,N,N′-tetramethylethylenediamine, Coomassie Blue G-250, and R-250 were purchased from Sigma, St. Louis, MO. CCK immunoassay kit was purchased from Phoenix Pharmaceuticals, Burlingame, CA.
Peanut paçoca (peanut sweet)
The peanut paçoca was purchased in local shops in the city of Natal, RN, northeast Brazil.
Animals
Male Wistar rats, two months old, weighing between 150 and 200 g were used. Animals were acclimated individually in metabolic cages and maintained on a photoperiod of 12/12 h at a temperature of 25 ± 2 °C and humidity between 45% and 55%, with access to water and food ad libitum. The experimental protocol of this study was submitted to the Ethics Committee on Animal Use of the Federal University of Rio Grande do Norte – UFRN (protocol N° 021/2011). For the development of this protocol all ethical principles and procedures were adopted. Experiments from this study are part of a larger projectCitation20.
Isolation of a new trypsin inhibitor
The peanut paçoca was powdered in cold mill (6 °C) until the formation of a fine grained flour (40 mesh). Total proteins were extracted from this flour in 50 mM Tris-HCl buffer, pH 7.5, at a ratio of 1:10 (w/v). The mixture was subjected to constant stirring for 3 h at room temperature. The material was centrifuged at 12 000× g for 30 min at 4 °C. The supernatant and the precipitate were denominated crude extract (CE) and precipitated from crude extract (PEB), respectively. The CE was fractionated by sequential precipitation with ammonium sulfate in 0–30%, 30–60%, and 60–90% saturation ranges. Each fraction was kept for 12 h at 8 °C and centrifuged at 12 000× g for 30 min at 4 °C to obtain the precipitated proteins. The precipitates were resuspended in 50 mM Tris-HCl pH 7.5, dialyzed against the same buffer and stored at −20 °C until the experiments. About 60 mg of F2 (30–60%) were applied to a Trypsin-Sepharose 4B affinity column (10 cm × 1.5 cm) in Tris-HCL buffer 50 mM, pH 7.5. Adsorbed proteins were eluted from the matrix with 5 mM HCl solution and collected in aliquots of 3 ml at a flow rate of 2 ml/min. The protein profile was evaluated by spectrophotometry at 280 nm. The retained and eluted peak from the affinity matrix was dialyzed against Tris-HCl 50 mM, pH 7.5, lyophilized and called Arachis hypogaea L. trypsin inhibitor – AHTI.
Protein quantification and evaluation of the purity of the protein inhibitor
Proteins were quantified by the BradfordCitation22 method using BSA as a standard. The purity degree of the inhibitor in different fractions and of the purified inhibitors was determined by SDS-PAGE 12.5% as described by LaemmliCitation23. An aliquot containing approximately 15 µg of protein was applied on the gel. After electrophoresis, proteins were silver stainedCitation24. Molecular weight markers (Fermentas Life Sciences, Thermo Fischer Scientific, Waltham, MA) were utilized as standard.
Antitrypsin activity
The trypsin inhibitor activity of CE, PEB, F1, F2, F3, and AHTI was determined using the following methodology: 20 µL aliquots of bovine trypsin solution (0.3 mg/ml 2.5 mM HCl) were pre-incubated with 560 µL Tris-HCl 0.05 M buffer, pH 7.5, 120 µL of HCl 2.5 mM, and 100 µL of CE, PEB, F1, F2, or F3 and 20 µL of AHTI for 15 min at 37 °C. After this period, the reaction was started by adding 500 µL of a specific substrate solution (1.25 mM BApNA). The reaction proceeded for another 10 min under the same conditions of incubation and was then quenched by adding 120 µL of 30% acetic acid solutionCitation25. All assays were performed in triplicate and blank tests were performed. The absorbance was measured at 410 nm (Ultrospec™ 2100 pro, GE Healthcare Life Sciences, Piscataway, NJ). The results are expressed in IU/μg soluble protein. The IU was defined as the amount of inhibitor that can decrease by 0.01 nm the absorbance value in the trypsin inhibitor assay.
AHTI stability evaluation
To assess stability in different temperatures and pH we followed the methodology described by Gomes et al.Citation26. Aliquots of AHTI were incubated for 30 min at 40, 60, 80, and 100 °C. After the incubation, samples were cooled to 4 °C. To evaluate the stability of AHTI after treatment at different pH inhibitor aliquots were dialyzed against buffer to the desired pH for 16 h. Such buffers were: to pH 2–4, Glycine-HCl; to pH 5–8 sodium phosphate monobasic; to pH 9–12 glycine-NaOH, in which the solute concentration was 100 mM. After 1 h incubation at 37 °C in these buffers the samples were dialyzed for 4 h in 50 mM Tris-HCl, pH 7.5, to adjust the pH of the assay. The inhibitory activity for trypsin assays were done in triplicate using 10 µg (0.3 nM) of the inhibitor.
Determination of IC50 and Ki against trypsin
The concentration of AHTI that inhibits 50% of trypsin activity (IC50) was determined by constructing a curve, which relates the inhibition percentage of trypsin activity and AHTI concentration. For the construction of the curve, increasing concentrations of inhibitor were added in 10 µL trypsin aliquots (0, 4 μg = 0.012 nM). To determine the mechanism of inhibition and inhibition constant (Ki), a graph was plotted according to Dixon et al.Citation27, where the abscissa axis (X) corresponds to increasing concentrations of AHTI (0; 1.84; 3.68; 7.35; 11; 14.71; 29.41 and 58.82 nM) and the axis of ordinates (Y) corresponds to the inverse value of the maximum speed. The enzymatic assay for the determination of trypsin Ki was done using two BApNA concentrations (1.25 × 10⁻³ and 6.25 × 10⁻⁴ M).
Experimental model to evaluate food intake, protein digestibility and biochemical alterations in diets supplemented with the AHTI
Wistar rats (n = 05), after 3 d of adaptation for the establishment of the average daily dietary intake, were distributed individually, randomly into four groups in metabolic cages, receiving AIN-93G according to Reves et al.Citation28 for 11 d. These rats consumed a single dose of 100 g of one of the following diets (): (1) Standard – AIN-93G diet; (2) Standard + Water – Standard AIN-93G diet supplemented by oral gavage with water; (3) Aproteic diet; (4) AHTI (50 mg/kg) – Standard AIN-93G diet, supplemented by oral gavage with 50 mg/kg of AHTI according to Ribeiro et al.Citation20 This latest group was included to control for the influence of the gavage procedure. The consumption of diets and water were daily monitored. Urine and feces of each animal were collected, identified and kept in a refrigerator for later analysis.
Table 1. Composition of the experimental diets used in Wistar rats in the experimental models.
For the determination of protein digestibility, feces were dried with air circulation at 105 °C for 24 h. Then they were cooled, weighed, and ground in a multiprocessor for nitrogen determination using the Kjeldahl method described by AOAC (1984). Apparent and true digestibility and the apparent biological value were calculated according to Amaya et al.Citation29
At the end of the tests with diets, the rats were fasted for 12–15 h, anesthetized with 2% xylazine and 5% ketamine and euthanized. Blood was collected by cardiac puncture and stored in Falcon tubes with EDTA anticoagulant. Serum was separated by centrifugation at 3000 × g for 10 min and used for glucose (GL), triglycerides (TG), total cholesterol (COL), high-density lipoproteins (HDL), and low-density lipoprotein (LDL) determination. The method used in the assays was the enzymatic-colorimetric (CELM® kit, São Paulo, Brazil). Blood samples were also subjected to enzymatic assays for glutamic pyruvic transaminase (GPT) and glutamic oxaloacetic transaminase (GOT) (Labtest diagnostic kit transferases, Paraná, Brazil).
Experimental model to evaluate weight gain, food intake at specific times, biochemical alterations, and plasmatic CCK in diets supplemented with the AHTI
Wistar rats (n = 05), after 3 d of adaptation for the establishment of the average daily dietary intake, were distributed individually, randomly into five groups in metabolic cages, receiving AIN-93G according to Reves et al.Citation28 for 11 d. These rats were evaluated for changes in food intake after 1, 2, and 18 h of oral administration of a single dose of 100 g of one of the following diets: (1) Standard + Water – Standard AIN-93G diet, supplemented by oral gavage with water; (2) Casein – Standard AIN-93G diet, supplemented by oral gavage with 25 mg/kg of casein; (3) Soybean inhibitor – Standard AIN-93G diet, supplemented by oral gavage with 25 mg/kg of soybean inhibitor; (4) AHTI (25 mg/kg) – Standard AIN-93G diet, supplemented by oral gavage with 25 mg/kg of AHTI; (5) AHTI (50 mg/kg) – Standard AIN-93G diet, supplemented by oral gavage with 50 mg/kg of AHTI. The consumption of diets and water were daily monitored, as well as weight gain per animal.
Food intake was daily monitored at 1, 2, and 18 h after diets administration. On the last day of the experiment, prior to oral administration of the diet, the animals were fasted for a period of 6 h. After this, 100 g of diet was administered and, 1 h after, animals were anesthetized with 2% xylazine and 5% ketamine and euthanized. The same biochemical parameters analyzed in the first experiment were repeated. There were also held the dosages of VLDL (CELM® Kit, Sao Paulo, Brazil), gamma GT (kit range gt Labtest Diagnostic SA®, Paraná, Brazil) and albumin (Labtest Diagnostic kit SA®, Paraná, Brazil). Plasmatic CCK was also assessed. Blood collection, plasma extraction, and immunoassay followed the specifications of the kit (Phoenix Pharmaceuticals Inc., Burlingame, CA).
Statistical analysis
Weight, feed efficiency, food intake, CCK, and biochemical parameters (glucose, total cholesterol, high-density lipoproteins (HDL), low-density lipoprotein (LDL), very low-density lipoprotein (VLDL), triglycerides, Aspartate transaminase (AST), alanine aminotransferase (ALT), gamma-glutamyl transferase (GGT), and albumin) were analyzed using one-way ANOVA followed by Tukey’s post-hoc test to find possible differences between the groups throughout the experiment. Differences were considered significant when the p value was less than 0.05. Data were analyzed using GraphPad Prism 6.07 software.
Results
Isolation and purity evaluation of the AHTI
In the present study, a new trypsin inhibitor was identified and isolated from peanut paçoca, showing 92% inhibition for the catalytic activity of trypsin and approximately 33 kDa (). Therefore, this new trypsin inhibitor isolated from peanut paçoca was called AHTI. The AHTI had a yield of 63.4 and was purified 267 times ().
Figure 1. Trypsin–Sepharose affinity chromatography of F2 from peanut paçoca and SDS-PAGE of AHTI. (A) Proteic profile at 280 nm (black line) and anti-trypsin activity (gray line) of retained and eluted proteins in HCl 1 mM. Constant flow of 3.5 ml/min. (B) Denaturing, discontinuous polyacrylamide gel electrophoresis (SDS-PAGE) stained with Coomassie blue R250. M – Molecular marker. EB – Crude extract from peanut paçoca. F2 – Protein fraction from peanut paçoca saturated with 30–60% ammonium sulfate. AHTI: A. hypogaea L. trypsin inhibitor.
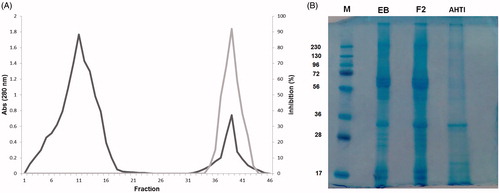
Table 2. AHTI isolation steps.
Effect of temperature and pH on AHTI inhibitory activity
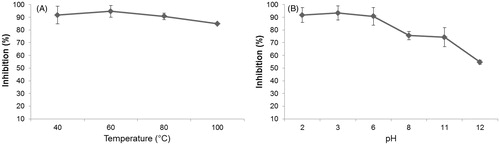
shows that AHTI at temperatures of 60 °C to 80 °C kept its maximum inhibition activity over trypsin (92%). Nevertheless, the inhibitory activity of AHTI against different pH was changed when subjected to pH values greater than 4, resulting in 20% of trypsin inhibition ().
Figure 2. Stability of AHTI from peanut paçoca in different temperatures and pH. (A) 10 μg (0.30 nM) of AHTI was preincubated for 30 min at 37 °C and submitted to different temperatures (40 °C, 60 °C, 80 °C, 100 °C). (B) 10 μg (0.30 nM) of AHTI was incubated for 30 min at 37 °C in different pHCitation2,Citation3,Citation6,Citation8,Citation11,Citation12. The inhibitory activity on trypsin was determined using BApNA as substrate. AHTI: A. hypogaea L. trypsin inhibitor.
Determination of IC50 and Ki against trypsin
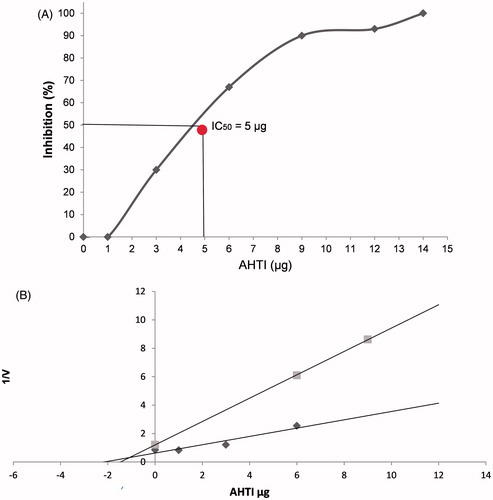
According to the titration curve (), AHTI IC50 is about 0.15 nM (5 µg) and is competitive, according to Dixon et al.Citation27 AHTI inhibits trypsin competitively with a Ki value of 0.085 nM as shown in .
Figure 3. Determination of IC50 and Ki from AHTI from peanut paçoca. (A) AHTI concentration that inhibits 50% of trypsin activity (IC50) was determined using BApNA as substrate and performed using the titration curve with 12.88 µM of trypsin and increasing concentrations of AHTI (0, 1.84, 3.68, 7.35, 11, 14.71, 29.41, and 5.82 nM). (B) The inhibition constant (Ki) of AHTI over trypsin was determined using Dixon et al.Citation27 method. The Ki value was obtained from the intercepts of the two lines of the BApNA concentrations used. The rate of the reaction was determined by V = DO405 nm/h/ml. AHTI: A. hypogaea L. trypsin inhibitor.
Weight gain and food intake in Wistar rats submitted to the diet supplemented with AHTI
In this study, we also evaluated the action of AHTI in weight gain and food intake. Thus, during the 11 d of the experiment, we observed that weight gain in the control group was higher when compared to the AHTI supplemented rats (). Also, food intake was lower in the groups treated with AHTI ().
Figure 4. Weight gain (g/day) of Wistar rats submitted to different diets for 11 d. Diets (100 g): (1) Standard diet + Water – AIN-93G diet, supplemented by oral gavage with water (2) Casein – standard AIN-93G diet, supplemented by oral gavage with 25 mg/kg of casein; (3) Soybean inhibitor – standard AIN-93G diet, supplemented by oral gavage with 25 mg/kg of soybean inhibitor; (4) AHTI (25 mg/kg) – standard AIN-93G diet, supplemented by oral gavage with 25 mg/kg of AHTI; (5) AHTI (50 mg/kg) – standard AIN-93G diet, supplemented by oral gavage with 50 mg/kg. Groups of n = 5 animals. AHTI: A. hypogaea L. trypsin inhibitor. Data expressed as mean ± standard deviation. Different letters indicate statistical difference between the groups with p < 0.05. One-way ANOVA with Tukey’s post-hoc test. f, test calculation.
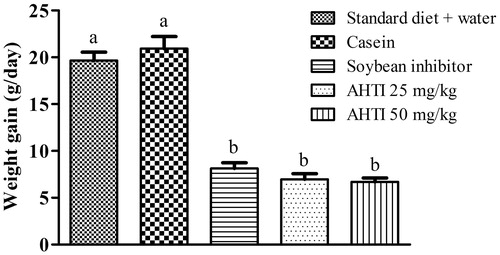
Table 3. Mean food intake (g/day) on day 1, day 5, and day 11 of Wistar rats under standard diet, aproteic diet, and diet supplemented with 50 mg/kg of AHTI for 11 d.
Determination of in vivo protein digestibility
Interestingly, animals supplemented with AHTI, showed less weight gain compared to the control group and no significant statistical differences in true and apparent protein digestibility were identified between the groups receiving casein and AHTI ().
Table 4. True digestibility, apparent digestibility, and biological value in Wistar rats submitted to standard diet, aproteic diet, standard diet + Water, and 50 mg/kg of AHTI for 11 d.
Assessment of biochemical alterations
AHTI decreased fasting glucose in both experiments. No other significant biochemical alterations were observed in animals supplemented with AHTI. Importantly, animals also showed no significant variations between groups for albumin levels ( and ).
Table 5. Biochemical parameters of Wistar rats submitted to standard diet, aproteic diet, and with AHTI diets for 11 d.
Table 6. Biochemical parameters of Wistar rats 1 h after administration of standard diet, or diets supplemented with casein, soybean inhibitor, and AHTI for 11 d.
Assessment of food intake at specific times and CCK alterations
In this model we observed a significant increase in plasmatic CCK in rats supplemented with 25 mg/kg and 50 mg/kg of AHTI (). By analyzing food intake in 1st, 2nd, and 18th h after the administration of the diets we observed greater decrease in food consumption in the groups supplemented with AHTI ().
Figure 5. (A) CCK plasmatic concentrations (pmol/L) 1 h after gavage administration of a single dose of different trypsin inhibitors for 11 d. Diets (100 g): (1) Standard diet + Water – AIN-93G diet, supplemented by oral gavage with water (2) Casein – standard AIN-93G diet, supplemented by oral gavage with 25 mg/kg of casein; (3) Soybean inhibitor – standard AIN-93G diet, supplemented by oral gavage with 25 mg/kg of soybean inhibitor; (4) AHTI 25 mg/kg – standard AIN-93G diet, supplemented by oral gavage with 25 mg/kg of AHTI; (5) AHTI 50 mg/kg – standard AIN-93G diet, supplemented by oral gavage with 50 mg/kg. (B) Reduction in food intake 1 h, 2 h and 18 h after different diet administration for 11 d: Diets (100 g): (1) Standard diet + Water – AIN-93G diet, supplemented by oral gavage with water (2) Casein – standard AIN-93G diet, supplemented by oral gavage with 25 mg/kg of casein; (3) Soybean inhibitor – standard AIN-93G diet, supplemented by oral gavage with 25 mg/kg of soybean inhibitor; (4) AHIT (25 mg/kg) – standard AIN-93G diet, supplemented by oral gavage with 25 mg/kg of AHTI; (5) AHIT (50 mg/kg) – standard AIN-93G diet, supplemented by oral gavage with 50 mg/kg. Groups of n = 5 animals. AHTI: A. hypogaea L. trypsin inhibitor. Results are expressed as mean ± standard deviation. Different letters indicate statistical difference between the groups with p < 0.05. One-way ANOVA with Tukey’s post-hoc test.
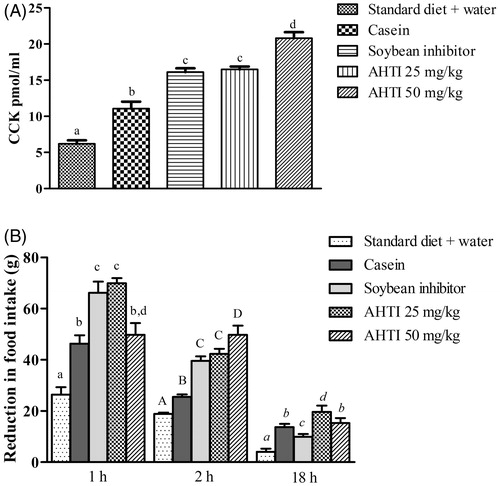
In the present study, the reduction of food intake was higher in the 1st and 2nd h after the administration of inhibitors by gavage, where the 25 mg/kg AHTI group reduced the food intake by 58.3% and 39.1% in the 1st and 2nd h, respectively. The 50 mg/kg AHTI group presented a reduction in food intake of 56.8% and 54.5% in the 1st and 2nd h, respectively. These results were higher than the effect of 25 mg/kg of SBTI (with a reduction in food intake of 35.7% and 53% in the 1st and 2nd h, respectively) and the other studied groups: casein with 27.5% and 22.1% reduction in the 1st and 2nd h and control, with 16.1% and 25.79% reduction in the 1st and 2nd h.
As for serum concentrations of CCK in the studied animals (), increased levels were detected in the test groups when compared to the control group (5.92 ± 1.15 pmol/L). The highest values were for groups submitted to diets with 25 and 50 mg/kg of AHTI, of 16.15 ± 1.13 pmol/L and 21.33 ± 2.12 pmol/L, respectively.
Discussion
In the present study, a new trypsin inhibitor was identified and isolated from peanut paçoca, a typical Brazilian sweet. There are reports of other trypsin inhibitors that have been purified, with molecular weights of varying sizesCitation12–14, but none with the same mass presented in this study.
AHTI, similarly to other purified and characterized trypsin inhibitorsCitation30,Citation31, was thermo-resistant, keeping its total inhibitory activity on the enzyme trypsin activity. This explains why, surprisingly, the trypsin inhibitor in peanut paçoca, an industrialized food product, did not lose its activity by the processes by which it was submitted (denaturation). This stability is probably due to the presence of disulfide bridges between polypeptide chains of AHTI proteinsCitation32. Nevertheless, this must be tested. It is noteworthy that the stability of proteins is important for the development of new products and biotechnological applications at the industrial level.
AHTI is competitive, according to Dixon et al.Citation27, as other trypsin inhibitors previously describedCitation3,Citation14. In this type of inhibition, the effect is reversed by increasing the substrate concentration. Therefore, the mechanism of inhibition is dependent on the substrate and inhibitor concentrations. It is known that many drugs routinely used have their action based on competitive inhibition of specific enzymesCitation33. Norioka et al.Citation13 purified and characterized peanut protease inhibitors (AI, A-II, BI, B-II B-III) with Ki values ranging between 1.4 and 4.4 × 10⁻⁷ M. Thus, AHTI has a higher affinity for bovine trypsin when compared to other trypsin inhibitors previously reported in the literature.
We have previously shownCitation11 that the consumption of peanut paçoca helped to reduce weight gain. Thus, in the present study we evaluated the action of AHTI isolated from paçoca in weight gain and food intake, finding that the supplementation with AHTI decreased both weight gain and food intake. We also analyzed the protein digestibility in rats supplemented with AHTI. The intention was to assess whether the reduction in weight gain was due to malnutrition caused by lower protein availability in the presence of AHTI or if the effect in reducing weight gain was, in fact, due to the satiety promotion by AHTI. Interestingly, AHTI did not negatively influence the use of proteins provided by the diet. Indeed, some authors suggest that there is a compensation of the inhibition of trypsin in the gut, affecting the enzyme stability by increased secretion and increased absorption of proteins in the distal gutCitation34, which may have occurred in the experiment.
Furthermore, according to the results shown by SgarbieriCitation35, purified diets containing trypsin inhibitor from Rosinha G2 bean (Phaseolus vulgaris L.) administered in Wistar rats had no additional effect on protein digestibility and, as expected, the intestinal protease activity was not affected by diet trypsin inhibitor. However, according to Peace et al.Citation36, Wistar rats fed SBTI showed a reduction in weight gain, feed efficiency, but also reduced the digestibility when compared to a control group receiving casein.
Strikingly, our results have shown that AHTI has a potential to reduce fasting glucose. Other biochemical parameters in both experimental models showed little difference between the groups, with most of the values within normal rangesCitation37–39. Other studies with Wistar ratsCitation36,Citation40 and also with Swiss miceCitation41 revealed no changes in lipid profile, as well as the dosages of glucose and transaminasesCitation20,Citation40,Citation42. As for AST and ALT, it is known that they have similar functions and its elevation in serum has been widely used as an indicator of hepatotoxicity or hepatocellular injuryCitation42. These data corroborate the fact that AHTI caused no cytotoxic effect at the studied doses and conditions. The animals also showed no statistically significant variations between groups for albumin levels, corroborating the fact that the animals did not show malnutrition and lost weight by reducing food consumption.
To corroborate the hypothesis that the reduction in weight gain promoted by AHTI was due to satiety promotion, a second experimental model to assess CCK production was done. In this model, we observed a significant increase in plasmatic CCK in rats supplemented with AHTI when compared to the other studied groups, which suggests that AHTI is a protein with a potential satietogenic effect.
Similar results were also observed in animals fed diets containing concentrated protease inhibitors (PPIC) (100 mg/kg)Citation40, SBTI (100 mg/kg)Citation43, potato protein extract (Potein) (100 mg/kg, 200 mg/kg, and 400 mg/kg)Citation19 and Potein® (1.0 and 1.5 g/kg)Citation17, all administered by gavage, and in humans subjected to a proteinase inhibitor extracted from potatoes (POT II)Citation18.
In the present study, the reduction of food intake was higher in the 1st and 2nd h after the administration of inhibitors by gavage, where the 25 and 50 mg/kg AHTI group reduced the food intake in the 1st and 2nd h.
These results were similar to those reported for oral administration of Potein wherein three different concentrations were tested (100 mg/kg, 200 mg/kg and 400 mg/kg) and SBTI (100 mg/kg), with a decrease in food consumption between the 1st and the 3rd hCitation19. Similarly, in another study in rats, Potein® also caused reduced food consumption, though the quantities used were higher (1.0 and 1.5 g/kg)Citation17. In other studies, such as with PPIC, in 10 d of experiment, there was a cumulative decrease in food intakeCitation40. The authors concluded that this decrease in food intake was due to the presence of the trypsin inhibitor, which would provide a satietogenic effect, especially between the 1st and 3rd h after the administration of the trypsin inhibitor.
As for serum concentrations of CCK in our study, increased levels were detected in the test groups when compared to the control group. This result represents an increase of almost 250% with the administration of 50 mg/kg AHTI. Comparing the data of the administration of 25 and 50 mg/kg of AHTI, may indicate that possibly there is saturation in the satiety response to the concentration of CCK.
Some studies also show that there was increased plasma CCK when rats were fed diets with protein and trypsin inhibitorCitation17,Citation18,Citation20,Citation40,Citation43. In these studies, the diets were supplemented with 100 mg/kg of casein and 100 mg/kg of PPIC which resulted in an increase of approximately 2–4 pmol/L of plasma CCK after 15 minCitation40.
A study with synthetic protease inhibitors (20 mg/kg) also induced a significant increase in basal CCK from 2.59 pmol/L to 27.6 pmol/L in the 1st h and a decrease to 15.8 pmol/L in the 2nd hCitation44.
In humans, the effect of POT II, which increases CCK release, was evaluated on food intake in 11 lean individuals. They received 1.5 g of POT II in a soup rich in protein (70 kcal). Those who consumed the soup alone showed no significant reduction in energy consumption, while those who consumed the soup with POT II presented a reduction in energy intake of 17.5%Citation18.
Conclusions
The experimental administration of AHTI, a new trypsin inhibitor isolated from peanut paçoca, caused a reduction in food consumption, which resulted in a reduction in weight gain. AHTI also reduced fasting glucose. No other changes in the analyzed biochemical parameters were observed. The reduction in food intake was mediated by increased levels of CCK, once the inhibitor did not cause protein loss. This puts AHTI as a potential natural product for the prevention and/or treatment of obesity and obesity related hyperglycemia. However, more studies are needed to better understand the molecular basis for the increase in CCK and decrease in glucose seen in the present study. Also, further researches in humans are needed to corroborate the effect on human CCK and define the necessary AHTI doses.
Declaration of interest
We have no conflict of interest to declare. In memorian to Mauricio Pereira de Sales who encouraged the development of this work. This project was financially supported by the National Council for Scientific and Technological Development (CNPq-Brazil) – Universal 14/2013 – Process: 483710/2013-0 and was granted research grant by the National Council for the Improvement of Higher Education (CAPES-Brazil).
References
- Brasil. Vigitel Brasil 2013: vigilância de fatores de risco e proteção para doenças crônicas por inquérito telefônico. Brasília: Ministério da Saúde; 2014
- Instituto Brasileiro de Geografia e Estatística. Pesquisa de Orçamentos Familiares 2008–2009: antropometria e estado nutricional de crianças, adolescentes e adultos no Brasil; 2010
- WHO. Appropriate body-mass index for Asian populations and its implications for policy and intervention strategies. Lancet 2004;363:157–63
- Bernard MM, Spinosa HS, Ricci EL, Reis-Silva TM. Preclinical study of an antiobesity herbal medicine, PholiaNegra (X′Tract Vetorized)™, in male and female rats fed with high-fat diet: comparison with sibutramine. J Health Sci Inst 2012;30:406–10
- Astell K, Mathai M, Su X. A review on botanical species and chemical compounds with appetite suppressing properties for body weight control. Plant Foods Hum Nutr 2013;68:213–21
- Marrelli M, Loizzo M, Nicoletti M, et al. Inhibition of Key enzymes linked to obesity by preparations from Mediterranean dietary plants: effects on α-amylase and pancreatic lipase activities. Plant Foods Hum Nutr 2013;68:340–6
- Lima LM, Morais AHA. Propriedades nutracêuticas do amendoim. O Agronegócio do Amendoim no Brasil. 2nd ed. 2013. p. 467–98
- Traoret CJ, Lokko P, Cruz AC, et al. Peanut digestion and energy balance. Int J Obes (Lond) 2008;32:322–8
- Companhia nacional de abastecimento. Acompanhamento da safra brasileira; 2012
- Devitt AA, Kuevi A, Coelho SB, et al. Appetitive and dietary effects of consuming an energy-dense food (peanuts) with or between meals by snackers and nonsnackers. J Nutr Metab 2011;2011:1–9
- Serquiz AC, Sátiro DSP, Lima VCO, et al. The effect of a high calorie diet containing a peanut candy on weight loss. Int Food Res J 2016;23
- Dodo HW, Viquez OM, Maleki SJ, Konan KN. cDNA clone of a putative peanut (Arachis hypogaea L.) trypsin inhibitor has homology with peanut allergens Ara h 3 and Ara h 4. J Agric Food Chem 2004;52:1404–9
- Norioka S, Omichi K, Ikenaka T. Purification and characterization of protease inhibitors from peanuts (Arachis hypogaea). J Biochem 1982;91:1427–34
- Maleki SJ, Viquez O, Jacks T, et al. The major peanut allergen, Ara h 2, functions as a trypsin inhibitor, and roasting enhances this function. J Allergy Clin Immunol 2003;112:190–5
- Tur-Sinai A, Yehudith Birk A, Gertler Rigbi M. A basic trypsin and chymotrypsin-inhibitor from groundnuts (Arachis hypogaea). Biochim Biophys Acta 1972;263:666–72
- Araújo JM, Alves JC, Peixoto TKON, et al. Determinação da atividade antitríptica em proteínas de produtos do amendoim isoladas por cromatografia de afinidade. Quim Nova 2014;37:1618–23
- Chen W, Hira T, Nakajima S, et al. Suppressive effect on food intake of a potato extract (Potein®) involving cholecystokinin release in rats. Biosci Biotechnol Biochem 2012;76:1104–9
- Hill AJ, Peikin SR, Ryan CA, Blundell JE. Oral administration of proteinase inhibitor II from potatoes reduces energy intake in man. Physiol Behav 1990;48:241–6
- Nakajima S, Hira T, Tsubata M, et al. Potato extract (Potein) suppresses food intake in rats through inhibition of luminal trypsin activity and direct stimulation of cholecystokinin secretion from enteroendocrine cells. J Agric Food Chem 2011;59:9491–6
- Ribeiro J, Serquiz A, Silva P, et al. Trypsin inhibitor from Tamarindus indica L. seeds reduces weight gain and food consumption and increases plasmatic cholecystokinin levels. Clinics 2015;70:136–43
- Amendoim: Propriedades Funcionais [Internet]. 2011. [cited 2014 Oct 1]; Available from: http://www.abicab.org.br/amendoim/dicas-3/
- Bradford MM. A rapid and sensitive method for the quantitation of microgram quantities of protein utilizing the principle of protein-dye binding. Anal Biochem 1976;72:248–54
- Laemmli UK. Cleavage of structural proteins during the assembly of the head of bacteriophage T4. Nature 1970;227:680–5
- Oakley BR, Kirsch DR, Morris NR. A simplified ultrasensitive silver stain for detecting proteins in polyacrylamide gels. Anal Biochem 1980;105:361–3
- Kakade M, Simons N, Liener I. An evaluation of natural vs synthetic substrates for measuring the antitryptic of soybean samples. Cereal Chem 1969;45:518–26
- Gomes CEM, Barbosa AEaD, Macedo LLP, et al. Effect of trypsin inhibitor from Crotalaria pallida seeds on Callosobruchus maculatus (cowpea weevil) and Ceratitis capitata (fruit fly). Plant Physiol Biochem 2005;43:1095–102
- Dixon M, Webb EC. Enzyme inhibition and activation. New York: Academic Press; 1979;332–81
- Reeves PG, Nielsen FH, Fahey GC. AIN-93 purified diets for laboratory rodents: final report of the American Institute of Nutrition ad hoc writing committee on the reformulation of the AIN-76A rodent diet. J Nutr 1993;123:1939–51
- Amaya H, Acevedo E, Bressani R. Efecto del recalientamiento sobre la disponibilidad de hierro y valor nutritivo de la proteina del frijol negro (Phaseolus vulgaris) cocido. Arch Latinoam Nutr 1991;16:222–37
- Machado RJA, Monteiro NKV, Migliolo L, et al. Characterization and pharmacological properties of a novel multifunctional Kunitz inhibitor from Erythrina velutina seeds. PLoS One 2013;8:e63571
- Araujo CL, Bezerra IWL, Oliveira AS, et al. In vivo bioinsecticidal activity toward Ceratitis capitata (fruit fly) and Callosobruchus maculatus (cowpea weevil) and in vitro bioinsecticidal activity toward different orders of insect pests of a trypsin inhibitor purified from tamarind tree. J Agric Food Chem 2005;53:4381–7
- Santos EA, Oliveira AS, Rabêlo LMA, et al. Affinity chromatography as a key tool to purify protein protease inhibitors from plants. Affinity Chromatography [Internet]. InTech. 2012. p. 212–44
- Li X-Q, Andersson TB, Ahlstrom M, Weidolf L. Comparison of inhibitory effects of the proton pump-inhibiting drugs omeprazole, esomeprazole, lansoprasole, pantoprazole, and rabeprazole on human cytochrome P450 activities. Am Soc Pharmacol Exp Ther 2004;32:821–7
- Krogdahl Å, Lea TB, Olli JJ. Soybean proteinase inhibitors affect intestinal trypsin activities and amino acid digestibilities in rainbow trout (Oncorhynchus mykiss). Comp Biochem Physiol Part a Physiol 1994;107:215–19
- Sgarbieri VC. Propriedades fisico-quimicas e nutricionais de proteinas de feijão (Phaseolus vulgaris, L.) variedade Rosinha G2. Universidade de Campinas; 1979
- Peace RW, Sarwar G, Touchburn SP, Botting HG. Effects of soybean trypsin inhibitors and dl-ethionine on growth and serum parameters in young rats. Nutr Res 1991;11:1197–208
- Giknis MLA. B CC. Clinical Laboratory Parameter for Crl: WI (Han) [Internet]. 2008. p. 2–14. Available from: http://www.criver.com/files/pdfs/rms/wistarhan/rm_rm_r_wistar_han_clin_lab_parameters_08.aspx [last accessed 2 Oct 2014]
- Melo MGD, Serafini MR. Valores de referência hematológicos e bioquímicos de ratos (Rattus novergicus linhagem Wistar) provenientes do biotério central da Universidade Federal de Sergipe. Scientia Plena 2012;8:1–6
- Dantas JA, Ambiel CR, Kenji R, et al. Valores de referência de alguns parâmetros fisiológicos de ratos do, Estado do Biotério Central da Universidade Estadual de Maringá Paraná. Acta Scientiarum. Health Sciences 2006;28:165–70
- Komarnytsky S, Cook A, Raskin I. Potato protease inhibitors inhibit food intake and increase circulating cholecystokinin levels by a trypsin-dependent mechanism. Int J Obes 2011;35:236–43
- Roy DM, Schneeman BO. Effect of soy protein, casein and trypsin inhibitor on cholesterol, bile acids and pancreatic enzymes in mice. J Nutr 1981;111:878–85
- Campello C, Carvalho V, Vieira K. Performance and serum parameters of rats fed on diets containing raw full-fat soybeans. Brazilian J Vet Res Anim Sci 2009;45:188–98
- McLaughlin CL, Peikin SR, Baile CA. Trypsin inhibitor effects on food intake and weight gain in Zucker rats. Physiol Behav 1983;31:487–91
- Yamamoto M, Shirohara H, Otsuki M. Fluid hypersecretion in protease inhibitor-treated rats. Am Physiol Soc 1998;274:406–12