
Abstract
Farnesyltransferase is one of the enzyme targets for the development of drugs for diseases, including cancer, malaria, progeria, etc. In the present study, the structure-based pharmacophore models have been developed from five complex structures (1LD7, 1NI1, 2IEJ, 2ZIR and 2ZIS) obtained from the protein data bank. Initially, molecular dynamic (MD) simulations were performed for the complexes for 10 ns using AMBER 12 software. The conformers of the complexes (75) generated from the equilibrated protein were undergone protein–ligand interaction fingerprint (PLIF) analysis. The results showed that some important residues, such as LeuB96, TrpB102, TrpB106, ArgB202, TyrB300, AspB359 and TyrB361, are predominantly present in most of the complexes for interactions. These residues form side chain acceptor and surface (hydrophobic or π–π) kind of interactions with the ligands present in the complexes. The structure-based pharmacophore models were generated from the fingerprint bits obtained from PLIF analysis. The pharmacophore models have 3–4 pharmacophore contours consist of acceptor and metal ligation (Acc & ML), hydrophobic (HydA) and extended acceptor (Acc2) features with the radius ranging between 1–3 Å for Acc & ML and 1–2 Å for HydA. The excluded volumes of the pharmacophore contours radius are between 1–2 Å. Further, the distance between the interacting groups, root mean square deviation (RMSD), root mean square fluctuation (RMSF) and radial distribution function (RDF) analysis were performed for the MD-simulated proteins using PTRAJ module. The generated pharmacophore models were used to screen a set of natural compounds and database compounds to select significant HITs. We conclude that the developed pharmacophore model can be a significant model for the identification of HITs as FTase inhibitors.
Introduction
Cancer is still one of the life-threatening diseases and the second leading cause of death in the world. Cancer accounted for 8.2 million deaths in 2012 and is expected that the annual cancer cases will rise from 14 million in 2012 to 2022 within the next two decadesCitation1,Citation2. The development of anticancer agents for the successful treatment of cancer remains a challenging goal, because of its nonselectivity, toxicity and poor pharmacokinetic profiles. Hence, medicinal chemists are working on different biological targets to develop novel molecules as anticancer agentsCitation3.
Farnesyltransferase (FTase) is one of three prenyltransferase enzymes (farnesyltransferase (FTase), geranylgeranyltransferase-I (GGTase-I) and geranylgeranyltransferase-II (GGTase-II)) used by normal and malignant cells to catalyze covalent attachment of prenyl groups to >300 polypeptides in the human proteomeCitation4–6. FTase has become a major target in the development of potential anticancer drugs and has also been used as an effective target for the development of drugs against Progeria and parasites diseases, such as P. falciparum-resistant malaria, trypanosomatid infections (African sleeping sickness), Chagas disease, Toxoplasmosis and Leishmaniasis and as antiviral agentsCitation7–14.
FTase modifies the oncogene Ras through the farnesyl pyrophosphate (FPP) intermediate by the farnesylation of a carboxyl terminus protein in the CAAX (tetrapeptide motif) (“C” refers to the cysteine, “A” to any aliphatic amino acid often methionine, and “X” to any amino acid, glutamine or serine in FTase and leucine or phenylalanine in GGTase-1). The G-protein, Ras plays an important role in mediating cellular responses to growth signals and the appearance of its oncogenic mutants is associated to a high percentage of human cancersCitation6,Citation15. It could be related to the development of cancer by mutations in these proteins. The inhibition of FTase enzyme activity can be a better target for anticancer drug development and some FTase inhibitors, such as tipifarnib, lonafarnib, BMS214 662, L7, 78123 and SCH4, 4342 are currently being assessed in clinical trials for the treatment of human cancersCitation6,Citation16,Citation17. Scientists have been working on the drug discovery field, using different approaches for drug discovery. Computational methods are one of the prominent methods used nowadays to reduce the cost and time in the drug development program. Our research group has been working on this target for the last 10 years for the development of FTase inhibitors using computational-based approachesCitation3,Citation6,Citation18.
Generally, computer-aided drug design techniques, such as the structure-based (docking) and ligand-based (pharmacophore, QSAR, etc.) approaches are used to screen a large set of compounds (database libraries) to identify significant HIT compounds for a particular target. Structure-based drug design method does require a three-dimensional (3D) structure of the protein, acquired by means of several techniques, including electron microscopy, atomic force microscopy, X-ray crystallography and NMR spectroscopy, or by computational methods, for example, homology modeling. The molecular docking is one of the well-known methods used in structure-based drug design approaches. The ligand-based drug design approaches are used when 3D structure of the protein is not available; however, it considers compounds (especially active compounds) those have activity on the particular target. The QSAR, pharmacophore analyses are best-suited techniques applied for ligand-based analysisCitation19–26. In the present investigation, we have applied both structure- and ligand-based drug design approaches to generate structure-based pharmacophore models to identify the FTase inhibitors from data set of natural compounds.
As per IUPAC, pharmacophores are defined as “an ensemble of steric and electronic features, that is, necessary to ensure the optimal supramolecular interactions with a specific biological target and to trigger (or block) its biological response”. Basically, this pharmacophore approach adheres to the premise that related chemical groups (i.e., hydrogen bond donors/acceptors, aromatic rings, and so forth) for a set of known active molecules that are analyzed in 3D space which are responsible for specific drug–receptor interactionsCitation27,Citation28. The drawback of the ligand-based method is that they do not provide detailed structural information (receptor binding) to help medicinal chemists to design new molecules.
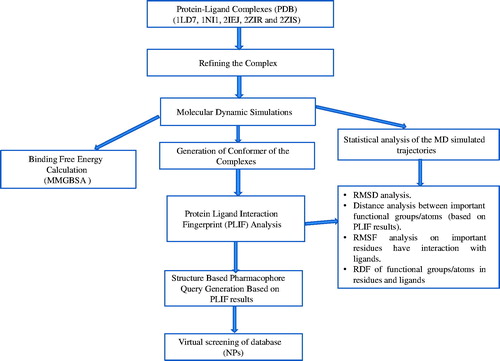
The structure or receptor-based pharmacophore models provide an efficient alternative to docking-based virtual screening of small molecules, still representing specific ligand–protein interactionsCitation19–26. The generation of pharmacophore models directly from the complex crystal structures is more reliable because it imposes the necessary constraints required for interaction and selectivityCitation20. The protein–ligand-derived pharmacophores was applied by Langer et al. in order to identify potential targets of bioactive ligands in a series of retrospective screening experiments focusing on small protein–ligand matricesCitation21,Citation22. The advanced experimental techniques, such as X-ray crystallography and NMR, are available for the determination of a protein structure, and hence, the reliable and robust techniques to construct pharmacophores from a receptor structure is importantCitation23,Citation24. The addition of exclusion volume spheres to the structure-based pharmacophore models onto the coordinates defined by protein side chain atoms to characterize inaccessible areas for any potential ligandCitation26. With the consideration of this concept, in the present investigation, we have developed robust structure-based pharmacophore models from five X-ray crystallographic complexes obtained from protein data bank. The conformers of the complexes were generated from the equilibrated state of the complexes obtained through MD simulations. These conformers were considered for the structure-based pharmacophore model generation and those pharmacophore models were used to virtual screen a data set of compounds. This work has been performed as per the flow chart provided in .
Figure 1. Flow chart of the work.
Experimental
Protein preparation
The X-ray crystallographic structure of protein–ligand complexes of FTases were obtained from protein data bank. The complexes 1LD7 (resolution 2 Å) and 2IEJ (resolution 1.8 Å) were obtained from human FTase and 1NI1 (resolution 2.30 Å), 2ZIR (resolution 2.40 Å) and 2ZIS (resolution 2.60 Å) were derived from rat FTaseCitation29 (Supplementary Table S1). These complexes were used for MD simulations, Gibbs binding free energy calculation, protein–ligand interactions fingerprint (PLIF) analysis, structure-based pharmacophore development and screening of compounds.
MD simulations
The AMBER 12 molecular dynamics packageCitation30 was used in all the MD simulations performed. Conventional protonation states for all amino acids at pH 7 were considered. All the hydrogen atoms were added and counter-ions (Na+) were employed to neutralize the highly negative charges of the systems. The Leap program was used for this purpose. Each of these systems was then placed in rectangular boxes containing a minimum distance of 12 Å of TIP3P water molecules between the enzyme and the box side. The size of these five systems was of ca 100 000 atoms.
A set of parameters specifically designed to allow a reliable treatment of the Zn2+ coordination sphere formed during catalysis and based on DFT (B3LYP) and molecular mechanical calculationsCitation31, crystallographic dataCitation32–34, extended X-ray absorption fine structure (EXAFS) resultsCitation35 and on several other more recent mechanistic studiesCitation36,Citation37 were applied to the systems in study. These parameters are described in detail elsewhereCitation38 and have been already used with success in the study of FTaseCitation38–40. The AMBER ff12SB parameters were employed to describe the remaining of the proteins, while the ANTECHAMBER module of AMBER and the General AMBER Force Field (GAFF) were used to parameterize the inhibitors, and the charges derived with RESP at the HF/6–31G(d) level of theoryCitation30,Citation41.
All systems were subjected to a four stages refinement protocol using the SANDER module of AMBER 12, in which the constraints on the enzyme were gradually removed. In the first stage (2000 steps) 50 kcal/mol/Å2 harmonic forces were used to restrain the positions of all atoms in the systems except those from the water molecules. In the second stage (4000 steps), these constraints were applied only to the heavy atoms and in the third stage (8000 steps) were limited to the Cα and N-type atoms (backbone α-carbon and nitrogen atoms). This process ended in a full-energy minimization (4th stage, maximum 50 000 steps) until the rms gradient was smaller than 0.0002 kcal/mol.
MD simulations were carried out using the PMEMD module of AMBER 12 and considering periodic boundary conditions to simulate a continuous system. The SHAKE algorithm was applied to fix all bond lengths involving a hydrogen atom, permitting a 2-fs time step. The Particle-Mesh Ewald (PME) method was used to include the long-range interactions, and a nonbond interaction cutoff radius of 10 Å was considered. Following a 500 ps equilibration procedure, 10 ns MD simulations were carried out at 310 K using the Langevin temperature coupling scheme at constant pressure (1 atm) with isotropic molecule-based scaling, resulting in a total simulation time of 50 ns. The MD trajectory was sampled every 2.0 ps. All of the MD simulations were analyzed with the PTRAJ module of AMBER 12, with values retrieved from the last 8 ns of the simulation.
PLIF analysis
The MD simulations of the proteins were performed till the backbone α-carbons (Cα) were stable (10 ns MD simulations). The conformers (75–80 conformers for each complex) created from the MD simulated proteins at the stable time (equilibration) were collected using VMD softwareCitation42 and those conformers were used for the PLIF analysis. Other than the conformers of the complexes, the PLIF was analyzed on the raw X-ray crystallographic structure (protein–ligand complexes) obtained from protein data bank. The PLIF module in MOE softwareCitation43 was used for the analysis. It provides important protein–ligand interaction residues commonly present in the superimposed/overlaid complexes/conformers obtained from the complex structures. PLIF possesses a composition of seven visible fingerprint bits (side-chain hydrogen bond donor (D), side-chain hydrogen bond acceptor (A), backbone hydrogen bond donor (d), backbone hydrogen bond acceptor (a), solvent hydrogen bond (O), ionic attraction (I) and surface contact (C)). The hydrogen bond fingerprints are calculated using a method based on protein contact statistics, whereby a pair of atoms is scored by distance and orientation. Ionic interactions are scored by calculating the inverse square of the distance between atoms with opposite formal charge (e.g. a carboxylate oxygen atom and a protonated amine). Surface contact interactions are determined by calculating the solvent-exposed surface area of the residue, first in the absence of the ligand, then in presence of the ligandCitation44,Citation45.
Structure-based pharmacophore generation
Structure-based pharmacophore queries were developed for the complexes (all five complexes) and species (rat and human) individually from the PLIF results. It considers actual structural information (fingerprint bits) obtained directly from the protein–ligand interactions in 3D space. The pharmacophore query generator tool in the module operates on the principle that a modest selection of poses with a homogeneous set of interaction fingerprints, most likely possess a homogeneous set of pharmacophore feature points. The pharmacophore feature points can be groups and filtered according to which they interact with and those with a sufficiently tight grouping can be converted into a pharmacophore query feature. The excluded volume of the pharmacophore query points was also included in the structure-based virtual screening of the molecules. The details of the query points generated and used in the screening are provided in . The following pharmacophore query structures were developed; the conformers of individual complexes (Ph-1LD7, Ph-1NI1, Ph-2IEJ, Ph-2ZIR and Ph-2ZIS), proteins from rat FTase (Ph-rat), human FTase (Ph-human) and both rat and human FTase complexes (Ph-all). The developed pharmacophore query models were validated using FTase inhibitors in clinical use (tipifarnib, lonafarnib and L7,78123) and some known natural product based FTase inhibitors. Further, the validated pharmacophore models were used to screen a data set comprised of 100 natural products compounds. Additionally 1000 synthetic FTase inhibitors from literatures and a data set compounds from binding database (http://www.bindingdb.org/bind/index.jsp) were screened on the developed pharmacophore models.
Table 1. Details of the pharmacophore query points in the structure-based pharmacophore models.
FTase-binding assay
In a 96-well black plate, 10 μL of stock solution of FPP, recombinant FTase (100 nM) and compound (1–50 μM) separately. Adding 150 μL of Tris buffer (pH = 7) to the well and mixed well to initiate the FTase reaction. The time course fluorescence change at 520 nm (ex: 340 nm) was monitored at 30 °C using a microplate reader.
Results and discussion
In the present study, MD simulations and structure-based pharmacophore analysis were performed on five crystallographic structures of human (1LD7 and 2IEJ) and rat (1NI1, 2ZIR and 2ZIS) FTase enzymes. The MD simulations were performed using AMBER 12 software for 10 ns for each complex. The simulated systems (equilibrated) were used for conformer generation, PLIF analysis and structure-based pharmacophore generation. These pharmacophore models were used for virtual screening of a data set made of natural compounds.
The X-ray crystallographic complexes obtained from the protein data bank composed of the protein, substrate and the inhibitors. The complexes, such as 1LD7, 2ZIR and 2ZIS, are having FPP as substrate and other complexes, such as 1NI1 and 2IEJ, have α-hydroxy farnesylphosphonic acid and [(3,7,11-trimethyl-dodeca-2,6,10-trienyloxycarbamoyl)-methyl]-phosphonic acid, respectively, as substrates. The MD-simulated complexes were statistically analyzed with root mean square deviation (RMSD), root mean square fluctuation (RMSF), distances and radial distribution function (RDF).
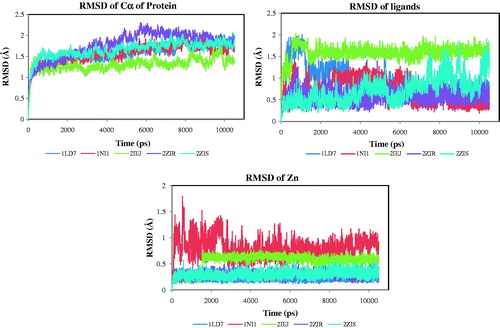
RMSD analysis performed for Cα, substrates, Zn2+ and inhibitors illustrate that the Cα in proteins and the ligand molecules (inhibitors) showed variation in the RMSD values with time in all the MD simulations performed. The results established that the studied systems are well equilibrated after the initial 2 ns MD simulations (). In agreement with this observation, all simulations were taken into consideration for the calculation of the statistical mechanical values of the systems. The last 8 ns which are equilibrated after the MD simulations were used to derive different conformer of the complexes for the PLIF analysis. In order to investigate the binding interactions of the best conformers of the inhibitors, the average protein structure was calculated from the created MD simulations. The conformers that showed lowest RMSD values were used to analyze the binding interactions of the molecules. The best conformers of the ligands in the complexes exhibited the RMSD values of 0.64, 0.80, 0.60, 0.63 and 0.62 Å for 1LD7, 1NI1, 2IEJ, 2ZIR and 2ZIS respectively (Supplementary Figure S1). These best conformers showed that the TyrB361 have hydrogen-bonding interaction with the nitrile (CN) group and have surface type interaction with the imidazole or phenyl rings present in the inhibitors. The nitrogen atoms in the imidazole or methyl imidazole ring form acceptor interaction with the Zn2+ present in the protein. Further, the binding mode of the ligands was analyzed detail by generating conformers of the ligands at different snaps of the MD simulated proteins. These developed conformers were used for PLIF analysis and to generate structure (receptor) based pharmacophore generation.
Figure 2. RMSD of protein, ligand and Zn2+.
PLIF analysis
The PLIF analysis is a method to study the interaction between the residues in the protein and the ligands on a superimposed structure of the complexes. The derived fingerprint bits are used to investigate the common residues that interact with the ligand and those were used for the development of structure based pharmacophore queries (models). In this study, we were used five FTase–ligand complexes obtained from protein data bank (as mentioned earlier), for MD simulations. Among these complexes, three complexes are belonging to rat FTase and two complexes belong to human FTase enzymes. The PLIF analysis was performed on the five complexes together (the raw complex structures from data bank) and individually the complexes of the rat and the human FTases. The conformers of the ligands were derived from the MD simulated complex from the last 8 ns simulation time on the equilibrated state. The PLIF analysis performed on the 75 conformers for each complex derived from MD simulations ().
Table 2. important residues and its type of interactions obtained from the PLIF analysis.
The PLIF analysis performed on the rat protein and human protein complexes (only the coordinate conformers from X-ray crystallographic structures) showed that the ligand in both kind of complexes (rat and human) have interaction commonly with Tyr166, ArgB202 and TyrB361 through surface and side-chain acceptor interactions. The rat FTase additionally showed specific interactions with TyrB93, LeuB96, TrpB106 and AspB359 by surface interactions and the later one (AspB359) provided side-chain acceptor interaction. The human FTase showed in addition to the common residues provided earlier, LeuB99 and TrpB102 have surface interactions (with phenyl group or aliphatic chain) with the ligand molecules. The PLIF analysis performed with the superimposed complexes of both enzymes (rat and human) provided the same type of interaction fingerprints those were obtained from the individual type of proteins (rat and human). The original residual number and its corresponding common number are provided in .
Table 3. Summary of the common residue names and its type of interactions.
In order to analyze further, 75 conformers created from the MD-simulated complexes of each protein were used to analyze specific type of interactions for individual compounds. The conformers were overlaid separately for the interaction analysis and the results are provided in and graphically represented in . The results showed that some important residues, such as LeuB96, TrpB102, TrpB106, ArgB202, TyrB300, AspB359 and TyrB361, are predominantly present in most of the complexes for interactions. The LeuB96 makes surface interaction (solvent exposed surface) type of interaction with the ligand in all the complexes. The residue TrpB106 also provided interaction fingerprints with all the ligands, which form side-chain acceptor (the OH groups of this residue) and surface type of interaction with the ligands (with aromatic ring). Another tryptophan residue, TrpB102 has interacted with the ligands in 2ZIR, 2IEJ and 2ZIS through surface interaction on the aromatic rings or aliphatic chains present in the ligands and the residues. TyrB300 and TyrB361 are forming surface and side-chain acceptor interactions with the ligands in all the complexes (except 2IEJ for TyrB300). The later residue (TyrB361) also provided an interaction fingerprints on the backbone acceptor interactions.
Figure 3. PLIF results: Graphical representation of protein-ligand interactions.
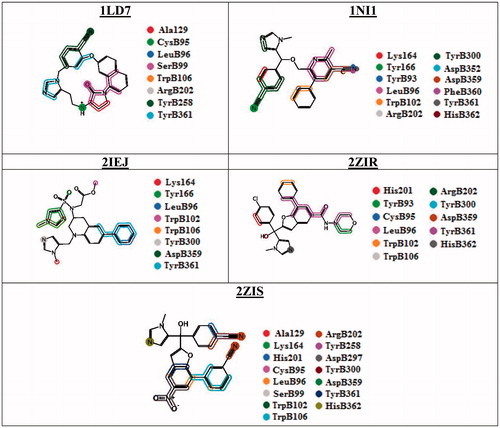
ArgB202 has interacted with all the ligands in the complexes except 2IEJ and the nitrogen atoms (guanidinium) in the residue make side-chain acceptor interaction with the ligands and also observed a surface interaction on this functional group. AspB359 formed surface interaction with the ligand and this interaction is absent in 1LD7. The interaction residues revealed that the complexes, such as 1NI1, 2ZIR and 2ZIS, are belonging to the FTase enzyme of rat and which showed the same type of interaction with 90% of the residues. HisB362 is a residue has coordination bonding with the Zn2+ and has interacted with the ligands present in rat FTase. The ligands from the complexes of human enzyme (1LD7 and 2IEJ) possessed limited common residues (LeuB96, TrpB106 and TyrB361) for the interaction as the rat enzyme. Additionally, the 2IEJ complex interacted with Lys164 and Tyr166 residues by surface and side-chain acceptor interactions. The conformers obtained from 1LD7 provided interaction specifically with Ala129 through surface interaction. Furthermore, these conformers have interacted with CysB95, SerB99 and TyrB258 through side-chain acceptor and surface interactions, which are also observed on the ligand in 2ZIS. The PLIF analysis performed on the conformers derived from the MD simulated complex showed that some common residual interactions observed on both rat and human FTase enzymes.
The interaction points of the residues in the ligands are graphically represented in . The Tyr166, ArgB202 and TyrB361 residues form hydrogen-bonding interaction with the nitrogen atom of the nitrile groups in the molecules. The imidazole or methyl imidazole rings form π–π interaction (surface or hydrophobic interactions) with the aromatic rings in the aromatic amino acids (especially, Tyr166 and TyrB361). The phenyl rings present in the ligands form π–π interaction with the hydrophobic or aromatic rings in the amino acids (leucine and tyrosine). Ketone groups and other polar groups (SO2, NO, OH, etc.) present in the molecules have some hydrogen-bonding interactions with polar residues (oxygen and nitrogen atoms) present in the proteins.
Distance analysis
In order to understand the interactions between the specific groups/atoms in the ligands, those have shown protein–ligand interaction fingerprint bits with the residues, the distance between them were analyzed on the MD simulated proteins using PTRAJ module of AMBER 12 ()Citation30,Citation46. The distance between the Zn2+ and the nitrogen atom present in the imidazole or methyl imidazole rings were analyzed which showed that the distance between these atoms are almost stable below the distance of 3 Å throughout the MD-simulated time for 1NI1, 2ZIR and 2ZIS complexes. The distance between these atoms are varying lot for those complexes from human enzyme (1LD7 and 2IEJ), while it is stable for the rat FTase complex. It is showing that the ligands in the complexes (1NI1, 2ZIR and 2ZIS) have a stable interaction with the Zn2+ ion than the human FTase. The distance between the hydrogen atom in guanidinium group in the ArgB202 with the nitrogen atom in nitrile groups in the ligands such as 1NI1 (interact with both hydrogen atoms in NH of the guanidinium group) because it also has surface type interactions and 2ZIS (the ligand have two nitrile groups). The figure showed that the nitrile group 1 has better interaction with the ArgB202 and the nitrile group 2 has little interaction with the hydrogen atom of the guanidinium group. The nitrile group in the 1NI1 complex has interacted with the hydrogen atoms (in NH) of the guanidinium group with equal distance. The figure reveals that the distance between the atoms have been increased after 7 ns from the distance of 2 Å. This result reveals that when a ligand has two nitrile groups one nitrile group interacts with the ArgB202 and the other do not (other nitrile group interact with OH group present in TyrB300 or TyrB361).
Figure 4. Distance between protein and ligands from MD simulations.
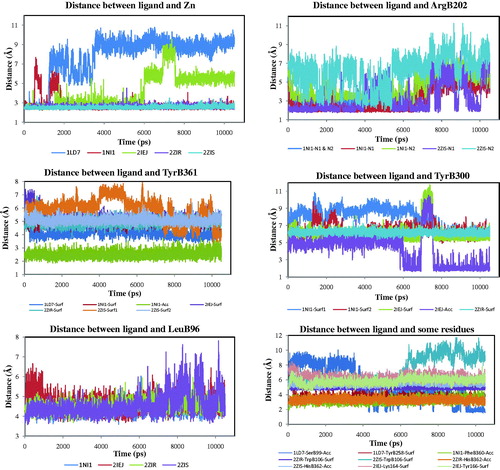
The distance between the phenyl ring in the TyrB361 with the aromatic ring in the ligand was calculated, because these compounds showed surface interaction in the PLIF analysis. The average distance between the atoms (carbon) in phenyl ring of the TyrB361 and the atoms in the aromatic rings in the ligands are ranging between 4 and 7 Å. Additionally, the distance between the nitrogen atom in the nitrile group of the ligand (in 1NI1) with the hydrogen atom in hydroxyl group of the tyrosine moiety (TyrB361). The acceptor type of interaction observed between these groups is stable at the distance below 3 Å. The distance calculated for the complexes except 1LD7 with the aliphatic chain of LeuB96 and the atoms in aromatic rings or the hydrophobic atoms are between 4–6 Å. There is an acceptor kind of interaction observed between the hydrogen atom in the hydroxyl group of TyrB300 with the nitrogen atom in the imidazole ring of the ligand in complex 2IEJ, which has showed the distance below 3 Å after 6 ns simulation. However, the same residue has also show surface interaction between the atoms in phenyl ring and the atoms in the aromatic ring of the ligands in 1NI1, 2IEJ and 2ZIS complexes. The results showed that the ligand in 1NI1 has larger distance than other complexes (5–9 Å).
The oxygen atoms in some functional groups such as C=O, SO2, NO, OH and other polar groups in the ligands have shown acceptor type interactions with the polar groups (OH, NH2, –NH, S, etc.) in some residues. In the complex 1LD7, the distance between the oxygen atom in keto group of the ligand with the hydrogen atom in hydroxyl group of the SerB99 showed < 3 Å and is <2 Å after 8 ns. A surface interacting group such as atoms in the pyrrolidine ring with the atoms in the aromatic ring of the TyrB258 showed the distance >5 Å. In 1NI1, the distance between the nitrogen atom in nitrile group in the ligand with the hydrogen atom in amino group in the PheB360 is <3 Å. In case of 2IEJ, the distance between the aliphatic group in the Leu164 with the atoms in the phenyl ring of the ligand and the atoms in phenyl ring in the Tyr166 with morpholine ring in the ligand are between 5–8 Å. The distance between the hydrogen atom in the NH group (in ring) in HisB362 of the complexes such as 2ZIR and 2ZIS were calculated with the nitrogen atom in the imidazole ring, which is <4 Å. Further, the atoms in the phenyl ring in the TrpB106 of 2ZIR and 2ZIS were analyzed with the atoms in the phenyl ring in the ligands. The distance analysis results reveal that the average distance on the surface interactions (aromatic rings) are between 4 and 10 Å and the acceptor groups provided the distances below 3.5 Å throughout the MD-simulated time.
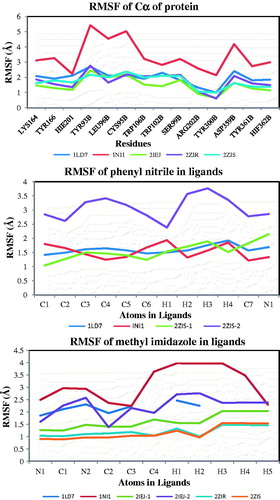
RMSF analysis
RMSF analysis allows an identification of the more flexible regions and also a comparison of the relative flexibility of different regions of a systemCitation46,Citation47. In this analysis, we have analyzed some important residues, which have interaction with the ligand molecules on different complexes (analyzed through PLIF studies). The important residues, such as Lys164, Tyr166, His201, TyrB93, LeuB96, CysB95, TrpB106, TrpB102, SerB99, ArgB202, TyrB300, AspB359, TyrB361 and HisB362, have significant interaction with the ligands in all the complexes. The RMSF values of these residues for all the complexes except 1NI1 is below 2 Å. The complex 1NI1 showed large variation of flexibility especially in the TyrB93, LeuB96 and CysB95 residues than other residues (). The PLIF results for these residues showed that the interaction with CysB95 is absent and LeuB96 is significant. Also, the RMSF values for the atoms in the phenyl nitrile groups of the ligands are analyzed. The results provided in figure showed that the ligands in complexes, such as 1LD7, 1NI1 and 2ZIS (2 phenyl nitrile groups), have the RMSF values less than 2 Å. The second phenyl nitrile group in the ligand in the 2ZIS has larger RMSF value than other ligands. The nitrogen atom in the nitrile group has changed the flexibility than the phenyl ring. In the same way, the RMSF values of the atoms in the imidazole/methyl imidazole rings were also calculated. The methyl imidazole rings in the 1NI1 is having the RMSF value between 2 and 4 Å. The nitrogen and the carbon atoms in the imidazole ring have low RMSF values than the hydrogen atoms in the ring. The methyl group (C4) connected with the imidazole ring have larger RMSF value than the carbon atoms of the imidazole ring in the ligands.
Figure 5. RMSF of important residues in protein and interaction functional groups in ligands.
RDF analysis
The RDF (or pair correlation function) g(r) in a system of particles (atoms, molecules, colloids and so forth), describes how density varies as a function of distance from a reference particleCitation46–48. In this analysis, the RDF of water around some important functional groups in the ligands and the residues has shown interactions as studied through PLIF (). A more comprehensive analysis of figure and all the structural elements considered at this level present a possible relation with the RDF analysis of water around some polar functional groups (CN, SO2, C = O, NO, N+) and OH groups in TyrB361 and NH in guanidinium group in ArgB202. Generally, these functional groups possessed acceptor type of interaction.
Figure 6. RDF analysis of functional groups in residues and ligands.
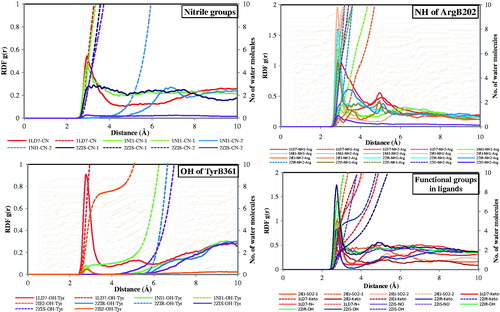
The density of water around the nitrile groups in the ligand and weather they interact with the water molecules were analyzed through RDF calculation. The figure developed for the RDF of nitrile groups in the molecules showed that the ligands in 1LD7, 1NI1 and 2ZIS are having nitrile group in their structures and showed a sharp peek at 2.8 Å for the nitrile groups in the ligands in 1LD7 and 1NI1. The second nitrile group in the ligand in 1NI1 has shown no interaction with the water molecule. In the same way, the second nitrile group in the ligand present in 2ZIS complex also do not have any interaction with the water molecules. These results revealed that there is a specific interaction exists between the hydrogen atoms of the water molecules and the nitrile groups of the ligand. This reveals that the nitrile groups in the molecules projected into the water accessible area for polar interactions.
These nitrile groups also interact with the hydrogen atom present in the OH groups of the tyrosine residues as revealed by the PLIF analysis. It reveals that the water molecules present in the space between the hydroxyl group of the tyrosine and the nitrile group on the ligands. Further, the ligands have some other polar functional groups in their structures, such as SO2 in 2IEJ, keto group in 1LD7, 2IEJ and 2ZIR, OH in 2ZIS and 2ZIR, NO in 2ZIS and N+ in 1LD7. It is interesting that all the functional groups have interactions with the hydrogen or oxygen atom in the water molecules surrounded them. These groups show peak between 2.5 and 2.8 Å with varying RDF values. The NO group and the OH groups in the molecules have large RDF value than the SO2 group. The keto groups also showed significant RDF values with sharp peek at the distance specified earlier. These functional groups such as nitro (NO) interact with the Asp590, ketone groups interact with tyrosine or serine or leucine residues and the oxygen atoms in the OH group interact with the tyrosine residues. The RDF analysis showed that these functional groups also have significant interaction with the water molecules, which are surrounded in the active position.
The residues, such as ArgB202 and TyrB361, are exhibited polar interaction with the complimentary functional group or atoms (polar groups) in the ligand. Hence, the RDF for the OH group in TyrB361 and NH group of guinidinium in the ArgB202 were analyzed and the results are presented in . The OH group in TyrB361 in 1LD7 has provided significant RDF value (0.9) at 2.8 Å. Other complexes do not provide significant RDF values reveal that this moiety present in 1LD7 has interaction with the water molecules surrounded on the residues. The two guanidinium nitrogen atoms present in the ArgB202 showed prominent peeks at 2.8 Å distance. It reveals that these nitrogen atoms also have interactions with the water molecules surrounded on the residues. These water molecules may cause bridge formation between the nitrogen atoms with the functional groups in the ligands.
Structure-based pharmacophore generation
The structure-based pharmacophore analysis is one of the important techniques used nowadays to screen large data set to identify HIT molecules. Generally, these pharmacophore points are generated directly from the protein–ligand complex, considering both ligand and the protein structuresCitation19–26. In this analysis, protein–ligand interaction fingerprint bits created through PLIF analysis was used to generate the pharmacophore queries. The details of the fingerprint bits created in the PLIF analysis are provided in and are discussed in earlier section. In order to perform pharmacophore analysis, eight pharmacophore queries were generated from the PLIF created from the analysis. These queries made of the conformers of the individual complexes (Ph-1LD7, Ph-1NI1, Ph-2IEJ, Ph-2ZIR and Ph-2ZIS), only complexes of rat (Ph-rat) and human (Ph-human) and all the complexes (Ph-all) ( and ).
Figure 7. Graphical representation of the structure based pharmacophore models.
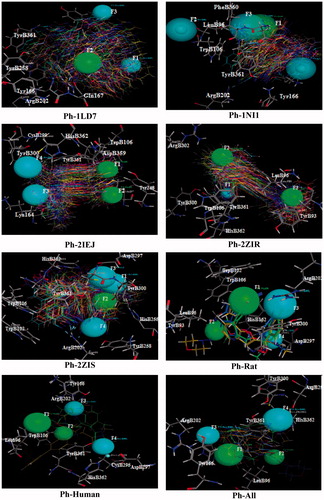
The important interaction fingerprint bits (>25% abundance) obtained from the PLIF analysis were used for the pharmacophore query development. The pharmacophore contours generated from the analysis are provided in . The excluded volumes of the pharmacophore contours are included in the pharmacophore models, those are used to screen the data set. Each pharmacophore models have 3–4 pharmacophore contours consist of acceptor & metal ligand (Acc&ML), hydrophobic (HydA) and extended acceptor (Acc2) features with the radius ranging between 1 and 3 Å for Acc&ML and 1–2 Å for HydA. The excluded volume of the pharmacophore contours radius is between 1 and 2 Å. The developed pharmacophore models with the interacting residues are graphically represented in . In these models, the pharmacophore contours are generated specifically through the interacting residues. The functional groups/atoms in ligands and the residues causing the type of the interactions are discussed earlier. Eventhough, it confirms that the aromatic residues, such as tyrosine and tryptophan and the aliphatic residue leucine, are majorly caused for the hydrophobic interactions. The hydroxyl group in the tyrosine, the nitrogen atoms in the arginine and side chains polar groups in other important residues (cysteine, serine and histidine) causes the Acc&ML pharmacophore contour generation. Hence, these interacting groups generated the hydrophobic type of pharmacophore contours in the studied complexes or the conformers.
The validation of the developed pharmacophore is important before going to virtual screen large data set. In order to perform validation, a set of reference compounds (tipifarnib, lonafarnib and L7,78,123 and natural compounds exhibited FTase inhibitory activities were screened. The results obtained from the validation analysis are provided in . It shows that the reference compounds tipifarnib and lonafarnib have been identified as significant HIT through all the pharmacophore models. The compound L7,78,123 has not identified byPh-1LD7 and human pharmacophore models. It is considered that the RMSD value for the compounds identified through these models are <2 Å. Additionally, the developed structure-based pharmacophore models were validated by screening a data set of natural compounds exhibiting FTase inhibitory activities and some compounds do not have FTase inhibitory activities. The important compounds identified through virtual screening are provided in . The results showed that the natural compounds Nat1 and Nat2 have been identified as significant compounds through all the pharmacophore models. These compounds have reported FTase inhibitory activity (IC50) of 230 and 50 nM, respectively. The compound Nat3 has been identified by four models, which have the experimental FTase inhibitory activity of 50 nM. The RMSD values of these molecules also <2 Å. These results confirm that the developed structure-based pharmacophore models are significant for virtual screening of new molecules.
Table 4. Virtual screening results of the identified HITs.
Further, the virtual screening of 100 natural compounds, 1000 synthetic compounds from literatures and a data set from data base (binding database). Those molecules identified by more than three models and its RMSD values <2 Å was selected as significant hits and the novel hits identified through the structure-based pharmacophore analysis are also provided in . There are two molecules identified from four pharmacophore models with the RMSD values <2 Å. The structures of the molecules selected from the analysis are provided in . From the literature data set and the binding database, four compounds were identified through 2–3 models. Among the six compounds selected from all the data set three compounds (compounds 1, 2 and 4) have significant activities such as 2540, 1300 and 1320 nM, respectively. These compounds can be used as lead molecules for the development of novel FTase inhibitors.
Table 5. Structure of the inhibitors used for the validation of the pharmacophore models and the identified HITs.
Conclusion
In this analysis, the structure-based pharmacophore models were generated for some complexes from protein data bank. In contrast to the existing methods, in this study, we have used the conformers of the ligands, generated through MD simulations for the pharmacophore query generation through PLIF analysis. This method provides a significant pharmacophore model with major interaction fingerprints of the conformers than a single conformer used in normal method. The validated pharmacophores models identify the HITs effectively. The statistical mechanics of the MD simulations results provided significant output in terms of RMSD, RMSF, RDF and distance analysis. This reveals that the developed structure based pharmacophore model is significant, because generally, the structure based pharmacophore models generated on the ligand coordination in the X-ray complex. But in this analysis, along with the coordinated ligand, different conformers from the same ligands were utilized. We conclude that the developed pharmacophore model can be a significant model for the identification of HITs as FTase inhibitors. Hopefully, this protocol can be an alternative for some structure-based virtual screening of data sets.
Supplementary material available online
Declaration of interest
The authors report no conflicts of interest. The authors alone are responsible for the content and writing of this article.
One of the Authors (N.S.H.N. Moorthy) gratefully acknowledges the Fundaçao para a Ciencia e Technologia (FCT), Portugal, for a Postdoctoral Grant (SFRH/BPD/44,,469/2008). N.S.H.N. Moorthy is also thankful to RGPV, Bhopal, India, for providing support in this work.
References
- International Agency for Research on Cancer, WHI; 2014. Available from: http://www.iarc.fr/en/publications/books/wcr/wcr-order.php
- World Health Organization; 2015. Available from: http://www.who.int/mediacentre/factsheets/fs297/en/
- Moorthy NSHN, Sousa SF, Ramos MJ, Fernandes PA. Structural feature study of benzofuran derivatives as farnesyltransferase inhibitors. J Enzyme Inhib Med Chem 2011;26:777–91
- Witzig TE, Tang H, Micallef INM, et al. Multi-institutional phase 2 study of the farnesyltransferase inhibitor tipifarnib (R115777) in patients with relapsed and refractory lymphomas. Blood 2011;118:4882–9
- Zhang FL, Casey PJ. Protein prenylation: molecular mechanisms and functional consequences. Annu Rev Biochem 1996;65:241–69
- Moorthy NSHN, Sousa SF, Ramos MJ, Fernandes PA. Farnesyltransferase inhibitors: a comprehensive review based on quantitative structural analysis. Curr Med Chem 2013;20:4888–923
- Yokoyama K, Trobridge P, Buckner FS, et al. Protein farnesyltransferase from Trypanosoma brucei. A heterodimer of 61- and 65-kda subunits as a new target for antiparasite therapeutics. J Biol Chem 1998;273:26497–505
- Capell BC, Erdos MR, Madigan JP, et al. Inhibiting farnesylation of progerin prevents the characteristic nuclear blebbing of Hutchinson–Gilford progeria syndrome. Proc Natl Aacd Sci USA 2005;102:12879–84
- Ohkanda J, Buckner FS, Lockman JW, et al. Design and synthesis of peptidomimetic protein farnesyltransferase inhibitors as anti-Trypanosoma brucei agents. J Med Chem 2004;47:432–45
- Buckner FS, Eastman RT, Nepomuceno-Silva JL, et al. Cloning, heterologous expression, and substrate specificities of protein farnesyltransferases from Trypanosoma cruzi and Leishmania major. Mol Biochem Parasitol 2002;122:181–8
- Esteva MI, Kettler K, Maidana C, et al. Benzophenone-based farnesyltransferase inhibitors with high activity against Trypanosoma cruzi. J Med Chem 2005;48:7186–91
- Troutman JM, Subramanian T, Andres DA, Spielmann HP. Selective modification of CaaX peptides with ortho-substituted anilinogeranyl lipids by protein farnesyltransferase: competitive substrates and potent inhibitors from a library of farnesyl diphosphate analogues. Biochemistry 2007;46:11310–21
- Eastman RT, White J, Hucke O, et al. Resistance to a protein farnesyltransferase inhibitor in Plasmodium falciparum. J Biol Chem 2005;280:13554–9
- Buckner FS, Eastman RT, Yokoyama K, et al. Protein farnesyl transferase inhibitors for the treatment of malaria and African trypanosomiasis. Curr Opin Investig Drugs 2005;6:791–7
- Straniero V, Pallavicini M, Chiodini G, et al. Farnesyltransferase inhibitors: CAAX mimetics based on different biaryl scaffolds. Bioorg Med Chem Lett 2014;24:2924–7
- Reid TS, Long SB, Beese LS. Crystallographic analysis reveals that anticancer clinical candidate L-778,123 inhibits protein farnesyltransferase and geranylgeranyltransferase-I by different binding modes. Biochemistry 2004;43:9000–8
- Shen M, Pan P, Li Y, et al. Farnesyltransferase and geranylgeranyltransferase I: structures, mechanism, inhibitors and molecular modeling. Drug Discov Today 2015;20:267–76
- Moorthy NSHN, Sousa SF, Ramos MJ, Fernandes PA. In silico based structural analysis of arylthiophene derivatives for FTase inhibitory activity, hERG and other toxic effects. J Biomol Screen 2011;16:1037–46
- Loving K, Salam NK, Sherman W. Energetic analysis of fragment docking and application to structure-based pharmacophore hypothesis generation. J Comput Aided Mol Des 2009;23:541–54
- Sanders MPA, Verhoeven S, de Graaf C, et al. Snooker: a structure-based pharmacophore generation tool applied to class A GPCRs. J Chem Inf Model 2011;51:2277–92
- Meslamani J, Li J, Sutter J, et al. Protein − ligand-based pharmacophores: generation and utility assessment in computational ligand profiling. J Chem Inf Model 2012;52:943–55
- Rella M, Rushworth CA, Guy JL, et al. Structure-based pharmacophore design and virtual screening for novel angiotensin converting enzyme 2 inhibitors. J Chem Inf Model 2006;46:708–16
- Chen J, Lai L. Pocket v.2: further developments on receptor-based pharmacophore modeling. J Chem Inf Model 2006;46:2684–91
- Kurczab R, Bojarski AJ. New strategy for receptor-based pharmacophore query construction: a case study for 5-HT7 receptor ligands receptor. J Chem Inf Model 2013;53:3233–43
- Arooj M, Sakkiah S, Kim S, et al. A combination of receptor-based pharmacophore modeling & QM techniques for identification of human chymase inhibitors. PLoS One 2013;8:e63030
- Guner OF. History and evolution of the pharmacophore concept in computer-aided drug design. Curr Top Med Chem 2002;2:1321–32
- Dixon SL, Smondyrev AM, Knoll EH, et al. PHASE: a new engine for pharmacophore perception, 3D QSAR model development, and 3D database screening: 1. Methodology and preliminary results. J Comput Aided Mol Des 2006;20:647–71
- Guner O, Clement O, Kurogi Y. Pharmacophore modeling and three dimensional database searching for drug design using catalyst: recent advances. Curr Med Chem 2004;11:2991–3005
- Protein Data Bank; 2014. Available from: http://www.rcsb.org/pdb/home/home.do
- Case DA, Darden TA, Cheatham IIITE, et al. AMBER 12. San Francisco: University of California; 2012
- Sousa SF, Fernandes PA, Ramos MJ. Farnesyltransferase-new insights into the zinc-coordination sphere paradigm: evidence for a carboxylate-shift mechanism. Biophys J 2005;88:483–94
- Long SB, Casey PJ, Beese LS. Reaction path of protein farnesyltransferase at atomic resolution. Nature 2002;419:645–50
- Long SB, Hancock PJ, Kral AM, et al. The crystal structure of human protein farnesyltransferase reveals the basis for inhibition by CaaX tetrapeptides and their mimetics. Proc Natl Acad Sci USA 2001;98:12948–53
- Park HW, Boduluri SR, Moomaw JF, et al. Crystal structure of protein farnesyltransferase at 2.25 angstrom resolution. Science 1997;275:1800–4
- Tobin DA, Pickett JS, Hartman HL, et al. Structural characterization of the zinc site in protein farnesyltransferase. J Am Chem Soc 2003;125:9962–9
- Pickett JS, Bowers KE, Fierke CA. Mutagenesis studies of protein farnesyltransferase implicate aspartate beta 352 as a magnesium ligand. J Biol Chem 2003;278:51243–50
- Pickett JS, Bowers KE, Hartman HL, et al. Kinetic studies of protein farnesyltransferase mutants establish active substrate conformation. Biochemistry 2003;42:9741–8
- Sousa SF, Fernandes PA, Ramos MJ. Effective tailor-made force field parameterization of the several Zn coordination environments in the puzzling FTase enzyme: opening the door to the full understanding of its elusive catalytic mechanism. Theor Chem Acc 2007;117:171–81
- Sousa SF, Fernandes PA, Ramos MJ. Theoretical studies on farnesyltransferase: the distances paradox explained. Proteins 2007;66:205–18
- Sousa SF, Fernandes PA, Ramos MJ. Molecular dynamics simulations on the critical states of the farnesyltransferase enzyme. Bioorg Med Chem 2009;17:3369–78
- Duan Y, Wu C, Chowdhury S, et al. A point-charge force field for molecular mechanics simulations of proteins based on condensed-phase quantum mechanical calculations. J Comput Chem 2003;24:1999–2012
- Humphrey W, Dalke A, Schulten K. VMD: visual molecular dynamics – molecular. J Mol Graph 1996;14:33–38
- Molecular operating environment (MOE). Chemical Computing Group Inc. Montreal, H3A 2R7 Canada; 2013
- Vasanthanathan P, Moorthy NSHN, Kongsted J. Dual mechanism of HIV-1 integrase and RNase H inhibition by diketo derivatives: a computational study. RSC Adv 2014;4:38672–81
- Moorthy NSHN, Cerquira NMFS, Ramos MJ, Fernandes PA. Ligand based analysis on HMG-CoA reductase inhibitors. Chemom Intell Lab Sys 2015;140:102–16
- Sousa SF, Fernandes PA, Ramos MJ. Enzyme flexibility and the catalytic mechanism of farnesyltransferase: targeting the relation. J Phys Chem B 2008;112:8681–91
- Sousa SF, Fernandes PA, Ramos MJ. Theoretical studies on farnesyl transferase: evidence for thioether product coordination to the active-site zinc sphere. J Comput Chem 2007;28:1160–8
- Sousa SF, Coimbra JTS, Paramos D, et al. Molecular dynamics analysis of a series of 22 potential farnesyltransferase substrates containing a CaaX-motif. J Mol Model 2013;19:673–88