Abstract
A plethora of magnetic resonance (MR) techniques developed in the last two decades provide unique and noninvasive measurement capabilities for studies of basic brain function and brain diseases in humans. Animal model experiments have been an indispensible part of this development. MR imaging and spectroscopy measurements have been employed in animal models, either by themselves or in combination with complementary and often invasive techniques, to enlighten us about the information content of such MR methods and/or verify observations made in the human brain. They have also been employed, with or independently of human efforts, to examine mechanisms underlying pathological developments in the brain, exploiting the wealth of animal models available for such studies. In this endeavor, the desire to push for ever-higher spatial and/or spectral resolution, better signal-to-noise ratio, and unique image contrast has inevitably led to the introduction of increasingly higher magnetic fields. As a result, today, animal model studies are starting to be conducted at magnetic fields ranging from ~ 11 to 17 Tesla, significantly enhancing the armamentarium of tools available for the probing brain function and brain pathologies.
Durante las dos últimas décadas se ha desarrollado una gran cantidad de técnicas de resonancia magnética (RM) que ha facilitado la posibilidad de mediciones especiales y no invasoras en los estudios de función cerebral básica y enfermedades cerebrales en humanos. Los experimentos en modelos animales han sido parte fundamental de este desarrollo. En modelos animales se han empleado imágenes de RM y mediciones de espectroscopía, tanto en forma aislada como en combinación con técnicas complementarias y con frecuencia invasoras, para darnos luces acerca del contenido de la información de los métodos de RM y/o verificar las observaciones realizadas en el cerebro humano. Estos procedimientos también se han utilizado, en conjunto o independientemente de los esfuerzos en humanos, para examinar los mecanismos subyacentes a los desarrollos patológicos del cerebro, explotando la riqueza de los modelos animales disponibles para tales estudios. En este intento, el deseo de impulsar cada vez mayores resoluciones espectrales ylo espaciales, una mejor relación señal/ruido y un contraste de imagen excelente ha llevado inevitablemente a la introducción de campos magnéticos cada vez más intensos. Como resultado de esto, hoy en día, los estudios de modelos animales están empezando a realizarse en campos magnéticos que van desde ~ 11 hasta 17 Tesla, lo que aumenta significativamente el arsenal de herramientas disponíbles para evaluar la función cerebral y las patologías cerebrales.
Les techniques de résonance magnétique (RM) se sont incroyablement développées ces deux dernières décennies, permettant d'effectuer, de manière non invasive et originale, les mesures nécessaires à I'étude du fonctionnement cérébral humain normal et pathologique. Dans les modèles animaux expérimentaux indispensables à ce développement, les mesures par RM d'imagerie et de spectroscopie, seules ou en association a d'autres techniques complémentaires et souvent invasives, ont été utilisées pour nous éclairer sur leur fonctionnement propre et/ou vérifier les observations faites sur le cerveau humain. Elles ont également été employées, avec ou sans activité humaine, pour analyser les mécanismes sous-tendant les pathologies cérébrales grâce à la richesse des modèles animaux disponibles pour de telles études. Dans cette lancée, le désir d'obtenir une résolution spectrale ou spatiale toujours plus élevée, un meilleur rapport signal/bruit et une image de contraste originale, a inévitablement débouché sur des champs magnétiques de plus en plus élevés. Ainsi, aujourd'hui, les études de modèles animaux débutent à des champs magnétiques de 11 à 17 Tesla environ, ce qui enrichit significativement l'arsenal de moyens disponibles pour l'exploration de la fonction du cerveau et de ses pathologies.
Introduction
In the last two decades, a plethora of magnetic resonance (MR) techniques have been introduced to provide indispensable measurement capabilities for studies of the brain in humans and in animal models of human diseased states. In addition to the exquisite anatomical information provided by MRI, these capabilities include imaging of brain function (functional MRI — fMRI), perfusion, vascular anatomy, diffusion, neurochemistry, and metabolic rates. At the same time, substantial gains in sensitivity and resolution with increasing magnetic field strength have been demonstrated (eg, ref 1Citation1) facilitating new discoveries as well as more robust preclinical and clinical applications of these techniques. Animal model studies have been an indispensible to these advances, particularly as part of efforts focused on increasing the magnetic field strength of human MR experiments. High field human studies started with the use of 4 Tesla (T) in 1991, when MR Instruments employed in human imaging operated at 1.5 T or less. Ultimately, 7 T and, to a much lesser extent, to 9.4 T was established for human studies, largely justified by results obtained in animal model systems at such magnetic fields.Citation2
Subsequent to the initial explorations of 4 T for human brain studies, a 9.4 T system was introduced for the first time for animal model experiments. This prototype instrument, with a bore large enough to perform studies in small- to medium-sized animals (eg, rodents and cats), provided the early forays (eg, refs 3-6) into the exploration of ultrahigh magnetic fields for functional, anatomical, and biochemical measurements in animal models using MR methods. Note that the terminology is based on classification of radiofrequency (RF) bands. The frequency range 300 MHz to 3 GHz is defined as ultra high frequency (UHF) — http://en.wikipedia.org/wiki/Ultra_high_frequency. The hydrogen nucleus resonance frequency at 7 T is ~300 MHz, ie, in the UHF band. Therefore, 7 to 70 T is defined as ultrahigh field (UHF). This body of work offered a clear demonstration of the advantages inherent at such fields and ultimately led to the development of instruments operating at even higher magnetic fields, such as 11.7, 14, 16.4, and 17 T. These ultrahigh field scanners provided significant and necessary new gains in resolution and sensitivity for animal model experiments.
High field MR imaging
Functional imaging
The effort to pursue high magnetic fields has been intricately tied to introduction of fMRI that can generate maps of human brain activity noninvasively. The very first fMRI experimentsCitation7-Citation10 were conducted at two different magnetic fields, 4 T and 1.5 T, providing the initial evidence that functional imaging may improve with increasing magnetic field strength; the results obtained at 4 T were at higher resolution and largely followed the contours of the gray matter ribbon, whereas the 1.5 T images of increased brain activity were more diffuse.Citation2 This field dependence was anticipated based on mathematical modelingCitation11 of the blood oxygenation leveldependent (BOLD) effect, which is based on the magnetic susceptibility difference between the intra- and extravascular space of de oxyhemoglobin containing blood vessels. This and other early (eg, refs 12-14) computational models of the BOLD phenomenon are currently understood to be largely accurate, albeit incomplete with respect to the mechanisms contributing to functional mapping signals. Some of these initially overlooked mechanisms (eg, inflow effects) form the basis of the successful use of lower field strengths, such as 1.5 T, for the acquisition of functional images in human brain. Nevertheless, increased understanding of the origin of fMRI signals (see ref 15 and references therein) have also reconfirmed original expectations that there are major advantages in going to very high magnetic fields, and these have largely been experimentally verified by a plethora of studies conducted with animal models (eg, refs 1, 16-18).
For example, in fMRI, the contrast-to-noise ratio (CNR) of deoxyhemoglobin-based BOLD mapping signals increases linearly in high-resolution imaging for gradient echo (GE)-based techniques, the predominant approach employed in contemporary fMRI experiments. (Contrast in fMRI is defined as the magnitude of the signal change induced by a stimulus or a task. Contrast-to noise ratio CNR is the ratio of the contrast to the signal fluctuations in the fMRI time series). When image resolution is high, the latter is dominated by the “thermal” noise present in each image of the time series. At low resolution, CNR for GE fMRI increases less than linearly with field magnitude since the temporal fluctuations of signals become dominated by physiological processes (rather than thermal noise) and display a dependence on signal amplitude, hence magnetic field magnitude. For spin echo (SE) BOLD fMRI, which provides more accurate functional localization,Citation1,Citation16-Citation17 albeit only at high magnetic fields and with smaller signal changesCitation1,Citation9,Citation20 CNR can exhibit more than a linear dependence on magnetic field magnitude because of suprallnear gains in fractional signal change induced by neuronal activityCitation19-Citation20 and a linear elevation in intrinsic image signal-to-noise ratio (SNR).Citation21 The gains in fractional signal change, however, tend to level off at fields above -9 to 10 Tesla,Citation15 leaving the SNR gains as the only potential source of CNR improvements.
More importantly, however, higher magnetic fields provide significantly better spatial fidelity in the deoxyhemoglobin-based functional mapping signals (eg, refs 1,16,17). fMRI relies on secondary metabolic and vascular responses invoked by alterations in neuronal activity. Therefore, its accuracy can be degraded by limitations imposed by these secondary responses. However, in a critical experiment performed in the cat visual cortex, it was demonstrated that blood flow increase induced by functional activation is regulated at the level of orientation columns. This observation indicated for the first time that cerebral blood flow (CBF) must be controlled at the capillary level, contradicting the accepted concept of the time that the “brain waters an entire garden for the sake of a single thirsty flower.” Instead, these crucial animal model studiesCitation22 suggested that the “brain waters specifically the thirsty flower, but also sprinkles the surrounding garden.” The definitive conclusion of these cat visual cortex experiments was that the secondary physiological responses to neuronal activity would be compatible with very high-resolution functional mapping with CBF-based fMRI and potentially with BOLD based fMRI.
Compared with CBF methods, however, the BOLD approach suffers from additional confounds that can obfuscate spatial fidelity. They arise because blood vessels mediate the coupling between the physiological changes and the MR-detected functional signals; this coupling depends in a complex way on the diameter and oxygenation levels of the blood vessel involved (eg, refs 15,23,24). The consequences of these confounds were evaluated experimentally, most notably in animal models, but in humans as well. The point spread function (PSF) of the conventional GE fMRI was measured to be -3.5 mm (full width at half maximum [FWHM])Citation25 at 1.5 T and ~ 2.5 mm at 4.7 T.Citation26 In contrast, the PSFs (FWHM) were reported as 1.64 ± 0.11 mm and 0.67 ± 0.08 for GE and SE fMRI, respectively, at 9.4 T in the cat visual cortex.Citation27-Citation28
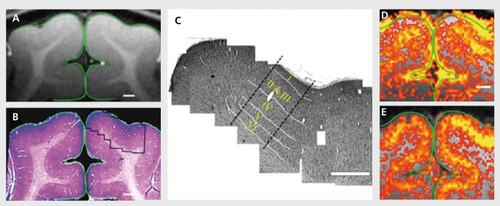
With a PSF of ~ 0.7 mm, columnar organization in 1 mm spatial scale and cortical laminar differentiations is easily possible without significant blurring. This has been demonstrated for several elementary organizations at the level of cortical layersCitation19,Citation29-Citation32 and cortical columnsCitation30,Citation33-Citation39 in parallel studies conducted in the human brain and in the brain of animal model systems.Citation40-Citation46 illustrates an example from work examining laminar specificity in cat visual cortex using concurrent MR and histology studies.Citation44
For animal model studies only, a highly desirable alternative to BOLD fMRI is cerebral blood volume (CBV)based imaging using exogenous, intravascular contrast agents, typically superparamagnetic iron oxide particles, employed in high doses. This approach has been employed in studies ranging from rodents to the nonhuman primate (eg, refs 40,44,47-49), and was shown to have specificity to cortical layers and orientation columns.Citation40
The magnetization of iron oxide agents saturateCitation47 at a relatively low magnetic field strength; as such, functional contrast arising from their presence does not Increase significantly with increasing magnetic fields. Nevertheless, CNR for functional mapping has been reported to be about ~5Citation47 and ~ 3 timesCitation49 higher with such agents compared with BOLD-based fMRI at low (1.5–2 T), and intermediate fields (3 - 4.7 T), respectively. It is possible that BOLD contrast will increase sufficiently at ultrahigh fields such as ~14 to 17 T so that it will in fact provide a preferable approach to iron oxide particles. However, neither these extremely high fields nor the use of these exogenous particles at such high doses are available for human brain studies. The former because such magnets with a large enough bore to accommodate humans remain beyond the scope of contemporary technology, and the latter because of potential toxicity concerns. Therefore, these technologies will remain applicable only to animal model studies for the foreseeable future.
To date, the vast majority of information accumulated about brain function is based on electrophysiological recordings of single- and multiple-unit activities in animal models, for example in instrumented, behaving nonhuman primates. Consequently, it was inevitable that the relationship between electrophysiological and fMRI data would be examined. Such experiments were naturally performed in animal models, continuing the trend of combining invasive but often more informative measurements with the noninvasive fMRI method. In simultaneously acquired data, the spiking activity and local field potentials recorded with implanted electrodes in the nonhuman primate were compared with BOLD fMRI signal changes during visual stimulation,Citation50,Citation51 indicating that local field potentials rather than spiking activity correlates with the BOLD fMRI signals. A similar strategy was employed in the cat visual cortex to examine the spatial relationship between single-unit activity and stimulus-induced fMRI maps obtained at 9.4 T.Citation52 When averaged over ~4x4 mm2 cortical surface area, spiking activity and fMRI signals were found to be well correlated, but the correlation broke down progressively with diminishing surface area over which the averaging was performed. Especially at the level of individual electrode recording sites, the correlation between the two signals varied substantially because of the spatial inaccuracies inherent in GE BOLD fMRI.Citation52
The electrophysiological recordings have also been employed to probe neuronal mechanisms underlying resting state fMRI (rfMRI) in animal models, (eg, refs 53-56). Unlike task- or stimulus-induced fMRI, rfMRI uses correlations in the spontaneous temporal fluctuations in an fMRI time series to deduce “functional connectivity”; it serves as an indirect but nonetheless invaluable indicator of gray-matter regions that interact strongly and, in many cases, are connected anatomically (eg, refs 57-62). Many of these studies reported a correlation between fluctuations in rfMRI signals and concurrent fluctuations in the underlying, neuronal activity measured locally with multiunit electrodes.
Such combined approaches continue to be used in animal models to probe numerous aspects of brain function, as well as the properties of functional imaging data; however, the literature in this field is too vast to cover comprehensively in this brief review.
Structural MRI
Structural MRI is increasingly accepted as a surrogate for anatomic phenotype in neuroscience research. In many areas, anatomic MRI has replaced the need for analysis of the postmortem brain in order to elucidate relationships between structure and function. It is not hard to find examples in which anatomic MRI has transformed the entire research landscape of a field: cerebrovascular disease, epilepsy, multiple sclerosis, and other inflammatory conditions, cerebral developmental disorders, to some extent psychiatric disorders, and neurodegenerative disorders. Animal model studies at high magnetic fields have made unique contributions to this development.
Morphological images of brain tissue rely largely on proton density, T1 and T2 differences between tissue types (eg, white matter vs. gray matter, cortex vs. subcortical nuclei etc.). Proton density is clearly a magnetic field independent parameter. However, relaxation times T1 and T2 are field dependent, generally increasingCitation63,Citation64 and decreasingCitation1,Citation9,Citation65,Citation66 respectively, with higher magnetic fields (see review in ref 67). It was recently shown that, contrary to expectations, the dispersion in T1 increases with increasing magnetic fields in the brain, leading to superior T1-weighted structural Images at the higher magnetic fields.Citation68
Lengthening of T1 with increasing magnetic field also holds true for blood. Blood T1 is virtually insensitive to its oxygenation state. Ex vivo measurements have shown that blood T1 varies linearly with field strength going from 1.5 T to 9.4 T according to T1= 1.226+ 0.134B0.Citation69 This imparts a clear benefit in time-of-flight type vascular imaging, as well as perfusion imaging using spin labeling techniques. Mapping signals in all hemodynamic-based functional imaging methods, such as fMRI and optical imaging with intrinsic signals, are mediated through the vasculature. Consequently, vascular components in these methods are of utmost significance in determining the ultimate spatial and temporal accuracy of the neural activity maps produced by these methods. Therefore, it is important to be able to image vasculature in great detail, and ideally together with functional data in order to understand more precisely the source of the fMRI signals and their spatial correlation with the volume of altered neuronal activity. Vascular imaging with high resolution is also of paramount importance in other fields of biomedical research such as tumor biology, where angiogenesis is a necessary component of tumor growth.
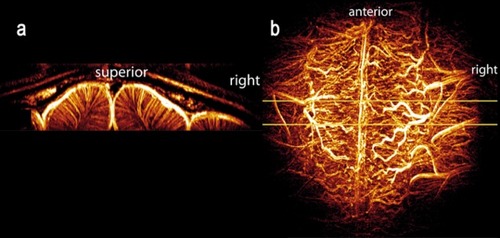
Taking advantage of the gains in SNR and longer T1 values, the feasibility of obtaining high-resolution MR images of intracortlcal vessels was demonstrated in the cat brain.Citation70 This accomplishment relied on a combination of time-of -flight MR angiography and T2*-weighted contrast based on both endogenous BOLD effect and exogenous iron-oxide particles. It was possible to image vessels smaller than 100 microns, and distinguish between arteries and veins within the cortexCitation70 ().
Such methods can be used for building models of the vascular network and may benefit a variety of research applications including fMRI, cerebrovascular disease, and cancer angiogenesis. Because of the lengthening T1 and increased SNR, significant gains can be expected for such studies at even higher magnetic fields such as -~16 to 17T.
At higher magnetic fields such as 14 to 17 T, other unique contrast mechanisms also come into play, leading to exquisite anatomical images obtained using approaches such as phaseCitation71 and T2* -weighted imaging, providing unprecedented visualization of anatomy in animal models.Citation72 The mechanism responsible for this improved anatomical imaging appears to be tissue-specific differences induced largely by myelin content and/or presence of iron.Citation73-Citation77 Thus, the primary advantage of ultrahigh field for structural MRI is not just the SNR gain, which could be traded for increased spatial resolution at constant imaging times or imaging time at constant spatial resolution, but also gains in contrast mechanisms.
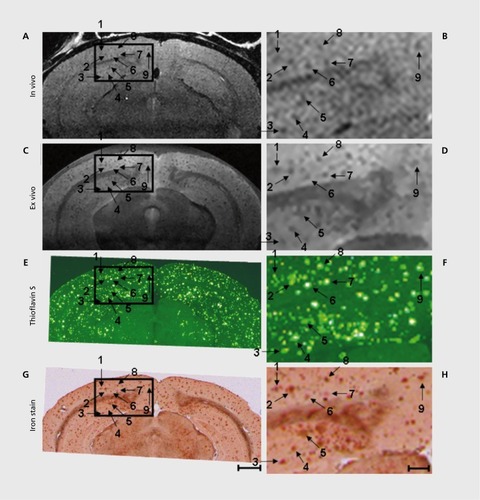
A recent and exciting example where the advantages of combined use of high magnetic fields and animal models were indispensable in morphological imaging has been the in vivo detection of amyloid plaquesCitation78,Citation79 () exploiting the genetic capabilities available in animal models. Among the neurodegenerative disorders, Alzheimer's disease has received much of the attention due to its frequency and hence high public health impact. Aβ plaques, a cardinal pathologic feature of Alzheimer's disease, were previously observed In T2* -weighted images of ex vivo tissue specimens taken from the brain of AD mice. These plaques were imaged for the first time in vivo in anesthetized AD mice in reasonable imaging times (~ 1 hour)Citation78 using T2 weighting at very high magnetic fields (9.4 T), incorporating strategies that minimize perturbations originating from breathing and brain pulsation. The mechanism responsible for this accomplishment is thought to be alterations in effective T2 by diffusion-induced dynamic averaging of magnetic susceptibility gradients around the plaques. This contrast is small but depends quadratically on magnetic field magnitude. As such, the ultrahigh field was indispensable. Imaging of labeled plaques has been accomplished with other non-MR modalities (see references in ref 78). Unlike other modalities, however, MRI provides the potential for visualizing individual plaques noninvasively.
High field MR spectroscopy with protons
Neurochemical profiling in the animal brain
Proton (ie, 1H) MRS, based on the proton resonance of hydrogen atoms, received considerable amount of attention in biomarker studies of neurological and psychiatric diseasesCitation80 because it enables noninvasive detection of a number of endogenous small molecular weight neurochemicals directly in affected brain regions (eg, see detailed reviews in refs 81-83). Depending on the acquisition parameters, up to five neurochemicals can be quantified reliably from human brain at 1.5 T. Animal model studies at very high magnetic fields, where spectral resolution and sensitivity are enhanced, were critical in demonstrating the feasibility of going beyond this. Early studies employed animal brain tissue extracts at high-field MR instruments demonstrating the wealth of biochemical information available by MRS.Citation84-Citation87 With recent advances in high-field MR Instrumentation, spectroscopy localization techniques and sophisticated spectral quantification methods, however, the sensitivity and resolution of in vitro MRS was approached in the in vivo animal and human brain.Citation83
Ten to fifteen neurochemicals in the human brainCitation88,Citation89 and up to eighteen neurochemicals in the rat brainCitation90 can now be quantified noninvasively by high field MRS. In the mouse, which is highly desirable because of the availability of many models of human diseases, measurement of a 16-component neurochemical profile from 5-10 L volumes has been feasible.Citation91 The mouse brain studies encounter major challenges in MR instrumentation and methodology.Citation85,Citation92 However, these difficulties were overcome in the last decade. The ability to measure an extended “neurochemical profile” increases the likelihood of identifying underlying processes on the molecular level, to detect disease-specific metabolic signatures and to directly assess mechanisms of drug actions, eg, by measuring endogenous antioxidant levels to assess effects of antioxidant medications.Citation93
The technical and methodological challenges of MRS at high magnetic fields and the strategies to overcome them in order to fully benefit from increased sensitivity and chemical shift dispersion at high fields have been recently reviewed.Citation94 The quantification precision of MRS is improved at high fields,Citation85,Citation95-Citation97 which is critical for preclinical and clinical applications.
The most frequently studied MRS biomarker N-acetylaspartate (NAA) is localized almost exclusively to neurons and is used as a surrogate for neuronal cell number and viability.Citation98,Citation99 Decreased NAA levels have been demonstrated in numerous neurological conditions and, therefore, are not very specific.Citation80 Neurotransmitters glutamate and γ-aminobutyric acid (GABA), which offer potentially more specific information about neuronal status, have also been reliably quantified in vivo with high field MRS. Glutamate is primarily localized to neurons,Citation100 with the highest levels present in excitatory terminals of glutamatergic neurons.Citation101 Decreased glutamate levels were observed in parallel with NAA in several neurological diseases and disease models,Citation85,Citation102,Citation103 likely because glutamatergic neurons make up the majority of neurons in the central nervous system (CNS). However, MRS detects both the neurotransmitter and metabolic pools of glutamate and alterations of glutamate levels in the absence of parallel NAA changes are possible.Citation86,Citation104 Most inhibitory neurons in the CNS are GABAergic and have low levels of glutamate In their cell bodies and processes.Citation101 GABA is potentially a good marker for these neurons because GABA concentrations and GABA-like immunoreactivity are highest in these neurons.Citation105,Citation106
In addition to neuronal markers, MRS enables detection of several putative glial markers: cell culture studies suggested a primarily glial localization for myo-inositolCitation107 and its levels were increased with gliosis in the monkey and rat brain.Citation86,Citation108 Therefore, increased myo-inositol levels have often been attributed to gliosis in neurological disorders.Citation102,Citation109-Citation111 However, the glial localization of myoinositol has been disputedCitation112 and its levels do not always correlate with reactive astrogliosis.Citation113 Myo-inositol has multiple functions in cells. For example it plays an essential role in the regulation of cell volume in CNS as one of the most important organic osmolytesCitation112 and therefore may mark various cellular changes.
An alternative glial marker is glutamine, which can be reliably quantified using high field MRS. Glutamine is preferentially localized in glial cells,Citation100,Citation101 and elevated glutamine levels were detected in diseases in which gliosis is known to occur.Citation102,Citation109 Total creatine (creatine + phosphocreatine, tCr) and choline-containing compounds (tCho) are also highly concentrated in glial cellsCitation114 and therefore may also increase with gliosis. Since both neurons and glia contain creatine and phosphocreatine, tCr has been utilized as a measure of total cellular density and its increase has been interpreted as glial proliferation that is not counterbalanced by neuroaxonal loss.Citation111,Citation115 Choline-containing compounds, on the other hand, may also become increasingly MR visible with increased membrane turnover or breakdown, such as during active demyelination.Citation109,Citation116 Therefore, tCr and tCho changes mayhave multiple implications that need to be determined for each disease in question.
In addition to the putative neuronal and glial markers, MRS can provide insights into energetic status and inflammation. For example, changes in the phosphocreatine-to-creatine ratio may be indicative of disturbances in energy metabolism.Citation117,Citation118 Lactate increases can be associated with anaerobic metabolism of infiltrating macrophages or indicate impaired mitochondrial function.Citation109,Citation116 MRS at high magnetic fields also allows the quantification of the most prominent antioxidants glutathione and vitamin C Citation88,Citation89,Citation119 and, thereby, can provide markers of oxidative stress.
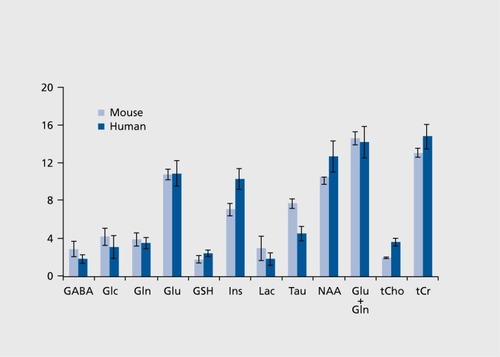
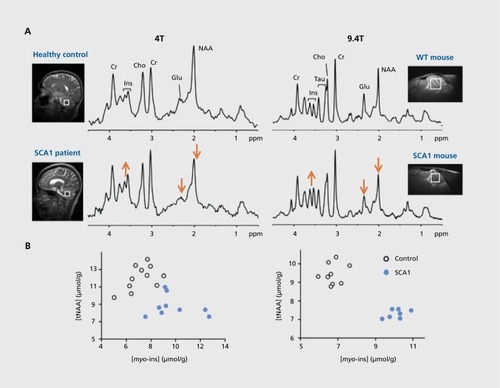
MRS studies using animal models of human diseases facilitate biomarker identification and drug development because they allow delineation of the pathological correlates of biomarkers and screening of potential drugs in preclinical trials. As such, these animal studies enhance human applications of MRS, however, the interpretation and translation of animal data to human applications need additional considerations. First, the regional differences and developmental changes in metabolite levelsCitation120 need to be taken into account when designing studies. Of note, the neurochemical profile of the rodent and human brain is very similar, with only few differences, such as very high taurine levels in the rodent brain (). Second, potential effects of anesthesia, which is necessary for animal scanning, need to be considered. General anesthesia was not found to affect steady-state levels of MRS detectable metabolites in the brain, except for glucose and lactate.Citation121,Citation122
Diagnosis
MRS can be utilized in preclinical and eventually clinical applications to distinguish, for example, transgenic mouse models from wild-type (WT) animals or patients from healthy controls. For the successful translation of biomarker data from animal models to humans,Citation123 not only does the model need to faithfully reproduce the pathology and phenotype of the human disease, but the same biomarker alterations need to be observed in the mouse model and in patients. This is a critical consideration. MRS studies with various AD mouse models demonstrate this issue well. For example, among the different AD models studied with 1H MRS, APP-PS1 mice match the neurochemical profile found in human AD best.Citation103 These mice display reductions in NAA and glutamate, as well as an increase in myo-inositol. The myoinositol difference in particular had not been detected in other AD models, but is a prominent neurochemical alteration detected in human AD.Citation110 A more recent studydemonstrated these neurochemical profile changes at an even earlier age than the APP-PS1 mice in a different AD mouse model.Citation124
In MPTP-intoxicated mice, well-accepted model of the dopaminergic denervation in Parkinson's disease (PD), high field MRS enabled detection of elevated glutamate, glutamine and GABA levels in the striatum.Citation125 Of these alterations, the GABA difference was confirmed in human PD at ultra-high field.Citation126
Longitudinal changes in neurochemical profiles were also reported in transgenicCitation117 and knock-inCitation118,Citation127 mouse models of Huntington's disease (HD). The observed neurochemical changes varied between different mouse modelsCitation123 and relative to exploratory observations in human HD at 7 T,Citation129,Citation130 which underlines the need for development of HD mouse models that fully mimic the phenotype and pathology of human HD.
While conventional structural MRI detects neuronal loss and atrophy,1HMRS can be utilized to assess neuronal dysfunction, ie, it can reveal biochemical changes that may start years before symptoms and irreversible neuron loss in neurological diseases,Citation131 thereby facilitating early diagnosis in these diseases. Recent work on a transgenic mouse model of spinocerebellar ataxia 1 (SCA1) clearly demonstrated this potential to detect early neurochemical alterations by MRS. The SCA1 model used in these studies reproduces the Purkinje cell pathology seen in patients and develops progressive ataxia similar to the human phenotype.Citation132 Importantly, the same neurochemical alterations were detected by MRS in this modelCitation133 and patients with SCA1Citation134 (). Furthermore, these neurochemical alterations were already detectable in the presymptomatic disease stage and marked neuronal dysfunction and dendritic atrophy, rather than cell loss, as shown by correlative histopathology.Citation133 These data indicate that MRS at very high magnetic fields may have a role in early diagnosis of neurological diseases in the clinic.
Monitoring of disease progression
MRS has been widely utilized for noninvasive monitoring of neurochemical alterations associated with disease progression in animal models and increasingly at high and ultra-high fields. For example, MRS was successfully applied in longitudinal studies of mouse models of various neurodegenerative diseases.Citation103,Citation117,Citation118,Citation124,Citation127,Citation128,Citation133 These studies demonstrated that changes in multiple neurochemicals associated with neurodegeneration, compromised neurotransmission, energy production, and osmotic regulation, can be monitored with high sensitivity using MRS in affected brain regions. In addition, such neurochemical changes correlate with semi-quantitative measures of pathological burden,Citation133,Citation135 but precede tissue atrophy,Citation117,Citation133 as well as clear behavioral symptoms.Citation133 In a SCA1 study, remarkably, the same neurochemicals (NAA, myo-inositol, and glutamate) correlated with the ataxia score in patientsCitation134 and with the pathology scores in the mouse model,Citation133 indicating these metabolites as biomarkers of disease progression and substantiating an ability to translate the mouse findings to patients.
Monitoring of treatment and medication effects
Due to the ability to monitor neurochemlstry longitudinally and noninvasively, MRS can also be used to monitor disease-modifying effects of treatments directly in affected brain regions and has been utilized in a number of preclinical disease and treatment models. Motivated by prior work that suggested nonsteroidal anti-inflammatory drugs (NSAIDs) may affect the incidence and progression of AD, the effects of chronic NSAID treatment was studied in a transgenic AD mouse model.Citation135 A significant protection against NAA and glutamate loss was demonstrated, suggesting that NSAIDs can protect against the neuronal pathology in AD. Similarly, dopamine administration, which had been the first-line pharmacologic treatment for PD for many years, reversed the abnormal striatal neurochemical levels (glutamate, glutamine, and GABA) in a PD model to WT levels.Citation125 In a SCA1 model, conditional expression of the transgene was utilized to establish the sensitivity of MRS biomarkers to disease reversal.Citation136 Namely, doxycycline treatment to suppress transgene expression was shown to reverse the abnormal neurochemical concentrations towards control levels.Citation136 Furthermore, the potential to monitor treatment effects in individual mice by utilizing multiple neurochemical levels at once was demonstrated in this study.
In addition to longitudinal studies with chronic treatments, MRS can be utilized to monitor acute effects of drugs by obtaining time courses of metabolite levels. For example, neurochemical changes, including transient ones, upon acute phencyclidine (PCP) administration were captured in the rat brain, suggesting that MRS can be used to assess the effects of potential antipsychotic drugs in vivo.Citation137 Similarly, the effects of the antieplleptic drug vigabatrin on GABA levels were Investigated in rat models using MRS,Citation138 and increases similar to those observed in the human brainCitation139 were detected.
Low gyromagnetic ratio nuclei
High field capabilities in brain research apply particularly to methodologies based on low gyromagnetic ratio nuclei such as 17O and 23Na imaging, and 13C, and 31P spectroscopy. For lower gyromagnetic nuclei, SNR gains provided by high magnetic fields can be more dramatic than what can be obtained for1Hin large biological samples such as the human brain. For example, the SNR for the 17O nucleus is elevated ~ 4 fold in conducting biological samples, including the rat brain, with magnetic field in going from 4.7 T to 9.4 TCitation140 while relaxation rates do not change. The SNR gain is within experimental error of expected theoretical maximum of 3.4Citation141 for these low frequencies since sample noise does not dominate SNR at these frequencies even in conducting samples.
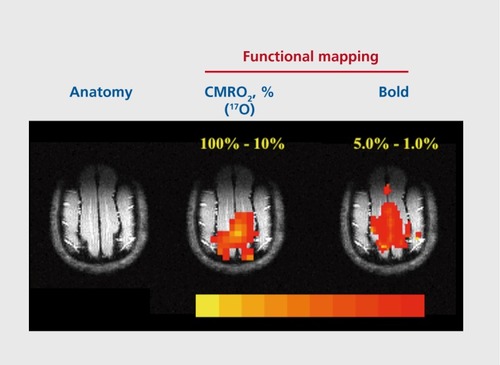
The biological information content in MR studies conducted with such low gyromagnetic nuclei can be unique. For example, the ability to image and quantitatively measure CMRC)2 in the ratCitation140,Citation142-Citation144 and catCitation145 was demonstrated and used to measure oxygen consumption changes associated with neuronal activity to obtain functional images using 17O MR (). Similarly, 13C and 31P experiments have demonstrated the feasibility of measuring glutamatergic neurotransmission rates,Citation5,Citation146,Citation147 cerebral glycogen turnover,Citation148-Citation152 glucose transport kinetics,Citation17,Citation153-Citation156 oxidative ATP synthesis rate,Citation157 and metabolic alterations in disease states.Citation158,Citation159
Conclusion
Animal model studies have played a critical role in evaluating the potential of the MR imaging and spectroscopy techniques to study basic brain function, brain diseases, and mechanisms underlying neuroimaging. Very high magnetic fields have been indispensable for achieving important gains in biological information content in these studies. The introduction of latest generation of MR systems operating at magnetic fields ranging from ~ 11 to 17 Tesla is expected to advance the field further for animal model experiments.
Selected abbreviations and acronyms
| MRI | = | magnetic resonance imaging |
| BOLD | = | blood oxygen level-dependent |
| CNR | = | contrast to noise ratio |
| MRS | = | magnetic resonance spectroscopy |
| NAA | = | N-acetylaspartate |
| GABA | = | γ-aminobutyric acid |
| AD | = | Alzheimer's disease |
| HD | = | Huntington's disease |
Acknowledgments: The preparation of this review was in part supported by the National Institute of Neurological Disorders and Stroke (NINDS) grant R01 NS070815 (GÖ). The Center for MR Research is supported by National Center for Research Resources (NCRR) biotechnology research resource grant P41 RR008079, National Institute of Biomedical Imaging and Bioengineering (NIBIB) grant P41 EB015894 and NINDS grant P30 NS076408.
REFERENCES
- UgurbilK.AdrianyG.AndersenP.et alUltrahigh field magnetic resonance imaging and spectroscopy.Magn Reson Imaging.2003211263128114725934
- UgurbilK.The road to functional imaging and ultrahigh fields.Neuroimage.20126272673522333670
- GruetterR.WeisdorfSA.RajanayaganV.et alResolution improvements in in vivo 1H NMR spectra with increased magnetic field strength.J Magn Reson.19981352602649799704
- LeeSP.SilvaAC.UgurbilK.KimSG.Diffusion-weighted spin-echo fMRI at 9.4 T: microvascular/tissue contribution to BOLD signal changes.Magn Reson Med.19994291992810542351
- PfeufferJ.TkacI.ChoiIY.et alLocalized in vivo 1H NMR detection of neurotransmitter labeling in rat brain during infusion of [1-13C] D-glucose.Magn Reson Med.1999411077108310371437
- DuongTQ.KimDS.UgurbilK.KimSG.Spatiotemporal dynamics of the BOLD fMRI signals: toward mapping submillimeter cortical columns using the early negative response.Magn Reson Med.20004423124210918322
- UgurbilK.Development of functional imaging in the human brain (fMRI); the University of Minnesota experience.Neuroimage.20126261361922342875
- OgawaS.TankDW.MenonR.et alIntrinsic signal changes accompanying sensory stimulation: functional brain mapping with magnetic resonance imaging.Proc Natl Acad Sci USA.199289595159551631079
- KwongKK.BelliveauJW.CheslerDA.et alDynamic magnetic resonance imaging of human brain activity during primary sensory stimulation.Proc Natl Acad Sci USA.199289567556791608978
- BandettiniPA.WongEC.HinksRS.TikofskyRS.HydeJS.Time course EPI of human brain function during task activation.Magn Reson Med.1992253903971614324
- OgawaS.MenonRS.TankDW.et alFunctional brain mapping by blood oxygenation level-dependent contrast magnetic resonance imaging. A comparison of signal characteristics with a biophysical model.Biophys J.93648038128386018
- FujitaN.Extravascular contribution of blood oxygenation level-dependent signal changes: a numerical analysis based on a vascular network model.Magn Reson Med.20014672373411590649
- BoxermanJL.HambergLM.RosenBR.WeisskoffRM.MR contrast due to intravascular magnetic susceptiblity perturbations.Magn Reson Med.1995345555568524024
- KennanRP.ZhongJ.GoreJC.Intravascular susceptibility contrast mechanisms in tissue.Magn Reson Med.1994319318121277
- UludagK.Muller-BierlB.UgurbilK.An integrative model for neuronal activity-induced signal changes for gradient and spin echo functional imaging.Neuroimage.20094815016519481163
- UgurbilK.TothL.KimDS.How accurate is magnetic resonance imaging of brain function?Trends Neurosci.20032610811412536134
- UgurbilK.AdrianyG.AndersenP.et alMagnetic resonance studies of brain function and neurochemistry.Annu Rev Biorned Eng.20002633660
- KimSG.UgurbilK.High-resolution functional magnetic resonance imaging of the animal brain.Methods.200330284112695101
- YacoubE.DuongTQ.Van De MoortelePF.et alSpin-echo fMRI in humans using high spatial resolutions and high magnetic fields.Magn Reson Med.20034965566412652536
- YacoubE.Van De MoortelePF.ShmuelA.UgurbilK.Signal and noise characteristics of Hahn SE and GE BOLD fMRI at 7T in humans.Neuroimage.20052473875015652309
- VaughanJT.GarwoodM.CollinsCM.et al7T vs. 4T: RF power, homogeneity, and signal-to-noise comparison in head images.Magn Reson Med.200146243011443707
- DuongTQ.KimDS.UgurbilK.KimSG.Localized cerebral blood flow response at submillimeter columnar resolution.Proc Natl Acad Sci USA.200198109041090911526212
- UgurbilK.Two decades of functional imaging: from nuclear spins to cortical columns.Cognitive Critique.20124121186
- UgurbilK.Imaging of brain function using deoxyhemoglobin and magnetic fields. In: Choi l-Y, Gruetter R, eds.Neural Metabolism in Vivo. New York, NY: Springer US;2012501545
- EngelSA.GloverGH.WandellBA.Retinotopic organization in human visual cortex and the spatial precision of functional MRI.Cereb Cortex.199771811929087826
- RonenI.OlmanC.KimSG.UgurbilK.TothLJ.Spatial relationship between neuronal activity and BOLD functional MRI.Neuroimage.20042187688515006654
- ParkJC.RonenI.KimD-S.UgurbilK.Spatial specificity of high resolution GE BOLD and CBF fMRI in the cat visual cortex.Proc Intl Soc Mag Reson Med.2004121014
- ParkJC.RonenI.KimD-S.UgurbilK.Spatial specificity of high resolution GE BOLD and Spin Ech (SE) BOLD fMRI in the cat visual cortex at 9.4 Tesla. Procintl Soc Mag Reson Med.20051331
- OlmanCA.HarelN.FeinbergDA.et alLayer-specific fMRI reflects different neuronal computations at different depths in human V1.PLoS One.20127e3253622448223
- ZimmermannJ.GoebelR.De MartinoF.et alMapping the organization of axis of motion selective features in human area MT using high-field fMRI.PLoS One.20116e2871622163328
- PolimeniJR.FischlB.GreveDN.WaldLL.Laminar analysis of 7T BOLD using an imposed spatial activation pattern in human V1.Neuroimage.2010521334134620460157
- KoopmansPJ.EarthM.OrzadaS.NorrisDG.Multi-echo fMRI of the cortical laminae in humans at 7 T.Neuroimage.2011561276128521338697
- YacoubE.ShmuelA.LogothetisN.UgurbilK.Robust detection of ocular dominance columns in humans using Hahn Spin Echo BOLD functional MRI at 7 Tesla.Neuroimage.2007371161117717702606
- YacoubE.HarelN.UgurbilK.High-field fMRI unveils orientation columns in humans.Proc Natl Acad Sci U S A.2008105106071061218641121
- MenonRS.OgawaS.StruppJP.UgurbilK.Ocular dominance in human V1 demonstrated by functional magnetic resonance imaging.J Neurophysiol.199777278027879163392
- ChengK.WaggonerRA.TanakaK.Human ocular dominance columns as revealed by high-field functional magnetic resonance imaging.Neuron.20013235937411684004
- GoodyearBG.MenonRS.Brief visual stimulation allows mapping of ocular dominance in visual cortex using fMRI.Hum Brain Mapp.20011421021711668652
- FukudaM.MoonCH.WangP.KimSG.Mapping iso-orientation columns by contrast agent-enhanced functional magnetic resonance imaging: reproducibility, specificity, and evaluation by optical imaging of intrinsic signal.J Neurosci.200626118211183217108155
- SunP.UenoK.WaggonerRA.GardnerJL.TanakaK.ChengK.A temporal frequency-dependent functional architecture in human V1 revealed by high-resolution fMRI.Nat Neurosci.2007101404140617934459
- ZhaoF.WangP.HendrichK.UgurbilK.KimSG.Cortical layer-dependent BOLD and CBV responses measured by spin-echo and gradient-echo fMRI: insights into hemodynamic regulation.Neuroimage.2006301149116016414284
- ZhaoF.WangP.KimSG.Cortical depth-dependent gradient-echo and spin-echo BOLD fMRI at 9.4T.Magn Reson Med.20045151852415004793
- KimSG.DuongTQ.Mapping cortical columnar structures using fMRI.Physiol Behav.20027764164412527012
- DuongTQ.SilvaAC.LeeSP.KimSG.Functional MRI of calcium-dependent synaptic activity: cross correlation with CBF and BOLD measurements.Magn Reson Med.20004338339210725881
- HarelN.LinJ.MoellerS.UgurbilK.YacoubE.Combined imaging-histological study of cortical laminar specificity of fMRI signals.Neuroimage.20062987988716194614
- GoenseJB.LogothetisNK.Laminar specificity in monkey V1 using highresolution SE-fMRI.Magn Reson Imaging.20062438139216677944
- YuX.GlenD.WangS.et alDirect imaging of macrovascular and microvascular contributions to BOLD fMRI in layers IV-V of the rat whisker-barrel cortex.Neuroimage.2012591451146021851857
- MandevilleJB.MarotaJJ.KosofskyBE.et alDynamic functional imaging of relative cerebral blood volume during rat forepaw stimulation.Magn Reson Med.1998396156249543424
- SmirnakisSM.SchmidMC.WeberB.ToliasAS.AugathM.LogothetisNK.Spatial specificity of BOLD versus cerebral blood volume fMRI for mapping cortical organization.J Cereb Blood Flow Metab.2007271248126117213863
- LeiteFP.TsaoD.VanduffelW.et alRepeated fMRI using iron oxide contrast agent in awake, behaving macaques at 3 Tesla.Neuroimage.20021628329412030817
- LogothetisNK.PaulsJ.AugathM.TrinathT.OeltermannA.Neurophysiological investigation of the basis of the fMRI signal.Nature.200141215015711449264
- LogothetisNK.What we can do and what we cannot do with fMRI.Nature.200845386987818548064
- KimDS.RonenI.OlmanC.KimSG.UgurbilK.TothLJ.Spatial relationship between neuronal activity and BOLD functional MRI.Neuroimage.20042187688515006654
- LeopoldDA.MaierA.Ongoing physiological processes in the cerebral cortex.Neuroimage.2012622190220022040739
- ScholvinckML.MaierA.YeFQ.DuynJH.LeopoldDA.Neural basis of global resting-state fMRI activity.Proc Natl Acad Sci U S A.12010107102381024320439733
- ShmuelA.LeopoldDA.Neuronal correlates of spontaneous fluctuations in fMRI signals in monkey visual cortex: Implications for functional connectivity at rest.Hum Brain Mapp.082975176118465799
- LiuX.ZhuXH.ZhangY.ChenW.Neural origin of spontaneous hemodynamic fluctuations in rats under burst-suppression anesthesia condition.Cerebral Cortex.20112137438420530220
- BiswalB.YetkinFZ.HaughtonVM.HydeJS.Functional connectivity in the motor cortex of resting human brain using echo-planar MRI.Magn Res Med.199534537541
- FoxMD.RaichleME.Spontaneous fluctuations in brain activity observed with functional magnetic resonance imaging.Nat Rev Neurosci.2007870071117704812
- VincentJL.PatelGH.FoxMD.et alIntrinsic functional architecture in the anaesthetized monkey brain.Nature.2007447838617476267
- BeckmannCF.DeLucaM.DevlinJT.SmithSM.Investigations into resting-state connectivity using independent component analysis.Philos Trans R Soc Lond B Biol Sci.20053601001101316087444
- SmithSM.MillerKL.Salimi-KhorshidiG.et alNetwork modelling methods for FMRI.Neuroimage.20115487589120817103
- SmithSM.BeckmannCF.AnderssonJ.et alResting-state fMRI in the Human Connectome Project.Neuroimage.20138014416823702415
- KimS-G.HuX.UgurbilK.Accurate T1 determination from inversion recovery images: application to human brain at 4 Tesla.Magn Reson Med.1994314454498208121
- JezzardP.DuewellS.BalabanRS.MR relaxation times in human brain: measurement at 4 T.Radiology.19961997737798638004
- BarthaR.MichaeliS.MerkleH.et alIn vivo HO T(dagger) measurement in the human occipital lobe at 4T and 7T by Carr-Purcell MRI: detection of microscopic susceptibility contrast.Magn Reson Med.024774275011948736
- MichaeliS.GarwoodM.ZhuXH.et alProton T relaxation study of water, N-acetylaspartate, and creatine in human brain using Hahn and Carr-Purcell spin echoes at 4T and 7T.Magn Reson Med.20024762963311948722
- NorrisDG.High field human imaging.J Magn Reson Imaging.20031851952914579394
- RooneyW.JohnsonG.LiX.et alMagnetic field and tissue dependencies of human brain longitudinal 1 H2O relaxation in vivo.Magn Reson Med.20075730831817260370
- DobreMC.MarjanskaM.UgurbilK.Blood T1 measurement at high magnetic field strength.Proc Intl Soc Mag Reson Med.2005131162
- BolanPJ.YacoubE.GarwoodM.UgurbilK.HarelN.In vivo micro-MRI of intracortical neurovasculature.Neuroimage.200632626916675271
- DuynJH.van GelderenP.LiTQ.de ZwartJA.KoretskyAP.FukunagaM.High-field MRI of brain cortical substructure based on signal phase.Proc Natl Acad Sci USA.2007104117961180117586684
- MarquesJP.MaddageR.MlynarikV.GruetterR.On the origin of the MR image phase contrast: an in vivo MR microscopy study of the rat brain at 14.1T.Neuroimage.20094634535219254768
- SatiP.van GelderenP.SilvaAC.et alMicro-compartment specific T2* relaxation in the brain.Neuroimage.20137726827823528924
- LeeJ.ShmueliK.KangBT.et alThe contribution of myelin to magnetic susceptibility-weighted contrasts in high-field MRI of the brain.Neuroimage.2012593967397522056461
- FukunagaM.LiTQ.van GelderenP.et alLayer-specific variation of iron content in cerebral cortex as a source of MRI contrast.Proc Natl Acad Sci USA.20101073834383920133720
- LiTQ.YaoB.van GelderenP.et alCharacterization of T* heterogeneity in human brain white matter.Magn Reson Med.2009621652165719859939
- LodygenskyGA.MarquesJP.MaddageR.et alIn vivo assessment of myelination by phase imaging at high magnetic field.Neuroimage.2012591979198721985911
- JackCR.Jr.GarwoodM.WengenackTM.et alIn vivo visualization of Alzheimer's amyloid plaques by magnetic resonance imaging in transgenic mice without a contrast agent.Magn Reson Med.2004521263127115562496
- JackCR.Jr Wengenack TM, Reyes DA, et al. In vivo magnetic resonance microimaging of individual amyloid plaques in Alzheimer's transgenic mice.J Neurosci.200525100411004816251453
- JenkinsBG.KraftE.Magnetic resonance spectroscopy in toxic encephalopathy and neurodegeneration.Curr Opin Neurol.19991275376010676760
- ChoiIY.LeeSP.GuilfoyleDN.HelpernJA.In vivo NMR studies of neurodegenerative diseases in transgenic and rodent models.Neurochem Res.200328987100112737523
- MichaelisT.BoretiusS.FrahmJ.Localized proton MRS of animal brain in vivo: models of human disorders.Prog NMR Spect.200955134
- DuarteJM.LeiH.MlynarikV.GruetterR.The neurochemical profile quantified by in vivo 1H NMR spectroscopy.Neuroimage.20126134236222227137
- DautryC.VaufreyF.BrouilletE.et alEarly N-acetylaspartate depletion is a marker of neuronal dysfunction in rats and primates chronically treated with the mitochondrial toxin 3- nitropropionic acid.J Cereb Blood Flow Metab.20002078979910826529
- JenkinsBG.KlivenyiP.KustermannE.et alNonlinear decrease over time in N-acetyl aspartate levels in the absence of neuronal loss and increases in glutamine and glucose in transgenic Huntington's disease mice.J Neurochem.2000742108211910800956
- BossuetC.VaufreyF.CondeF.et alUp-regulation of glutamate concentration in the putamen and in the prefrontal cortex of asymptomatic SIVmac251-infected macaques without major brain involvement.J Neurochem.20048892893814756814
- DedeogluA.ChoiJK.CormierK.KowallNW.JenkinsBG.Magnetic resonance spectroscopic analysis of Alzheimer's disease mouse brain that express mutant human APP shows altered neurochemical profile.Brain Res.20041012606515158161
- EmirUE.AuerbachEJ.MoortelePF.et alRegional neurochemical profiles in the human brain measured by H MRS at 7 T using local B shimming.NMR Biorned.201225152160
- TkacI.OzG.AdrianyG.UgurbilK.GruetterR.In vivo 1H NMR spectroscopy of the human brain at high magnetic fields: metabolite quantification at 4T vs. 7T.Magn Reson Med.20096286887919591201
- PfeufferJ.TkacI.ProvencherSW.GruetterR.Toward an in vivo neurochemical profile: quantification of 18 metabolites in short-echo-time H NMR spectra of the rat brain.J Magn Reson.199914110412010527748
- TkacI.HenryPG.AndersenP.KeeneCD.LowWC.GruetterR.Highly resolved in vivo 1H NMR spectroscopy of the mouse brain at 9.4 T.Magn Reson Med.20045247848415334565
- SchwarczA.NattO.WatanabeT.BoretiusS.FrahmJ.MichaelisT.Localized proton MRS of cerebral metabolite profiles in different mouse strains.Magn Reson Med.20034982282712704764
- HolmayMJ.TerpstraM.ColesLD.et alN-acetylcysteine boosts brain and blood glutathione in gaucher and Parkinson diseases.Clin Neuropharrnacol.201336103106
- TkacI.OzG.In vivo proton MR spectroscopy: animal and human applications at high fields. In: Garrido L, Beckmann N, eds.New Applications of NMR in Drug Discovery and Development. London, UK: Royal Society of Chemistry;2013237258
- BarthaR.DrostDJ.MenonRS.WilliamsonPC.Comparison of the quantification precision of human short echo time H spectroscopy at 1.5 and 4.0 Tesla.Magn Reson Med.20004418519210918316
- OtazoR.MuellerB.UgurbilK.WaldL.PosseS.Signal-to-noise ratio and spectral linewidth improvements between 1.5 and 7 Tesla in proton echoplanar spectroscopic imaging.Magn Reson Med.2006561200121017094090
- MekleR.MlynarikV.GambarotaG.HergtM.KruegerG.GruetterR.MR spectroscopy of the human brain with enhanced signal intensity at ultrashort echo times on a clinical platform at 3T and 7T.Magn Reson Med.2009611279128519319893
- ClarkJB.N-acetyl aspartate: a marker for neuronal loss or mitochondrial dysfunction.Dev Neurosci.1998202712769778562
- DemougeotC.GamierP.MossiatC.et alN-Acetylaspartate, a marker of both cellular dysfunction and neuronal loss: its relevance to studies of acute brain injury.J Neurochem.20017740841511299303
- PetroffOA.PlebanLA.SpencerDD.Symbiosis between in vivo and in vitro NMR spectroscopy: the creatine, N-acetylaspartate, glutamate, and GABA content of the epileptic human brain.Magn Reson Imaging.199513119712118750337
- Storm-MathisenJ.DanboltNC.RotheF.et alUltrastructural immuno-cytochemical observations on the localization, metabolism and transport of glutamate in normal and ischemic brain tissue.Prog Brain Res.1992942252411363142
- OzG.TkacI.CharnasLR.et alAssessment of adrenoleukodystrophy lesions by high field MRS in non-sedated pediatric patients.Neurology.20056443444115699371
- MarjanskaM.CurranGL.WengenackTM.et alMonitoring disease progression in transgenic mouse models of Alzheimer's disease with proton magnetic resonance spectroscopy. ProcNatl Acad Sci U S A.20051021190611910
- AndreassenOA.JenkinsBG.DedeogluA.et alIncreases in cortical glutamate concentrations in transgenic amyotrophic lateral sclerosis mice are attenuated by creatine supplementation.J Neurochem.20017738339011299300
- OttersenOP.Storm-MathisenJ.Glutamate- and GABA-containing neurons in the mouse and rat brain, as demonstrated with a new immuno-cytochemical technique.J Comp Neurol.19842293743926150049
- PalmiM.BrookeS.SmithAD.BolarnJP.GABA-like immunoreactivity in different cellular populations of cerebellar cortex of rats before and after treatment with amino-oxyacetic acid.Brain Res.19915432772862059835
- BrandA.Richter-LandsbergC.LeibfritzD.Multinuclear NMR studies on the energy metabolism of glial and neuronal cells.Dev Neurosci.1993152892987805581
- SchuhmannMU.StillerD.SkardellyM.et alMetabolic changes in the vicinity of brain contusions: a proton magnetic resonance spectroscopy and histology study.J Neurotrauma.20032072574312965052
- PouwelsPJ.KruseB.KorenkeGC.MaoX.HanefeldFA.FrahmJ.Quantitative proton magnetic resonance spectroscopy of childhood adrenoleukodystrophy.Neuropediatrics.1998292542649810561
- KantarciK.PetersenRC.BoeveBF.et al1H MR spectroscopy in common dementias.Neurology.2004631393139815505154
- VrenkenH.BarkhofF.UitdehaagBM.CastelijnsJA.PolmanCH.PouwelsPJ.MR spectroscopic evidence for glial increase but not for neuro-axonal damage in MS normal-appearing white matter.Magn Reson Med.20055325626615678547
- FisherSK.NovakJE.AgranoffBW.Inositol and higher inositol phosphates in neural tissues: homeostasis, metabolism and functional significance.J Neurochem.20028273675412358779
- KimJP.LentzMR.WestmorelandSV.et alRelationships between astrogliosis and 1H MR spectroscopic measures of brain choline/creatine and myo-inositol/creatine in a primate model.Am J Neuroradiol.20052675275915814917
- UrenjakJ.WilliamsSR.GadianDG.NobleM.Proton nuclear magnetic resonance spectroscopy unambiguously identifies different neural cell types.J Neurosci.1993139819898441018
- BitschA.BruhnH.VougioukasV.et alInflammatory CNS demyelination: histopathologic correlation with in vivo quantitative proton MR spectroscopy.Am J Neuroradiol.1999201619162710543631
- MountfordCE.StanwellP.LinA.RamadanS.RossB.Neurospectroscopy: the past, present and future.Chem Rev.20101103060308620387805
- ZacharoffL.TkacI.SongQ.et alCortical metabolites as blomarkers in the R6/2 model of Huntington's disease.J Cereb Blood Flow Metab.20123250251422044866
- TkacI.HenryPG.ZacharoffL.et alHomeostatic adaptations in brain energy metabolism in mouse models of Huntington disease.J Cereb Blood FlowMetab.20123219771988
- TerpstraM.MarjanskaM.HenryPG.TkacI.GruetterR.Detection of an antioxidant profile in the human brain in vivo via double editing with MEGA-PRESS.Magn Reson Med.2006561192119917089366
- TkacI.RaoR.GeorgieffMK.GruetterR.Developmental and regional changes in the neurochemical profile of the rat brain determined by in vivo 1H NMR spectroscopy.Magn Reson Med.200350243212815675
- ValetteJ.GulllermlerM.BesretL.HantrayeP.BlochG.LebonV.Isoflurane strongly affects the diffusion of intracellular metabolites, as shown by 1H nuclear magnetic resonance spectroscopy of the monkey brain.J Cereb Blood Flow Metab.20072758859616788716
- LeiH.DuarteJM.MlynarikV.PythonA.GruetterR.Deep thiopental anesthesia alters steady-state glucose homeostasis but not the neurochemical profile of rat cortex.J Neurosci Res.20108841341919746430
- BakerM.In biomarkers we trust?Nat Biotechnol.052329730415765081
- MlynarikV.CacquevelM.Sun-ReimerL.et alProton and phosphorus magnetic resonance spectroscopy of a mouse model of Alzheimer's disease.J Alzheimers Dis.201231(suppl 3)S87S9922451319
- ChassainC.BielickiG.KellerC.RenouJP.DurifF.Metabolic changes detected in vivo by 1H MRS in the MPTP-intoxicated mouse.NMR Biomed.102354755320661872
- EmirUE.TuitePJ.OzG.Elevated pontine and putamenal GABA levels in mild-moderate Parkinson disease detected by 7 tesla proton MRS.PLoS One.20127e3091822295119
- HeikkinenT.LehtimakiK.VartiainenN.et alCharacterization of neurophysiological and behavioral changes, MRI brain volumetry and 1H MRS in zQ175 knock-in mouse model of Huntington's disease.PLoS One.20127e5071723284644
- TkacI.ZacharoffL.DubinskyJM.Longitudinal changes in neurochemical profiles of Huntington's disease mouse models. Paper presented at: 20th Scientific Meeting of the ISMRM; May 5-11, 2012; Melbourne, Australia.
- UnschuldPG.EddenRA.CarassA.et alBrain metabolite alterations and cognitive dysfunction in early Huntington's disease.Mov Disord.20122789590222649062
- van den BogaardSJ.DumasEM.TeeuwisseWM.et alExploratory 7Tesla magnetic resonance spectroscopy in Huntington's disease provides in vivo evidence for impaired energy metabolism.J Neurol.20112582230225921614431
- DeKoskyST.MarekK.Looking backward to move forward: early detection of neurodegenerative disorders.Science.200330283083414593169
- BurrightEN.ClarkHB.ServadioA.et alSCA1 transgenic mice: a model for neurodegeneration caused by an expanded CAG trinucleotide repeat.Cell.1995829379487553854
- OzG.NelsonCD.KoskiDM.et alNoninvasive detection of presymptomatic and progressive neurodegeneration in a mouse model of spinocerebellar ataxia type 1.J Neurosci.2010303831383820220018
- OzG.HutterD.TkacI.et alNeurochemical alterations in spinocerebellar ataxia type 1 and their correlations with clinical status.Mov Disord.2010251253126120310029
- ChoiJK.JenkinsBG.CarrerasI.et alAnti-inflammatory treatment in AD mice protects against neuronal pathology.Exp Neurol.201022337738419679126
- OzG.VollmersML.NelsonCD.et alIn vivo monitoring of recovery from neurodegeneration in conditional transgenic SCA1 mice.Exp Neurol.201123229029821963649
- litisI.KoskiDM.EberlyLE.et alNeurochemical changes in the rat prefrontal cortex following acute phencyclidine treatment: an in vivo localized H MRS study.NMR Biomed.20092273774419338025
- de GraafRA.PatelAB.RothmanDL.BeharKL.Acute regulation of steady-state GABA levels following GABA-transaminase inhibition in rat cerebral cortex.Neurochem Int.20064850851416517019
- PetroffOA.HyderF.CollinsT.MattsonRH.RothmanDL.Acute effects of vigabatrin on brain GABA and homocarnosine in patients with complex partial seizures.Epilepsia.19994095896410403220
- ZhuXH.MerkleH.KwagJH.UgurbilK.ChenW.170 relaxation time and NMR sensitivity of cerebral water and their field dependence.Magn Reson Med.20014554354911283979
- HoultDl.RichardsRE.The signal-to-noise ratio of the nuclear magnetic resonance phenomenon.J Magn Reson.1976247185
- ZhuXH.ZhangY.TianRX.et alDevelopment of O NMR approach for fast imaging of cerebral metabolic rate of oxygen in rat brain at high field.Proc Natl Acad Sci USA.200299131941319912242341
- ZhangN.ZhuXH.LeiH.UgurbilK.ChenW.Simplified methods for calculating cerebral metabolic rate of oxygen based on 170 magnetic resonance spectroscopic imaging measurement during a short 1702 inhalation.J Cereb Blood Flow Metab.20042484084815362714
- ZhuXH.ZhangN.ZhangY.ZhangX.UgurbilK.ChenW.In vivo O NMR approaches for brain study at high field.NMR Biomed.2005188310315770611
- ZhuXH.ZhangN.ZhangY.UgurbilK.ChenW.New insights into central roles of cerebral oxygen metabolism in the resting and stimulus-evoked brain.J Cereb Blood Flow Metab.200929101818781163
- GruetterR.SeaquistER.UgurbilK.A mathematical model of compartmentalized neurotransmitter metabolism in the human brain.Am J Physiol Endocrinol Metab.2001281E10011211404227
- OzG.BerkichDA.HenryPG.et alNeuroglial metabolism in the awake rat brain: CO2 fixation increases with brain activity.J Neurosci.200424112731127915601933
- ChoiIY.GruetterR.In vivo 13C NMR assessment of brain glycogen concentration and turnover in the awake rat.Neurochem Int.20034331732212742075
- ChoiIY.SeaquistER.GruetterR.Effect of hypoglycemia on brain glycogen metabolism in vivo.J Neurosci Res.200372253212645076
- GruetterR.Glycogen: the forgotten cerebral energy store.J Neurosci Res.20037417918314515346
- GruetterR.AdrianyG.ChoiIY.HenryPG.LeiH.OzG.Localized in vivo 13C NMR spectroscopy of the brain.NMR Biomed.20031631333814679498
- OzG.HenryPG.SeaquistER.GruetterR.Direct, noninvasive measurement of brain glycogen metabolism in humans.Neurochem Int.20034332332912742076
- SeaquistER.DambergGS.TkacI.GruetterR.The effect of insulin on in vivo cerebral glucose concentrations and rates of glucose transport/metabolism in humans.Diabetes.2001502203220911574399
- ChoiIY.LeeSP.KimSG.GruetterR.In vivo measurements of brain glucose transport using the reversible Michaelis-Menten model and simultaneous measurements of cerebral blood flow changes during hypoglycemia. JCereb Blood Flow Metab.200121653663
- ChenW.ZhuXH.GruetterR.SeaquistER.AdrianyG.UgurbilK.Study of tricarboxylic acid cycle flux changes in human visual cortex during hemifield visual stimulation using H-{C} MRS and fMRI.Magn Reson Med.20014534935511241689
- GruetterR.UgurbilK.SeaquistER.Steady-state cerebral glucose concentrations and transport in the human brain.J Neurochem.1998703974089422387
- LeiH.UgurbilK.ChenW.Measurement of unidirectional Pi to ATP flux in human visual cortex at 7 T by using in vivo 31 P magnetic resonance spectroscopy.Proc Natl Acad Sci U S A.2003100144091441414612566
- OzG.TesfayeN.KumarA.DeelchandDK.EberlyLE.SeaquistER.Brain glycogen content and metabolism in subjects with type 1 diabetes and hypoglycemia unawareness.J Cereb Blood Flow Metab.20123225626321971353
- HattingenE.MagerkurthJ.PilatusU.et alPhosphorus and proton magnetic resonance spectroscopy demonstrates mitochondrial dysfunction in early and advanced Parkinson's disease.Brain.2009132(Pt 12)3285329719952056
- OzG.MR Spectroscopy in health and disease. In: Manto M, Gruol DL, Schmahmann JD, Koibuchi N, Rossi F, eds.Handbook of the Cerebellum and Cerebellar Disorders. Vol 1. New York, NY: Springer Dordrecht;2013713733