
Abstract
Background
Tumour-derived extracellular vesicles (EVs) play a role in tumour progression; however, the spectrum of molecular mechanisms regulating EV secretion and cargo selection remain to be fully elucidated. We have reported that cavin-1 expression in prostate cancer PC3 cells reduced the abundance of a subset of EV proteins, concomitant with reduced xenograft tumour growth and metastasis.
Methods
We examined the functional outcomes and mechanisms of cavin-1 expression on PC3-derived EVs (PC3-EVs).
Results
PC3-EVs were internalized by osteoclast precursor RAW264.7 cells and primary human osteoblasts (hOBs) in vitro, stimulating osteoclastogenesis 37-fold and hOB proliferation 1.5-fold, respectively. Strikingly, EVs derived from cavin-1-expressing PC3 cells (cavin-1-PC3-EVs) failed to induce multinucleate osteoblasts or hOB proliferation. Cavin-1 was not detected in EVs, indicating an indirect mechanism of action. EV morphology, size and quantity were also not affected by cavin-1 expression, suggesting that cavin-1 modulated EV cargo recruitment rather than release. While cavin-1-EVs had no osteoclastogenic function, they were internalized by RAW264.7 cells but at a reduced efficiency compared to control EVs. EV surface proteins are required for internalization of PC3-EVs by RAW264.7 cells, as proteinase K treatment abolished uptake of both control and cavin-1-PC3-EVs. Removal of sialic acid modifications by neuraminidase treatment increased the amount of control PC3-EVs internalized by RAW264.7 cells, without affecting cavin-1-PC3-EVs. This suggests that cavin-1 expression altered the glycosylation modifications on PC3-EV surface. Finally, cavin-1 expression did not affect EV in vivo tissue targeting as both control and cavin-1-PC3-EVs were predominantly retained in the lung and bone 24 hours after injection into mice.
Discussion
Taken together, our results reveal a novel pathway for EV cargo sorting, and highlight the potential of utilizing cavin-1-mediated pathways to attenuate metastatic prostate cancer.
To access the supplementary material to this article, please see Supplementary files under Article Tools online.
One common trait of advanced prostate cancer is its propensity to metastasize to the bone with 80% of patients with metastatic disease possessing bone lesions (Citation1). While portending a poor prognosis with a 5-year survival rate of only 30% compared to 100% for localized disease, bone metastasis also results in substantial morbidities, including bone pain, fractures and hypercalcaemia (Citation2). The processes that underpin prostate cancer metastasis remain undefined but it is clear that a multifaceted interplay between tumour cells and the bone microenvironment is instrumental in the development of the metastatic niche (Citation1, Citation2).
While the importance of secreted molecules from cancer cells into the tumour microenvironment has been extensively studied, an emerging field now focuses on the contributions of extracellular vesicles (EVs) secreted by tumour cells. EVs are small membrane-bound vesicles that range from 30 nm to 1 µm in size with larger vesicles originating from the cell surface (microvesicles/ectosomes) and those on the smaller side being derived from either the plasma membrane or the endosomal system (exosomes). EVs encase a spectrum of biologically active proteins, mRNA, miRNA, DNA and lipids, thus propagating the horizontal transfer of their cargo across both short and long distances (Citation3–Citation7). Functional studies indicate that EVs may influence tumour progression and metastasis, with investigations showing tumour-derived EVs are capable of inducing angiogenesis (Citation8), increasing migration and proliferation (Citation9, Citation10), immune suppression (Citation11, Citation12) and establishment of the pre-metastatic niche (Citation13). Both normal and malignant prostate epithelial cells secrete EVs (also referred to as prostasomes). While prostate-derived EVs have physiological roles related to fertility, elevated levels have been observed in blood samples from men with prostate cancer compared to healthy controls (Citation14). Interestingly, proteomic analysis of a prostasome fraction prepared from tissues of prostate cancer vertebral metastases revealed proteins potentially involved with tumour angiogenesis (Citation15). Recent studies further indicate a role for prostate cancer EVs in stromal remodelling, tumour angiogenesis (Citation16) and transformation of adipose-derived stem cells (Citation17). Therefore, identification of molecular pathways involved in the vesicular secretion of metastasis-inducing molecules may provide new therapeutic targets for treatment of cancer metastasis.
Here we report a novel pathway regulating EV cargo sorting without altering bulk vesicle release. The study stems from our initial observation that expression of cavin-1 (also known as polymerase I and transcript release factor; PTRF) induced the selective reduction of tumour-associated growth factors and cytokines, including IL-6 and TGF-β2 in EVs derived from the advanced prostate cancer cell line PC3 (Citation18). Importantly, we recently demonstrated the in vivo relevance of cavin-1 in tumour suppression using an orthotopic xenograft mouse model (Citation19, Citation20). Here, we demonstrate that cavin-1 expression in PC3 cells reduced the biological activity of PC3-EVs on bone cells in vitro, with no qualitative alteration in in vivo tissue distribution. We performed detailed analysis of EV uptake kinetics and evaluated the effect of cavin-1 expression on EV secretion and morphology. Surprisingly, while cavin-1 expression reduced the level of a subset of EV proteins, there was no significant difference in total EV protein released per cell, or bulk morphology. These results suggest that cavin-1 expression alters EV cargo selection rather than EV release.
Methods
Reagents and antibodies
Reagents and antibodies used were provided by the following sources: Roswell Park Memorial Institute (RPMI)-1640 medium, α-Minimum Essential Medium (α-MEM), Dulbecco's Modified Eagle Medium (DMEM), L-glutamine, HEPES, Geneticin (G418), penicillin–streptomycin, ProLong Gold Antifade and trypsin were from Life Technologies (Grand Island, NY, USA). Fetal bovine serum (FBS) was from Thermo Scientific (Mordialloc, Vic, AUS). Fast Red Violet LB Salt, napthol AS-MX Phosphate, PKH2 and CellVue Claret Far Red Fluorescent Cell Linker Kits were from Sigma-Aldrich (Saint Louis, MO, USA). Antibodies against calnexin and caveolin-1 were from BD Transduction Laboratories (Franklin Lakes, NJ, USA), cofilin and EphA2 from Cell Signalling Technology (Franklin Lakes, NJ, USA), cavin-1 from ProteinTech (Chicago, IL, USA), α-tubulin and 4F2 from Sigma-Aldrich (Saint Louis, MO, USA), and CD63 from Developmental Studies Hybridoma Bank (Iowa City, IA, USA).
Cell culture
Two independent sets of PC3 cell lines were used for collection of EVs during this study, with similar results. As described in (Citation21), PC3 cells stably expressing either GFP or GFP-cavin-1 were grown in RPMI-1640 with 5% FBS, 1% L-glutamine and 0.1 mg/mL of G418. Lentivirus was used to generate a set of PC3-luciferase cell lines expressing GFP only or GFP and cavin-1 under a bicistronic promoter (Citation19). Flow cytometry was used to generate a pooled population of medium fluorescence intensity. These cells were used for the in vivo animal model in (Citation19). Primary human osteoblasts (hOB) were obtained from patients after knee replacement surgery as previously described (Citation22). hOB were maintained in α-MEM containing 10% FBS, 1% penicillin-streptomycin and passages 1–5 only were used. RAW264.7 cells were cultured in DMEM with 10% FBS, 1% HEPES, 1% L-glutamine and 1% sodium pyruvate.
EV isolation and labelling
EVs were isolated from PC3 cells as previously described (Citation18). Between four and six 15-cm dishes of cells grown to 70% confluency were washed 3 times with phosphate-buffered saline (PBS) to remove any trace of serum and then incubated for 24 hours in serum-free media. Cell culture supernatant was then collected and cell debris removed by centrifugation at 800 g for 5 min at 4°C and then 5,000 g for 10 min at 4°C to remove any cell fragments not pelleted at 800 g. Cleared supernatant was concentrated through an Amicon 10 kDa cutoff spin column (Millipore) and protein concentration was measured using Bradford assay (Biorad). Isolation of EVs from cleared supernatant was performed by ultracentrifugation of the supernatant at 100,000 g, 2 hours, 4°C. The supernatant was transferred to a new tube and stored on ice, and the EV pellets were washed with ice cold PBS and again pelleted at 100,000 g, 2 hours, 4°C. Pellets were re-suspended in PBS for functional assays and used immediately or store at −80°C.
Where indicated, EVs were fluorescently labelled with PKH2 or CellVue Claret Far Red Fluorescence Cell Linker Kit according to the manufacturer's protocol. Briefly, EVs (10–20 µg pellets) were incubated with PKH2 or CellVue (500 µL 0.2 µM) for 5 min at room temperature. Labelled EVs were diluted in 500 µL 1% BSA, and then pelleted at 100,000 g, 2 hours, 4°C, washed with 1 mL PBS to remove excess dye, re-suspended again in 1 mL PBS and then pelleted again at 100,000 g, 2 hours, 4°C before final re-suspension in 50 µL PBS. In initial experiments, a control tube containing no EV (dye alone) was performed to ensure lack of fluorescence in the absence of EV. Similar protein concentrations obtained before and after EV labelling (Bradford assay) confirmed that labelled EVs were not contaminated with BSA used to stop dye reaction. For all subsequent functional experiments, protein estimation was only performed before labelling EVs.
Proteinase K and neuraminidase treatment
Where indicated EVs were incubated with 0.2 mg/mL proteinase K (Roche Applied Science, Laval, QC, Canada) for 30 min at 37°C to digest the EV surface proteins. For deglycosylation, prostasomes were re-suspended in 50 mM sodium citrate (pH 6.0) and treated with 100 units of neuraminidase (New England Biolabs, Ipswich, MA, USA) per µg for 2 hours at 37°C. Following incubation with ProK/NRM prostasomes were washed in PBS and then re-suspended in PBS.
hOB proliferation assay
hOBs were plated in 96 well plates at a density of 5,000 cells/well in α-MEM containing 10% FBS. Cells were left to adhere overnight, after which they were treated with either 1% BSA (control), 5 µg GFP-PC3-EV or 5 µg cavin-1-PC3-EV (final concentration of 0.05 µg/µl) re-suspended in 1% BSA for 48 hours. After 48 hours incubation, proliferation was quantified using the AlamarBlue cell viability assay (Invitrogen) according to manufacturer's instructions. Six replicates were performed for 3 biological experiments.
RAW264.7 differentiation and TRAP staining
RAW264.7 cells were seeded in 48 well plates at a density of 2,000 cells/cm2 (Day 0). The following day (Day 1), cells were treated with either PBS, 50 ng/mL RANKL or 20 µg/mL PC3-EVs. Conditions and growth media were replaced on Day 4. On Day 7, cells were fixed with 4% PFA and stained for tartrate resistant acid phosphatase (TRAP) (50 mM sodium acetate, 40 mM sodium potassium tartrate, 10% napthol AS-MX phosphate, 1% N,N-dimethylformamide, 40% Fast Red Violet LB salt, dH2O). Osteoclasts were identified as TRAP positive, multinucleated cells (3 or more nuclei). Osteoclasts were counted manually using an inverted light microscope visualised at 200× magnification. Four replicates were performed per condition with 6 independent experiments performed.
EV uptake
hOBs and RAW264.7 cells were grown in DMEM containing 10% FBS on glass coverslips in 6 well dishes until they reached 60% confluency. Each well was incubated with 10 µg of labelled EVs (final concentration 5 µg/mL) or the equivalent amount of dye in 1% BSA (to control for background fluorescence) at 37°C for the indicated time points. Coverslips were washed 3 times with cold PBS to remove unbound EVs, and then fixed for 30 min in 4% PFA. Representative images were taken for each time point using a Zeiss Meta 510 confocal microscope. Uptake efficiency over time was determined by measuring the total cellular fluorescence over time (using ImageJ), adjusting for background. The mean fluorescence of hOB (~20–30 cells per time point) and RAW264.7 (~40 cells) was calculated across 3 independent experiments. The value for each time period is represented as a percentage of the peak in fluorescence.
Immunofluorescence
After fixation with 4% PFA, cells were permeabilized and blocked using 0.1% Triton X-100, 1% BSA in PBS for 30 min at room temperature. Cells were stained with α-tubulin antibody for 1 hour, washed 3 times in PBS, and incubated with Alexa Fluor 488-conjugated goat anti-mouse antibody (Life technologies) for 1 hour. Staining for actin ring formation was performed using 1-hour incubation with Texas Red conjugated phalloidin (Life Technologies), followed by DAPI. Coverslips were mounted using ProLong Gold Antifade reagent and visualized using a Zeiss Meta 510 confocal microscope.
Western blotting
Whole cell lysates (WCLs) were collected by pelleting cells from a 15 cm dish and treating with lysis buffer containing 150 mM NaCl, 20 mM Tris pH 7.5, 0.5% TritonX-100, 0.5 mM sodium vanadate, 10 mM sodium fluoride, 0.5 mM 4-(2-aminoethyl) benzenesulfonyl fluoride hydrochloride, protease inhibitor cocktail (1 µg/mL aprotinin, 1 µg/mL antipain, 1 µg/mL pepstatin A, 1 µg/mL leupeptin and 500 µM benzamidine). EV or WCL protein was measured using Bradford assay (BioRad) and 10 µg was resolved on SDS-PAGE gel and transferred to polyvinylidene difluoride membrane using wet transfer. Membranes were blocked using 5% milk powder in Tris buffered saline (pH 7.5) containing 0.1% Tween- 20 and incubated with the primary antibody for 2 hours at room temperature. After washing, secondary antibodies conjugated to horseradish peroxidase were applied for 2 hours at room temperature. Blots were developed using SuperSignal West Pico Chemiluminescent Substrate and imaged using film (Fujifilm).
RNA isolation and miRNA qPCR
Total RNA was isolated from whole cells or from EVs (70 µg protein) using mirVana RNA isolation kit (Ambion) following the manufacturer's instructions. 1 µg of DNase I (Ambion) treated and polyadenylated (NEB) RNA was used for cDNA synthesis using SuperScript III (Life Technologies). Real-time qPCR was performed using SensiFAST SYBR NoROX Kit (Bioline) in a Rotor-Gene 3000 real-time rotary analyser (Corbett Life Science). The relative level of miR-148a and miR125a was calculated from the relative signal by normalization to the signal for miR-107_2, which showed minimal variation between GFP-PC3-EVs and cavin-1-PC3-EVs. Primers for miR-148a and miR-107_2 were purchased from Qiagen and the primer for miR-125a was designed manually using the sequence 5′-TCCCTGAGACCCTTTAACCTGTGA-3′.
Electron microscopy
Negative staining and electron microscopy (EM) was performed as previously described (Citation23). Briefly, Immuno-EM was performed as follows; EVs were adhered to grids, cross-linked (4% PFA) then quenched with glycine (20 mM). Grids were blocked (0.2% BSA, 0.2% fish skin gelatin) for 10 min then labelled with primary antibody for 30 min followed by 3 PBS washes. Grids were then incubated on 10 nm protein A gold for 30 min, washed in PBS then water. Grids were then stained and mounted with methyl cellulose (2%) and uranyl acetate (0.4%). Electron micrographs were captured on a JEOL1011 electron microscope at 80 kV fitted with a Morada soft imaging system.
Flow cytometry
RAW264.7 cells were seeded overnight at 4×10⁵ cells per tube. EVs were labelled using the PKH2 or CellVue Claret fluorescent dye. Labelled EVs (20 µg) were incubated with RAW267.4 cells for 2 hours at 37°C. Cells were washed 3 times in cold PBS before being fixed in 3% PFA. Flow cytometry analysis was carried out using a FACSCanto (BD Biosciences). The background mean fluorescence from RAW264.7 cells not incubated with fluorescent EVs was subtracted from the mean fluorescence intensity of the experimental conditions.
In vivo EV distribution
The animal experiments were approved by the University of Queensland Animal Ethics Committee (UQDI/326/10/AICR and UQDI/076/14/NHMRC). 30 µg GFP-PC3-EVs labelled with PKH2 fluorescent dye and 30 µg cavin-1-PC3-EV labelled with CellVue Claret fluorescent dye were mixed in 150 µL of PBS. 50 μL of EV mix (final amount 10 µg GFP-PC3-EVs and 10 µg cavin-1-PC3-EV) was injected into the tail vein of 8-week-old male NOD/SCID mice. Control mice were injected with 50 µL of PBS. After 24 hours, the bone marrow was harvested from the long bones (femur and tibia) and disrupted into cell suspensions in PBS. The cell suspension was smeared on a glass slide and mounted in DAPI-containing Vectashield mounting media and EV uptake was imaged using a Zeiss Meta 510 confocal microscope. After 24 hours, the lung, heart, spleen, liver, kidney, thymus, brain and prostate were excised. For each solid organ, small pieces were removed and fixed in 4% PFA for 16 hours. The remaining tissue was embedded in OCT (Optimum Cutting Temperature) compound and frozen at −80°C. All other PFA fixed tissue pieces were imaged by a LaVision Biotek mupltiphoton system with a turnable titanium Sapphire laser. Tissues that were positive for EV uptake by multi-photon microscopy were then confirmed by confocal microscopy using 12 µm cryosections of the corresponding OCT frozen tissues.
Statistical analysis
Statistical analysis was performed using GraphPad Prism 5 software. Where applicable, results were compared using either a 2-tailed paired Student's t-test, or a one-way analysis of variance with Bonferroni's post-test for multiple comparisons. Data are expressed as the mean±SEM, with statistical significance defined as p<0.05.
Results
Cavin-1 altered abundance of EV proteins and miR-148a with no effect on total cellular levels
We previously demonstrated that cavin-1 expression suppressed PC3 tumour growth and metastasis in vivo (Citation19) concomitant with changes to PC3-EVproteome (Citation18). To characterize the functional consequences correlating with cavin-1 induced EV content changes, we focused our attention on bone cells because PC3 cells were derived from a bone-metastatic prostate cancer (Citation24) and PC3-conditioned media and EV have been reported to induce osteoclastogenesis in vitro (Citation25–Citation27). First, we examined if any of the PC3-EV proteins have established links to bone-associated functions or bone metastasis (Table ). Cavin-1 reduced the levels of 12 PC3-EV proteins that included bone matrix proteins collagen VI and fibronectin, drivers of osteoclastogenesis IL-6 and TGF-β, as well as the osteoblast inhibitor noggin (Citation28). However, IGFBP-2 (required for osteoclastogenesis) (Citation29) and tissue-type plasminogen activator (osteoclast mediated bone degradation) (Citation30) were significantly increased in cavin-1-PC3-EVs. In addition, membrane proteins 4F2 heavy chain antigen (also known as solute carrier family 3 member 2, SLC3A2 or CD98) and EphA2 were reduced in cavin-1-PC3-EV. Both have documented roles in osteoclastogenesis (Citation31, Citation32).
Table I. Effect of cavin-1 expression on proteins in PC3 EVs with reported roles in bone metastasis
To confirm the cavin-1 effect on the EV-mediated release of these proteins, and to determine whether cavin-1 affected total protein expression or only the release as we previously reported for cytokines (Citation18), we compared the levels of selected proteins in the WCL and EVs from GFP-PC3 and cavin-1-PC3 cells by immunoblotting. As shown in A, caveolin-1 WCL and EV levels were not altered by cavin-1 expression. Cavin-1 itself was not detected in EVs indicating its effects are indirect (A). Calnexin was used as an intracellular membrane marker, which was not detected in EVs (A). We also probed for cofilin and CD63 as known exosome cargo and marker protein, respectively. Interestingly, both cofilin and CD63 were increased in the EVs from cavin-1-PC3 cells compared to GFP-PC3 cells (A). Additionally, CD63 total cellular levels were also elevated in cavin-1-PC3 cells (A), suggesting potential increase in multi-vesicular body formation. In contrast, cavin-1 expression reduced the abundance of 4F2 and EphA2 in EVs without affecting total cellular levels (WCL, A) similar to our previous report for cytokines and proteases (Citation18). This suggests that cavin-1 did not cause a decrease of key bone remodelling molecules on the cellular level but instead altered their secretion through EVs.
Fig. 1. Cavin-1 altered EV proteins and EV miR-148a with no effect on total cellular levels. (A) EVs and whole cell lysates (WCL) were collected from GFP-PC3 and cavin-1-PC3 cells and analysed by Western blot with the indicated antibodies. EV preparations were free from ER protein calnexin. Equal loading was shown by Coomassie staining. Images are representative of 3 biological replicates. Raw images of the western blots are available in figures in Supplementary file. (B) Cavin-1 alters the miRNA content of EVs. Real-time qPCR was performed on cDNA synthesized from equal amounts of RNA extracted from GFP-PC3-EVs and cavin-1-PC3-EVs or total cell lysates. Bar graphs show the mean relative expression±SEM of miR-148a was significantly decreased in cavin-1-PC3-EVs compared to GFP-PC3-EVs (p=0.02, n=3) but expression of miR-148a was unaffected in cells. (C) In contrast, miR-125a was not significantly different between GFP-PC3-EVs and cavin-1-PC3-EVs (n=3).
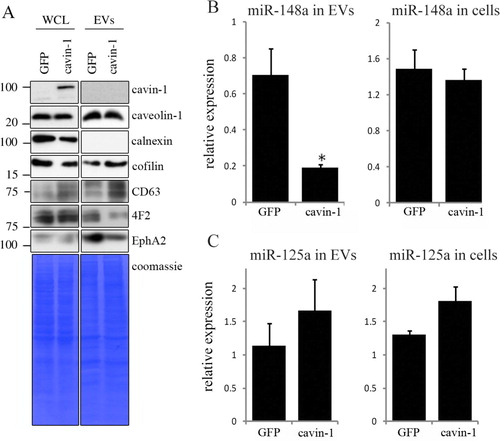
Recent studies show that EVs mediate the transfer of functional microRNA (miRNA) (Citation4, Citation6), and miRNA changes are implicated in osteolytic bone metastasis (Citation33). Therefore, we were interested to investigate if, in addition to proteins, cavin-1 expression altered miRNA secretion via EVs. Based on a review of recent literature, we chose to measure 2 miRNA species, miRNA-148a and miR-125a. Over expression of miR-148a was recently reported to induce osteoclastogenesis and the reverse was observed when miR-148a was inhibited (Citation34). In contrast, miR-125a was reported to be decreased during osteoclastogenesis (Citation34). qPCR performed revealed that PC3-EV miRNA-148a levels were significantly reduced by 3.67±0.014-fold (p =0.02) upon cavin-1 expression without altering total cellular miR-148a levels (B). In contrast, no significant difference was found for miR-125a in either EVs or total cell (C). These results suggest that cavin-1 expression can selectively modulate EV-mediated transfer of miRNA.
Cavin-1 expression attenuates PC3-EV activity
The pathology of bone metastasis is a result of aberrant bone remodelling mediated primarily by 2 cell types, bone-forming osteoblasts and bone-resorbing osteoclasts. Osteoclasts are giant multinucleated cells differentiated from myeloid precursor cells within the bone marrow. Two essential molecules, receptor activator of NF-κB ligand (RANKL) and macrophage colony stimulating factor (M-CSF) stimulate canonical osteoclast differentiation while osteoprotegerin (OPG) acts as a RANKL decoy (Citation35). Prostate cancer cells are known to secrete factors that disrupt the RANKL/OPG regulatory axis and osteoclast activity (Citation36), however, the relative contributions of secreted soluble factors (SF) versus EV have not been assessed.
To establish the in vitro function of EVs on bone cells, we selected murine RAW264.7 pre-osteoclast cells, and human primary osteoblast cells, and assayed the relative abilities of total secretome, and the 2 secretome sub-fractions (SF and EVs) to induce osteoclastogenesis and osteoblast proliferation. Similar to previous studies (Citation25, Citation26), differentiation of RAW264.7 cells to osteoclasts was measured by enumerating multi-nucleated TRAP-positive cells. Optimal cell seeding and secretome treatment conditions were established in preliminary studies (data not shown). Secretome and the sub-fractions were normalized by protein amount. RANKL was used as a positive control (). As expected, total secretome and PC3-EVs induced osteoclastogenesis of RAW264.7 cells compared to the PBS negative control (A, 2B). Interestingly, SF alone was unable to induce osteoclastogenesis, indicating requirement for EV components (B). In agreement, enriched EV more effectively induced osteoclastogenesis compared to total secretome (B). Formation of an F-actin ring is required for effective osteoclast bone resorption (Citation37), and as shown in C, similar proportion of F-actin ring-positive osteoclasts were observed in both PC3-EVs and RANKL-treated conditions, suggesting that PC3-EVs are capable of inducing full osteoclastogenesis. In comparison to GFP-PC3-EV, total secretome from cavin-1-PC3 cells showed ~2-fold less osteoclastogenic activity (B). Surprisingly, cavin-1-PC3-EVs induced TRAP expression (A) but were unable to induce fusion to multi-nucleated cells (A, 2B). This suggests that soluble secreted factors in cavin-1-PC3 secretome are required for fusogenic activity during osteoclastogenesis by PC3-EVs.
Fig. 2. PC3-EV activity is attenuated by cavin-1 expression. (A) RAW264.7 cell differentiation to osteoclast was measured by the number of TRAP-positive (pink) multi-nucleated cells (3 or more nuclei) after treatment for 6 days, as detailed in Methods. Representative microscopic images show negative control (PBS), positive control (RANKL) and effects of GFP-PC3-EV and cavin-1-PC3 EV. Bar=50 µm. (B) RAW264.7 cells were treated with 20 µg/mL of total secretome (Sec.), soluble secretome fraction (SF), EV, or control (PBS or 50 ng/mL RANKL). The number of TRAP-positive multinucleated cells was quantified over 4 independent experiments, each with triplicate wells. Significance from PBS control is indicated by ** p<0.005, ** p<0.0005, **** p<0.00005. (C) Actin rings in osteoclasts were determined by staining with Texas Red conjugated phalloidin to stain for actin (red), and DAPI to stain for nuclei (blue). There was no significant difference between RANKL and GFP-PC3-EV-induced osteoclasts (n=3). Bar=20 µm. (D) Primary hOB cells (3 independent lines) were treated with 5 µg of total secretome (Sec.), soluble secretome fraction (SF), EV, or control (PBS control) for 48 hours. Proliferation was measured by AlamarBlue assay, with 4 replicates per experiment. Significance from PBS control is indicated by *<0.05, ** p<0.005, *** p<0.0005. NS, not significant.
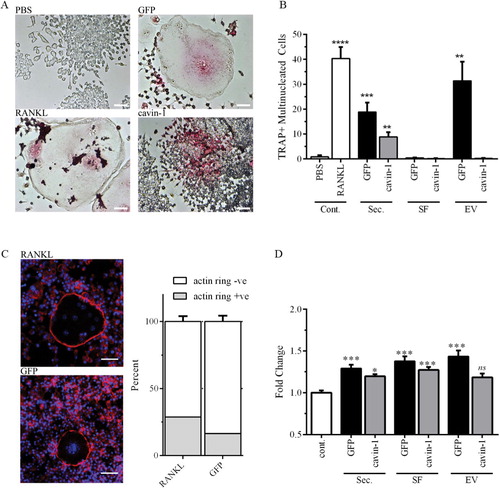
With the exception of cavin-1-EV, secretome treatments significantly increased the proliferation of hOBs compared to PBS control (D). For total secretome and SF, cavin-1 expression significantly reduced the response compared to the respective GFP controls (D). This data suggests that cavin-1 expression reduced the secretion of both soluble and EV components which stimulate hOB proliferation. Interestingly, the magnitude of PC3-EV-induced osteoblast proliferation was only 1.43 fold, compared with a 37-fold increase in osteoclastogensis upon incubation with PC3-EV (C, 2D). These results may explain the predominant osteolytic lesions produced by PC3 cells (Citation38–Citation40), when osteoblastic and mixed osteoblastic/osteolytic bone lesions are common in prostate cancers (Citation41).
Cavin-1 does not affect bulk EV release
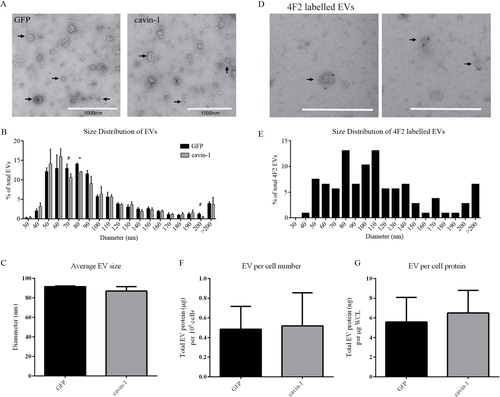
We next asked if the changes in EV molecules upon cavin-1 expression are due to a block in the secretion of a particular subset of EVs. To this end, the morphology and size of the EVs released from GFP-PC3 and cavin-1-PC3 expressing cells was examined using EM (A). Vesicular structures with a very mixed range of diameters between 30 nm and 500 nm, were observed in EV preparations from GFP-PC3 and cavin-1-PC3 cells. Few large oncosomes (>1 µM) recently reported to be secreted by PC3 cells (Citation42, Citation43) were observed. This may be due to differences in EV preparation methods. There was no significant difference in the average diameter of GFP-PC3-EVs and cavin-1-PC3-EVs with mean diameters of 91.54 nm±0.61 nm and 86.86 nm±4.65 nm, respectively (C). To ascertain whether a subset of EVs of a certain size was affected by cavin-1 we analysed the size distribution of EVs using increments of 10 nm diameter (B). Overall the distribution was very similar between GFP-PC3-EV and cavin-1-PC3-EV with a small but statistically significant decrease in EVs 70–80 nm in diameter observed. To examine if this particular subpopulation of EVs may be enriched in the bone associated proteins altered by cavin-1 (Table ), we performed immuno-EM for the membrane protein 4F2 as a marker. Given 4F2 is a single pass membrane protein we reasoned it is likely to be on the surface of EVs, and therefore a candidate for immuno-labelling of EVs. Immuno-EM confirmed 4F2 as an EV surface protein (D), and analysis of the size distribution revealed that 4F2 labelled EVs of various sizes, ranging from 50–280 nm diameter (E). Whilst 4F2 did label vesicles ranging from 70–80 nm, this represented only 14% of the total 4F2 labelled EVs and is unlikely to account for the significant reduction observed in cavin-1-PC3-EVs. Consistently, GFP-PC3 and cavin-1-PC3 cells secreted the same levels of EVs when measured as EV protein concentration relative to cell number or to total cell protein level (F, G). Given the lack of changes in secreted EV total protein and morphology, our data suggests that cavin-1 targets the release of low abundant functional proteins without affecting the overall release of EVs.
Fig. 3. Cavin-1 expression does not change the size or quantity of EVs released. (A) EVs (indicated by arrows) isolated from GFP-PC3 and cavin-1-PC3 cells were inspected by electron microscopy for morphological differences. Scale bar=1000 nm. (B) The diameter of GFP-PC3-EVs (n=916) and cavin-1-PC3-EVs (n=965) was quantitated using ImageJ and represented as a histogram (Each bar indicates the percentage of EVs up to mean diameter±SEM, that is, 40 nm means between 30–40 nm) and (C) the average EV diameter±SEM plotted as a bar graph. No significance difference was observed in the average diameter between GFP-PC3-EVs and cavin-1-PC3-EVs. (D) Representative images of 4F2 immunolabelled EVs showing 4F2 labels a range of different sized EVs. Scale bar=500 nm. (E) The mean diameter±SEM of 4F2 labelled EVs (n=107) were quantitated using ImageJ and represented as a histogram. Each bar indicates up to diameter, i.e. 40 nm means 30–40 nm. The protein concentration of GFP-PC3-EVs and cavin-1-PC3-EVs was quantitated using Bradford assay and normalized to (F) total cell number and (G) µg per whole cell lysate (WCL) protein estimation from the cells they were derived. No significant differences were observed (mean±SEM, n=3).
Cavin-1 reduces EV uptake through surface protein expression
Having established that cavin-1 expression does not alter PC3-EV release, we next investigated if PC3-EV internalization into the target cell is reduced. To establish experimental parameters for the quantitative analysis of PC3-EV uptake, we first characterized the time course of PC3-EV internalization to hOB and RAW264.7 cells in vitro. PC3-EVs were fluorescently labelled with CellVue/Far Red dye and incubated with hOB or RAW264.7 cells for 0, 5, 15, 30 minutes and 1, 2, 20 hours. PC3-EVs that were not internalized or bound to the surface of cells were washed away using PBS. Cells were then fixed using 4% PFA, stained with α-tubulin antibody and observed by confocal microscopy (A). Quantitation was performed using ImageJ to measure total cellular fluorescence, with the results expressed as delta fluorescence intensity by adjusting for background fluorescence (cells without EV incubation). Rapid internalization as early as 5 minutes was observed in both cell types (B). However, uptake was faster in hOB cells with internalization peaking at 30 minutes compared to RAW264.7 cells that peaked at 2 hours (B).
Fig. 4. In vitro uptake of EVs. (A) PC3-EVs were labelled with CellVue Claret and incubated with RAW264.7 or hOB cells at 37°C for the indicated times. Cells were co-stained with anti-tubulin antibody (green staining) and cell surface-bound or cell-internalized EVs were visualized by the red stain. As a control, CellVue dye was centrifuged alongside EVs, and the pellet re-suspended and added to cells (bottom panel). Representative confocal microscopy images are shown. Bar=10 µm. (B, C) EV uptake was quantified using ImageJ to measure total cellular fluorescence for 20–40 cells at each time point, across 3 independent experiments. The background fluorescence of cells incubated with CellVue dye subtracted to derive Δ Mean Fluorescence Intensity (±SEM). (D, E) 20 µg EVs from GFP or cavin-1 PC3 cells were treated with proteinase K, neuraminidase or PBS control, labelled with PKH2 and then incubated with 4×10⁵ RAW264.7 cells seeded in tubes at 37°C for 2 hours. Uptake of fluorescence was determined by flow cytometry, with untreated cells used for background fluorescence levels. Data over 3 independent experiments were analysed for (D)% fluorescent cells and (E) Δ Mean Fluorescence Intensity±SEM.
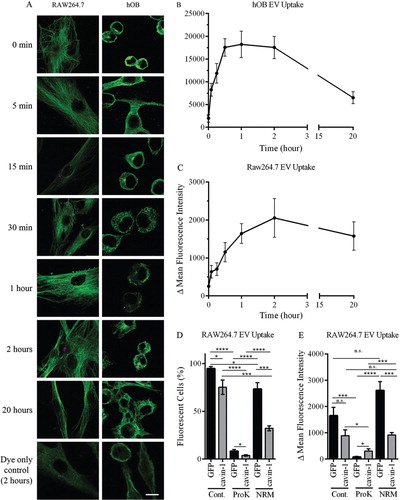
For quantitative comparison of PC3-EV internalization, equal quantities of GFP-PC3-EV and cavin-1-PC3-EVs were labelled with the lipophilic dye PKH2 and added to RAW264.7 macrophage cultures for 2 hours. Cells were washed extensively and cell-associated fluorescence was determined by flow cytometry. These assays provided 2 quantitative measures of EV uptake: percentage of cells which internalized fluorescent EVs, and the relative amount of EVs internalized by those cells (delta mean fluorescence intensity). Fluorescence was detected in 94.7±2.2% of RAW264.7 cells after incubation with GFP-PC3-EVs (C). In comparison, there was a significantly lower percentage of fluorescent cells upon addition of cavin-1-PC3-EVs (75.2±7.5%). Similar results were observed for delta mean fluorescence intensity, but the difference was not statistically significant (p=0.0815, D). These observations suggest that cavin-1 expression attenuated PC3-EV uptake by RAW264.7 cells, potentially by altering the molecular components on the EV surface.
EV surface protein and glycans have been implicated as determinants of EV uptake (Citation44). To investigate the involvement of these components, we utilized proteinase K and neuraminidase to compromise surface protein and sialic acid moieties. By both percentage of fluorescent cells, and the delta mean fluorescence intensity, proteinase K treatment significantly impaired the uptake of GFP-PC3-EVs and cavin-1-PC3-EVs into RAW264.7 cells (D), indicating a key role for surface proteins in EV internalization. Interestingly, the residual uptake after proteinase K treatment remained significantly different between GFP-PC3-EVs and cavin-1-PC3-EVs, suggesting that non-protein determinants altered by cavin-1 expression also play a role in EV uptake.
Surprisingly, neuraminidase treatment differentially affected the internalization of control and cavin-1-PC3-EVs. Similar to proteinase K treatment, neuraminidase treatment also attenuated the percentage of cells internalizing control and cavin-1-PC3-EVs, maintaining the statistical difference between the 2 EV types (D). However, neuraminidase increased the delta mean fluorescence intensity of internalized control PC-3 EVs without significantly altering the delta mean fluorescent uptake of cavin-1-PC3-EVs (E). Taken together, these data suggest that removal of sialic acid from the EV surface either increased the amount of EVs internalized (while reducing the number of cells internalizing) or altered their intracellular itinerary after uptake leading to intracellular accumulation. The differential response to neuraminidase treatment suggests that control and cavin-1-PC3-EVs contain different surface sialic acid moieties.
PC3-EVs target to lung and bone marrow in vivo
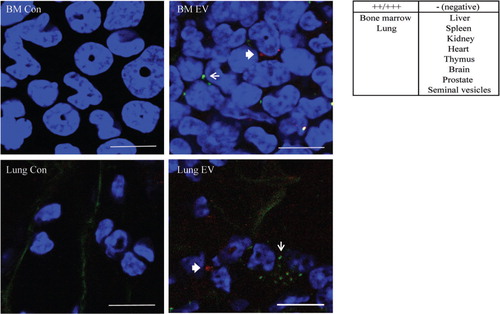
Finally, we examined the in vivo tissue targeting of GFP-PC3-EV and cavin-1-PC3-EV. Equal amount of fluorescently labelled GFP-PC3-EV (PKH2 label, green) and cavin-1-PC3-EV (CellVue/Far Red label, red) were mixed prior to injection into NOD/SCID mice. Control mice were injected with PBS since we have established that incubation with the pellet of the fluorescence dye alone did not lead to fluorescence retention in hOB and RAW264.7 cells in vitro (A). We chose a 24 hour time point to ensure clearance of EVs from the blood and first pass organs such as spleen and liver (Citation45). Selected organs (bone marrow, lung, liver, spleen, kidney, heart, thymus, brain, prostate and seminal vesicle) were then removed, fixed, and EV uptake observed by multiphoton microscopy. Similar to EVs derived from melanoma cell line B16-F10 (Citation13), GFP-PC3-EVs predominately distributed to the bone marrow and the lung, while no fluorescence was observed in the liver, spleen, kidney, heart, thymus, brain, prostate and seminal vesicle (). Importantly, bone and lung are common sites of prostate cancer metastasis in human patients (Citation41). Cavin-1-PC3-EVs were also observed in bone marrow and lung; however, due to the low number of EVs remaining in tissue at the 24 hour time point, we were unable to quantify any difference by confocal microscopy. Similarly, the low level of fluorescence of ex vivo PC3-EVs was not sufficient to be quantitatively measured by the flow cytometry assay used with RAW264.7 cells in the in vitro uptake experiment (C, D). Therefore, while we detected similar tissue distribution between GFP-PC3-EV and cavin-1-PC3-EV, we were unable to confirm quantitative changes in tissue targeting in vivo using current techniques.
Fig. 5. EV in vivo distribution. PKH2 labelled GFP-PC3-EVs (green) and CellVue Claret labelled cavin-1-PC3-EVs (red) were injected into the tail vein of NOD/SCID mice. Control mice were injected with PBS. After 24 hours, the bone marrow, lung, heart, spleen, liver and kidney were excised, fixed in 4% PFA and stained with DAPI (blue) to visualize nuclei. The arrow (GFP-PC3-EVs green) and the bold arrow (cavin-1-PC3-EVs, red) indicate labelled EV uptake observed in bone marrow and lung. Bars=10 µm.
Discussion
The molecular mechanisms regulating tumour-derived EV release and subsequent function, particularly in metastasis, are only beginning to be delineated. As a strategy to inhibit cancer EV release, silencing of Rab27a was very recently employed in prostate cancer DU145 cells with significant reductions observed in the EV levels of exosome marker proteins (TSG101, ALIX, LAMP2) and the target cargo, TGF β1 (Citation16). In contrast, our study revealed a surprising mode of cavin-1 action on the recruitment of functional EV cargo, rather than EV release. Cavin-1 expression had no effect on EV release or in vivo distribution, but attenuated EV uptake and EV-mediated osteoclastogenesis and osteoblast proliferation, most likely by affecting cargo recruitment.
Cavin-1 reduced the EV content of several proteins and at least one miRNA with documented function in bone remodelling (Table , ). IL-6, TGF-β, activin A and IGFBP3 are normally present in the bone microenvironment (Citation46–Citation49), and elevated circulating levels of IL-6, TGF-β and activin A are associated with metastatic prostate cancer (Citation50–Citation53). In this study, we also validated the differential secretion of two EV membrane proteins, EphA2 and 4F2 (A). The receptor tyrosine kinase EphA2 is normally expressed on the surface of osteoclast lineage cells and EphA2 and its ligand EphrinA2 have been shown to facilitate the early stage of bone remodelling by enhancing osteoclastogenesis and suppressing osteoblast differentiation (Citation31). PC3-EV uptake may be a means to increase surface EphA2 levels beyond what is normally expressed. EphA2 over expression in osteoclast precursors was shown to dramatically increase differentiation of osteoclasts (Citation31). 4F2, on the contrary, has been suggested to play a role in the fusion step of osteoclastogenesis (Citation32). A reduction in 4F2 EV levels upon cavin-1 expression is consistent with our observation that cavin-1-PC3-EVs caused TRAP expression but did not lead to formation of multi-nucleated cells (A).
A recent quantitative proteomics analysis of secreted proteins derived from cell lines with varying bone metastasis attributes derived from different cancers, combined with analysis of large clinical metastasis datasets, identified 7 genes (cystatins CST1, CST2 and CST3; plasminogen activators PLAT and PLAU; and collagen functionality proteins PLOD2 and COL6A1) as novel mediators of bone metastasis (Citation54). Interestingly, individual knockdown of each gene did not block bone metastasis, however combined over expression of genes from the same functional group increased bone tumour burden (Citation54). Notably, cavin-1 expression affected each of these functional groups. Cavin-1 significantly reduced the levels of cystatin-B in EVs and similar to other cystatins, cystatin-B has been reported to play a role in bone resorption (Citation55). The bone matrix proteins COL6A1 (collagen VI) and fibronectin were also reduced in EVs after cavin-1 expression, and PLOD2 (procollagen-lysine, 2-oxoglutarate 5-dioxygenase 2) was found as a component of EVs but not changed by cavin-1. An important role for collagen VI in bone metastasis is beginning to emerge with another recent secretome analysis reporting elevated levels of secreted collagen VI from metastatic compared to non-metastatic lung cell lines (Citation56). Finally, cavin-1 altered EV levels of PLAU (urokinase-type plasminogen activator, uPA) and PLAT (tissue-type plasminogen activator, tPA) albeit in opposing directions. These serine proteases are involved in extracellular matrix degradation and have been implicated in osteoclast driven bone resorption (Citation57). Like collagen VI, over expression of uPA increased bone metastasis in a prostate cancer mouse xenograft model (Citation58).
In addition to proteins, our data suggest that cavin-1 also attenuated the sorting of miR-148a into EVs which may contribute to the reduced osteoclastogenic activity (Citation34). A range of studies have implicated miR-148a in breast cancer (Citation59), gastric cancer (Citation60), and metastasis (Citation61), however with seemingly contradictory results. In the androgen-sensitive LNCaP prostate cancer cell line, androgen induced miR-148a expression promoted cell proliferation (Citation62). In contrast, ectopic expression of miR-148a in PC3 cells inhibited cell growth, migration and invasion (Citation63). It is possible that secreted EV miR-148a exerts different functions compared to the primary cancer cell it was expressed in. Further studies on the differential secretion of miRNA through EVs, and the role of cavin-1 in their regulation will be required.
Our data confirms previous reports that PC3 conditioned media can induce osteoclastogenesis from murine RAW264.7 cells (Citation25–Citation27), and further show that PC3-EVs alone are sufficient to enhance osteoclastogenesis in vitro (). However, cavin-1-PC3-EVs were unable to induce full osteoclastogenesis without the soluble secretome (B), indicating the requirement of SF not released via EVs. We also report for the first time that PC3 conditioned media and EVs increase proliferation of primary hOBs (D), although the magnitude of PC3-EV osteoblastic activity was much lower than its osteoclastogenic activity. In contrast to our data, PC3 conditioned media has been reported to suppress primary murine osteoblast proliferation (Citation64, Citation65). The discrepancy may be due to the use of human versus murine osteoblasts.
Our detailed internalization experiments revealed an impairment of cavin-1-PC3-EVs uptake to RAW264.7 cells compared to control PC3-EVs (). However, EV surface determinants required for tissue-specific targeting and retention are not severely disrupted in cavin-1-PC3-EVs as we observed both EV types in lung and bone after injection into NOD/SCID mice ().
A number of mechanisms including phagocytosis, macropinocytosis, and clathrin-dependent endocytosis have been implicated in EV internalization (Citation44, Citation66) (Citation67). Prior studies using PC3-EVs suggest that TGF-β is tethered to the EV membrane through association with betaglycan, a membrane-bound proteoglycan also known as TGF-β type III receptor (Citation68). It is possible that TGF-β binds to its receptor on the target cell, in part mediating EV uptake. Intriguingly, removal of EV surface sialic acid by neuraminidase treatment showed a surprising increase in fluorescence of RAW264.7 cells after EV internalization, while the percentage of fluorescent cells was decreased (D). This may suggest altered intracellular itinerary of the deglycosylated EVs after internalization which decreased degradation of the EVs. A similar increase in cellular fluorescence of internalized fluorescent-EVs following neuraminidase treatment of ovarian cancer-derived EVs was reported in a previous study (Citation44), however, the percentage of fluorescent cells was not reported in that study.
In summary, we show that PC3-EVs are capable of inducing osteoclast differentiation and osteoblast proliferation. Importantly, these effects are attenuated by cavin-1 expression in PC3 cells, consistent with the demonstrated role for cavin-1 as a tumour suppressor in caveolin-1-positive prostate cancer (Citation19). A critical question remains as to how cavin-1 expression selectively reduced the EV levels of a subset of molecules that include cargo, structural, and functional proteins and miRNA. The common denominator may be that these molecules are trafficked by lipid raft-dependent pathways which are altered by cavin-1 expression (Citation18). Further studies will be required to delineate the molecular mechanisms and identify potential targets to reduce the release of pro-metastatic EVs.
Conflict of interest and funding
This project was supported by the Prostate Cancer Foundation Australia. MMH was supported by a Career Development Fellowship from the National Health and Medical Research Council (NHMRC) of Australia (APP 569512), RGP was supported by NHMRC fellowships and grants (grant numbers 569542, 1045092 and 1037320). The authors acknowledge the facilities, and the scientific and technical assistance, of the Australian Microscopy & Microanalysis Research Facility at the Centre for Microscopy and Microanalysis, The University of Queensland.
Supplementary figure
Download PDF (219.7 KB)Acknowledgements
The authors thank Dr Allison Pettit for critical review of the manuscript and Dr Michael Rist for flow cytometry analysis.
Notes
To access the supplementary material to this article, please see Supplementary files under Article Tools online.
Related Research Data
References
- Vela I, Gregory L, Gardiner EM, Clements JA, Nicol DL. Bone and prostate cancer cell interactions in metastatic prostate cancer. BJU Int. 2007; 99: 735–42. [PubMed Abstract].
- Thobe MN, Clark RJ, Bainer RO, Prasad SM, Rinker-Schaeffer CW. From prostate to bone: key players in prostate cancer bone metastasis. Cancers. 2011; 3: 478–93. [PubMed Abstract] [PubMed CentralFull Text].
- Gibbings DJ, Ciaudo C, Erhardt M, Voinnet O. Multivesicular bodies associate with components of miRNA effector complexes and modulate miRNA activity. Nature Cell Biol. 2009; 11: 1143–9. [PubMed Abstract].
- Kosaka N, Iguchi H, Yoshioka Y, Takeshita F, Matsuki Y, Ochiya T. Secretory mechanisms and intercellular transfer of microRNAs in living cells. J Biol Chem. 2010; 285: 17442–52. [PubMed Abstract] [PubMed CentralFull Text].
- Ohshima K, Inoue K, Fujiwara A, Hatakeyama K, Kanto K, Watanabe Y et al. Let-7 microRNA family is selectively secreted into the extracellular environment via exosomes in a metastatic gastric cancer cell line. PLoS One. 2010; 5: e13247. [PubMed Abstract] [PubMed CentralFull Text].
- Valadi H, Ekstrom K, Bossios A, Sjostrand M, Lee JJ, Lotvall JO. Exosome-mediated transfer of mRNAs and microRNAs is a novel mechanism of genetic exchange between cells. Nature Cell Biol. 2007; 9: 654–9. [PubMed Abstract].
- Record M, Carayon K, Poirot M, Silvente-Poirot S. Exosomes as new vesicular lipid transporters involved in cell-cell communication and various pathophysiologies. Biochim Biophys Acta. 2014; 1841: 108–20. [PubMed Abstract].
- Hood JL, Pan H, Lanza GM, Wickline SA. Consortium for Translational Research in Advanced I, Nanomedicine. Paracrine induction of endothelium by tumor exosomes. Lab Investig. 2009; 89: 1317–28. [PubMed Abstract] [PubMed CentralFull Text].
- Nazarenko I, Rana S, Baumann A, McAlear J, Hellwig A, Trendelenburg M et al. Cell surface tetraspanin Tspan8 contributes to molecular pathways of exosome-induced endothelial cell activation. Canc Res. 2010; 70: 1668–78.
- Qu JL, Qu XJ, Zhao MF, Teng YE, Zhang Y, Hou KZ et al. Gastric cancer exosomes promote tumour cell proliferation through PI3K/Akt and MAPK/ERK activation. Dig Liver Dis. 2009; 41: 875–80. [PubMed Abstract].
- Singh PP, LeMaire C, Tan JC, Zeng E, Schorey JS. Exosomes released from M. tuberculosis infected cells can suppress IFN-gamma mediated activation of naive macrophages. PLoS One. 2011; 6: e18564. [PubMed Abstract] [PubMed CentralFull Text].
- Szajnik M, Czystowska M, Szczepanski MJ, Mandapathil M, Whiteside TL. Tumor-derived microvesicles induce, expand and up-regulate biological activities of human regulatory T cells (Treg). PLoS One. 2010; 5: e11469. [PubMed Abstract] [PubMed CentralFull Text].
- Peinado H, Aleckovic M, Lavotshkin S, Matei I, Costa-Silva B, Moreno-Bueno G et al. Melanoma exosomes educate bone marrow progenitor cells toward a pro-metastatic phenotype through MET. Nat Med. 2012; 18: 883–91. [PubMed Abstract] [PubMed CentralFull Text].
- Tavoosidana G, Ronquist G, Darmanis S, Yan J, Carlsson L, Wu D et al. Multiple recognition assay reveals prostasomes as promising plasma biomarkers for prostate cancer. Proc Natl Acad Sci Unit States Am. 2011; 108: 8809–14.
- Ronquist KG, Ronquist G, Larsson A, Carlsson L. Proteomic analysis of prostate cancer metastasis-derived prostasomes. Anticancer Res. 2010; 30: 285–90. [PubMed Abstract].
- Webber JP, Spary LK, Sanders AJ, Chowdhury R, Jiang WG, Steadman R. Differentiation of tumour-promoting stromal myofibroblasts by cancer exosomes. Oncogene. 2014 doi: 10.1038/onc.2013.560.
- Abd Elmageed ZY, Yang Y, Thomas R, Ranjan M, Mondal D, Moroz K et al. Neoplastic reprogramming of patient-derived adipose stem cells by prostate cancer cell-associated exosomes. Stem Cell. 2014; 32: 983–97.
- Inder KL, Zheng YZ, Davis MJ, Moon H, Loo D, Nguyen H. Expression of PTRF in PC-3 Cells modulates cholesterol dynamics and the actin cytoskeleton impacting secretion pathways. Mol Cell Proteomics. 2012; 11: 111 012245.
- Moon H, Lee CS, Inder KL, Sharma S, Choi E, Black DM. PTRF/cavin-1 neutralizes non-caveolar caveolin-1 microdomains in prostate cancer. Oncogene. 2013 doi: 10.1038/onc.2013.315.
- Nassar ZD, Moon H, Duong T, Neo L, Hill MM, Francois M et al. PTRF/Cavin-1 decreases prostate cancer angiogenesis and lymphangiogenesis. Oncotarget. 2013; 4: 1844–55. [PubMed Abstract] [PubMed CentralFull Text].
- Bastiani M, Liu L, Hill MM, Jedrychowski MP, Nixon SJ, Lo HP et al. MURC/Cavin-4 and Cavin family members form tissue-specific caveolar complexes. J Cell Biol. 2009; 185: 1259–73. [PubMed Abstract] [PubMed CentralFull Text].
- Sieh S, Lubik AA, Clements JA, Nelson CC, Hutmacher DW. Interactions between human osteoblasts and prostate cancer cells in a novel 3D in vitro model. Organogenesis. 2010; 6: 181–8. [PubMed Abstract] [PubMed CentralFull Text].
- Hill MM, Bastiani M, Luetterforst R, Kirkham M, Kirkham A, Nixon SJ et al. PTRF-Cavin, a conserved cytoplasmic protein required for caveola formation and function. Cell. 2008; 132: 113–24. [PubMed Abstract] [PubMed CentralFull Text].
- Kaighn ME, Narayan KS, Ohnuki Y, Lechner JF, Jones LW. Establishment and characterization of a human prostatic carcinoma cell line (PC-3). Invest Urol. 1979; 17: 16–23. [PubMed Abstract].
- Araujo JC, Poblenz A, Corn P, Parikh NU, Starbuck MW, Thompson JT et al. Dasatinib inhibits both osteoclast activation and prostate cancer PC-3-cell-induced osteoclast formation. Canc Biol Ther. 2009; 8: 2153–9.
- Yuen HF, Chiu YT, Chan KK, Chan YP, Chua CW, McCrudden CM et al. Prostate cancer cells modulate osteoblast mineralisation and osteoclast differentiation through Id-1. Br J Canc. 2010; 102: 332–41.
- Itoh T, Ito Y, Ohtsuki Y, Ando M, Tsukamasa Y, Yamada N et al. Microvesicles released from hormone-refractory prostate cancer cells facilitate mouse pre-osteoblast differentiation. J Mol Histol. 2012; 43: 509–15. [PubMed Abstract] [PubMed CentralFull Text].
- Mundy GR. Metastasis to bone: causes, consequences and therapeutic opportunities. Nat Rev Canc. 2002; 2: 584–93.
- DeMambro VE, Maile L, Wai C, Kawai M, Cascella T, Rosen CJ et al. Insulin-like growth factor-binding protein-2 is required for osteoclast differentiation. J Bone Miner Res. 2012; 27: 390–400. [PubMed Abstract] [PubMed CentralFull Text].
- Everts V, Daci E, Tigchelaar-Gutter W, Hoeben KA, Torrekens S, Carmeliet G et al. Plasminogen activators are involved in the degradation of bone by osteoclasts. Bone. 2008; 43: 915–20. [PubMed Abstract].
- Irie N, Takada Y, Watanabe Y, Matsuzaki Y, Naruse C, Asano M et al. Bidirectional signaling through ephrinA2-EphA2 enhances osteoclastogenesis and suppresses osteoblastogenesis. J Biol Chem. 2009; 284: 14637–44. [PubMed Abstract] [PubMed CentralFull Text].
- Mori K, Miyamoto N, Higuchi Y, Nanba K, Ito M, Tsurudome M et al. Cross-talk between RANKL and FRP-1/CD98 Systems: RANKL-mediated osteoclastogenesis is suppressed by an inhibitory anti-CD98 heavy chain mAb and CD98-mediated osteoclastogenesis is suppressed by osteoclastogenesis inhibitory factor. Cell Immunol. 2001; 207: 118–26. [PubMed Abstract].
- Ell B, Mercatali L, Ibrahim T, Campbell N, Schwarzenbach H, Pantel K et al. Tumor-Induced osteoclast miRNA changes as regulators and biomarkers of osteolytic bone metastasis. Cancer Cell. 2013; 24: 542–56. [PubMed Abstract].
- Cheng P, Chen C, He HB, Hu R, Zhou HD, Xie H et al. miR-148a regulates osteoclastogenesis by targeting V-maf musculoaponeurotic fibrosarcoma oncogene homolog B. J Bone Miner Res. 2013; 28: 1180–90. [PubMed Abstract].
- Boyle WJ, Simonet WS, Lacey DL. Osteoclast differentiation and activation. Nature. 2003; 423: 337–42. [PubMed Abstract].
- Theriault RL, Theriault RL. Biology of bone metastases. Canc Contr. 2012; 19: 92–101.
- Garbe AI, Roscher A, Schuler C, Lutter AH, Glosmann M, Bernhardt R et al. Regulation of bone mass and osteoclast function depend on the F-actin modulator SWAP-70. J Bone Miner Res. 2012; 27: 2085–96. [PubMed Abstract].
- Corey E, Quinn JE, Bladou F, Brown LG, Roudier MP, Brown JM et al. Establishment and characterization of osseous prostate cancer models: intra-tibial injection of human prostate cancer cells. Prostate. 2002; 52: 20–33. [PubMed Abstract].
- Kalikin LM, Schneider A, Thakur MA, Fridman Y, Griffin LB, Dunn RL et al. In vivo visualization of metastatic prostate cancer and quantitation of disease progression in immunocompromised mice. Canc Biol Ther. 2003; 2: 656–60.
- Fradet A, Sorel H, Depalle B, Serre CM, Farlay D, Turtoi A et al. A new murine model of osteoblastic/osteolytic lesions from human androgen-resistant prostate cancer. PLoS One. 2013; 8: e75092. [PubMed Abstract] [PubMed CentralFull Text].
- Roudier MP, Corey E, True LD, Hiagno CS, Ott SM, Vessell RL. Histological, immunophenotypic and histomorphometric characterization of prostate cancer bone metastases. Canc Treat Res. 2004; 118: 311–39.
- Di Vizio D, Morello M, Dudley AC, Schow PW, Adam RM, Morley S et al. Large oncosomes in human prostate cancer tissues and in the circulation of mice with metastatic disease. Am J Pathol. 2012; 181: 1573–84. [PubMed Abstract] [PubMed CentralFull Text].
- Morello M, Minciacchi VR, de Candia P, Yang J, Posadas E, Kim H et al. Large oncosomes mediate intercellular transfer of functional microRNA. Cell Cycle. 2013; 12: 3526–36. [PubMed Abstract] [PubMed CentralFull Text].
- Escrevente C, Keller S, Altevogt P, Costa J. Interaction and uptake of exosomes by ovarian cancer cells. BMC Canc. 2011; 11: 108.
- Takahashi Y, Nishikawa M, Shinotsuka H, Matsui Y, Ohara S, Imai T et al. Visualization and in vivo tracking of the exosomes of murine melanoma B16-BL6 cells in mice after intravenous injection. J Biotechnol. 2013; 165: 77–84. [PubMed Abstract].
- Chantry AD, Heath D, Mulivor AW, Pearsall S, Baud'huin M, Coulton L et al. Inhibiting activin-A signaling stimulates bone formation and prevents cancer-induced bone destruction in vivo. J Bone Miner Res. 2010; 25: 2633–46. [PubMed Abstract].
- De Benedetti F, Rucci N, Del Fattore A, Peruzzi B, Paro R, Longo M et al. Impaired skeletal development in interleukin-6-transgenic mice: a model for the impact of chronic inflammation on the growing skeletal system. Arthritis Rheum. 2006; 54: 3551–63. [PubMed Abstract].
- Malpe R, Baylink DJ, Linkhart TA, Wergedal JE, Mohan S. Insulin-like growth factor (IGF)-I, -II, IGF binding proteins (IGFBP)-3, -4, and -5 levels in the conditioned media of normal human bone cells are skeletal site-dependent. J Bone Miner Res. 1997; 12: 423–30. [PubMed Abstract].
- Silha JV, Mishra S, Rosen CJ, Beamer WG, Turner RT, Powell DR et al. Perturbations in bone formation and resorption in insulin-like growth factor binding protein-3 transgenic mice. J Bone Miner Res. 2003; 18: 1834–41. [PubMed Abstract].
- Adler HL, McCurdy MA, Kattan MW, Timme TL, Scardino PT, Thompson TC. Elevated levels of circulating interleukin-6 and transforming growth factor-beta1 in patients with metastatic prostatic carcinoma. J Urol. 1999; 161: 182–7. [PubMed Abstract].
- Leto G, Incorvaia L, Badalamenti G, Tumminello FM, Gebbia N, Flandina C et al. Activin A circulating levels in patients with bone metastasis from breast or prostate cancer. Clin Exp Metastasis. 2006; 23: 117–22. [PubMed Abstract].
- Shariat SF, Andrews B, Kattan MW, Kim J, Wheeler TM, Slawin KM. Plasma levels of interleukin-6 and its soluble receptor are associated with prostate cancer progression and metastasis. Urology. 2001; 58: 1008–15. [PubMed Abstract].
- Tumminello FM, Badalamenti G, Incorvaia L, Fulfaro F, D'Amico C, Leto G. Serum interleukin-6 in patients with metastatic bone disease: correlation with cystatin C. Med Oncol. 2009; 26: 10–15. [PubMed Abstract].
- Blanco MA, LeRoy G, Khan Z, Aleckovic M, Zee BM, Garcia BA et al. Global secretome analysis identifies novel mediators of bone metastasis. Cell Res. 2012; 22: 1339–55. [PubMed Abstract] [PubMed CentralFull Text].
- Laitala-Leinonen T, Rinne R, Saukko P, Vaananen HK, Rinne A. Cystatin B as an intracellular modulator of bone resorption. Matrix Biol. 2006; 25: 149–57. [PubMed Abstract].
- Chiu KH, Chang YH, Wu YS, Lee SH, Liao PC. Quantitative secretome analysis reveals that COL6A1 is a metastasis-associated protein using stacking gel-aided purification combined with iTRAQ labelling. J Proteome Res. 2011; 10: 1110–25. [PubMed Abstract].
- Tumber A, Papaioannou S, Breckon J, Meikle MC, Reynolds JJ, Hill PA. The effects of serine proteinase inhibitors on bone resorption in vitro. J Endocrinol. 2003; 178: 437–47. [PubMed Abstract].
- Achbarou A, Kaiser S, Tremblay G, Ste-Marie LG, Brodt P, Goltzman D et al. Urokinase overproduction results in increased skeletal metastasis by prostate cancer cells in vivo. Canc Res. 1994; 54: 2372–7.
- Lehmann U, Hasemeier B, Christgen M, Muller M, Romermann D, Langer F et al. Epigenetic inactivation of microRNA gene hsa-mir-9-1 in human breast cancer. J Pathol. 2008; 214: 17–24. [PubMed Abstract].
- Katada T, Ishiguro H, Kuwabara Y, Kimura M, Mitui A, Mori Y et al. microRNA expression profile in undifferentiated gastric cancer. Int J Oncol. 2009; 34: 537–42. [PubMed Abstract].
- Lujambio A, Calin GA, Villanueva A, Ropero S, Sanchez-Cespedes M, Blanco D et al. A microRNA DNA methylation signature for human cancer metastasis. Proc Natl Acad Sci Unit States Am. 2008; 105: 13556–61.
- Murata T, Takayama K, Katayama S, Urano T, Horie-Inoue K, Ikeda K et al. miR-148a is an androgen-responsive microRNA that promotes LNCaP prostate cell growth by repressing its target CAND1 expression. Prostate Cancer Prostatic Dis. 2010; 13: 356–61. [PubMed Abstract].
- Fujita Y, Kojima K, Ohhashi R, Hamada N, Nozawa Y, Kitamoto A et al. MiR-148a attenuates paclitaxel resistance of hormone-refractory, drug-resistant prostate cancer PC3 cells by regulating MSK1 expression. J Biol Chem. 2010; 285: 19076–84. [PubMed Abstract] [PubMed CentralFull Text].
- Li ZG, Yang J, Vazquez ES, Rose D, Vakar-Lopez F, Mathew P et al. Low-density lipoprotein receptor-related protein 5 (LRP5) mediates the prostate cancer-induced formation of new bone. Oncogene. 2008; 27: 596–603. [PubMed Abstract].
- Schulze J, Albers J, Baranowsky A, Keller J, Spiro A, Streichert T et al. Osteolytic prostate cancer cells induce the expression of specific cytokines in bone-forming osteoblasts through a Stat3/5-dependent mechanism. Bone. 2010; 46: 524–33. [PubMed Abstract].
- Koumangoye RB, Sakwe AM, Goodwin JS, Patel T, Ochieng J. Detachment of breast tumor cells induces rapid secretion of exosomes which subsequently mediate cellular adhesion and spreading. PLoS One. 2011; 6: e24234. [PubMed Abstract] [PubMed CentralFull Text].
- Parolini I, Federici C, Raggi C, Lugini L, Palleschi S, De Milito A et al. Microenvironmental pH is a key factor for exosome traffic in tumor cells. J Biol Chem. 2009; 284: 34211–22. [PubMed Abstract] [PubMed CentralFull Text].
- Webber J, Steadman R, Mason MD, Tabi Z, Clayton A. Cancer exosomes trigger fibroblast to myofibroblast differentiation. Canc Res. 2010; 70: 9621–30.