
Abstract
The Richard Floor Biorepository supports collaborative studies of extracellular vesicles (EVs) found in human fluids and tissue specimens. The current emphasis is on biomarkers for central nervous system neoplasms but its structure may serve as a template for collaborative EV translational studies in other fields. The informatic system provides specimen inventory tracking with bar codes assigned to specimens and containers and projects, is hosted on globalized cloud computing resources, and embeds a suite of shared documents, calendars, and video-conferencing features. Clinical data are recorded in relation to molecular EV attributes and may be tagged with terms drawn from a network of externally maintained ontologies thus offering expansion of the system as the field matures. We fashioned the graphical user interface (GUI) around a web-based data visualization package. This system is now in an early stage of deployment, mainly focused on specimen tracking and clinical, laboratory, and imaging data capture in support of studies to optimize detection and analysis of brain tumour–specific mutations. It currently includes 4,392 specimens drawn from 611 subjects, the majority with brain tumours. As EV science evolves, we plan biorepository changes which may reflect multi-institutional collaborations, proteomic interfaces, additional biofluids, changes in operating procedures and kits for specimen handling, novel procedures for detection of tumour-specific EVs, and for RNA extraction and changes in the taxonomy of EVs. We have used an ontology-driven data model and web-based architecture with a graph theory–driven GUI to accommodate and stimulate the semantic web of EV science.
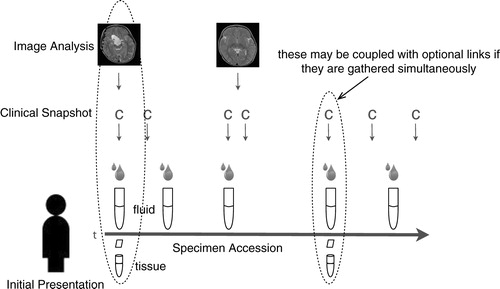
Gliomas are the most common type of primary brain tumour in humans. They include 3 types with varying levels of malignancy: astrocytoma, oligodendroglioma, and mixed oligo-astrocytoma (Citation1). Glioblastoma multiforme (GBM) is the most malignant and common form (WHO Grade IV) with an incidence of about 3 cases/100,000 individuals per year and a 5-year survival rate of about 3% (U.S. Central Brain Tumor Registry; www.cbtrus.org) (Citation2). Standard-of-care treatment may involve surgical biopsy, partial or gross total resection of the lesion, multiple forms of radiation, and specific protocols for chemotherapy. These therapies are not curative for GBM. Treatment decisions are complicated as disease burden is monitored chiefly by magnetic resonance imaging (MRI) and assessment of neurologic symptoms. This presents a significant problem, as after therapy there are frequently abnormal neuroimaging findings due to necrosis and other effects of treatment, which may be difficult to distinguish from tumour regrowth per se. The definitive assay remains re-biopsy of the tumour for neuropathological analysis. Therefore, there is a need for biomarkers to diagnose tumours, to monitor the status of glioma recurrence following surgery and to monitor therapeutic responses. The identification of valid biomarkers is also important in the management of other types of cancer, including breast, lymphoma, melanoma, lung, pancreas, prostate, and colon. Some biomarkers of interest include mutant/variant mRNA of the epidermal growth factor receptor, EGFRvIII, and isocitric dehydrogenase (IDH1/2) mutations preponderantly found in gliomas for which they correlate with survival (Citation3, Citation4). The scientific biomarker pursuit entails significant informatics challenges including those of global specimen assignment and the correlation of clinical, imaging, and research extracellular vesicle (EV) data ().
Fig. 1. A human subject has a disease condition affecting an internal organ that may be directly sampled at risk higher than sampling of fluids such as serum. The fluids may have microvesicles whose analysis may shed light when aggregated to other clinical, laboratory and imaging information on the status of the internal organ. The goal is to develop improved inferential models of the state of the internal organ from fluid microvesicle analysis, and use that model better to guide therapy.
Insofar as EVs may be regarded as fluid-borne biomarker vectors, a biorepository to support EV biomarker science faces informatic challenges beyond those faced by simple tissue biorepositories, commencing with the need to support the benchmarking of EV biomarker assays against solid tissue analyses (Citation5). Moreover, since an additional function of a biomarker is to bridge an intrinsic biological state to a predicted clinical endpoint, an informatic system to support EV biomarker science likewise must record linkage between biological and clinical states (Citation6). The need for biospecimens throughout cancer research has motivated the development of several biorepositories, including offerings by federal governments, academia, and the commercial marketplace Citation7–(Citation9) . To unify some of these offerings, the United States National Cancer Institute maintains a specimen resource locator, which seeks in turn to aggregate catalogues from a number of specimen banks (Citation9). But the development of the dual services sought of a biomarker, both to be a bridging indicator of biological state and to provide a surrogate measure of clinical outcome, pose informatic and other challenges beyond the focus of the valuable existing biorepository resources.
We report a laboratory and clinical information system that supports this fluid-based biomarker search and validation effort. To accommodate maturation in the EV field, we hypothesized the need for informatics to keep pace with scientific advances. Given hypothetical changes in nomenclature, structural distinctions, preparative techniques, proteomics, and collaborative studies, we generated narrative examples of the way in which the system may be used and expressed these examples as use cases. From the use cases we designed the data model and the graphical user interface (GUI) screens. In the future, we will compare actual usage with projected usage, and modify the system to support EVs science as it evolves.
The hypotheses that have driven the system design include global collaboration, multimodal clinical data, ontology tag, and unified data visualization.
Global collaboration hypothesis
Our major focus is the utility of EV-derived mRNAs and non-coding RNAs as diagnostic and therapeutic biomarkers of brain tumours. We assume that collaborators with the Richard Floor Biorepository (http://www.floorbiorepository.org/) and with the ABC2 Brain Tumor Biomarker Consortium (http://abc2.org/) have complementary areas of interest and expertise. Global tertiary centres with large clinical volumes may contribute human specimens to research laboratories. When investigators generate a new causative or correlative hypothesis, they may seek to validate it by analysing specimens drawn from archives. So to maximize efficiency, specimens may need to be stored at and transported between many facilities worldwide. The informatic system must offer global specimen inventory tracking. This is reified in this system in the field and laboratory use cases, described further in the Methods section.
Efficient collaboration is also advanced by the sharing of documents, calendars, electronic bulletin boards, and by live communication through video conferencing. To support this collaborative science use case, we embedded this informatic system in a private Google Apps domain (Citation10).
Multimodal clinical data hypothesis
The detection of subtle relationships between biomarkers or between biomarkers and clinical data may be enhanced when information is aggregated from multiple modalities of clinical data, such as history, comorbidities, medication, physical examination, therapeutic interventions, laboratory results, and radiological imaging exams. For example, the elevation of a certain EV biomarker expression when complemented by magnetic resonance perfusion imaging changes might signify glioma progression more reliably than either alone. This multimodal clinical data hypothesis is reified in the field and clinical data use cases described in the Use cases section.
Ontology tag hypothesis
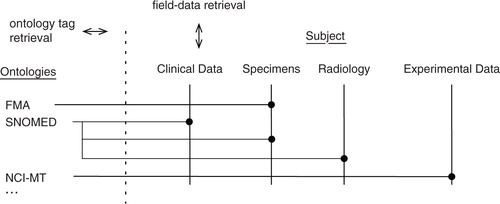
The central nervous system (CNS) has multiple anatomic sites for tumour development. Likewise, there are multiple neuropathological entities and systemic entities, which may correlate with neurologic status and EV biomarkers. We hypothesized that there is a need to expand the scope and flexibility of the system and thus used externally maintained and validated ontologies to tag tissue sources, pathological entities, and other biological events. We anticipate the need to accommodate surprising scientific insights which may emerge. For example, recent studies have correlated single base pair mutations in the isocitric dehydrogenase genes (IDH1/2) with in situ and systemic accumulation of the substrate 2-hydroxyglutaric acid (2HG) as well as tumour-specific promoter methylation. Each of these may correlate with predisposition to inherited disorders, sarcoma, cholangiocarcinoma, and acute myelogenous leukaemia (Citation4). Moreover, a future EV ontology, perhaps one that builds on existing work, could be adopted Citation11–(Citation13) . The United States National Center for Bio Medical Ontology (NCBO) maintains a network of ontologies (Citation14). We designed this biorepository system to mirror those ontologies and to use their world-recognized terms to tag data. The ontology tag hypothesis is reified in the field, clinical data, specimen query described above, and data archive and reporting use cases described in the Use cases section.
Unified data visualization hypothesis
A conventional GUI typically contains a text-based menu structure and presents tabular data as text for viewing and editing. However, humans can grasp much greater volumes of rich and complex data when presented visually rather than textually. We hypothesized the need to accommodate these graphic displays when anticipating changes in concepts of molecular gliomagenesis paths and incorporating recent additions to The Cancer Genome Atlas (TCGA) related to glioma (Citation15, Citation16). Thus, graph methods may prove to be convenient and clear ways to represent networked information that consists of nodes and edges such as complex biological data Citation17–(Citation20) . Examples of such complex biological data include metabolic pathway data (Citation19, Citation21) (Citation22), ontology networks (Citation23), and database structures that link tables with subject, diagnostic, specimen, and outcomes data.
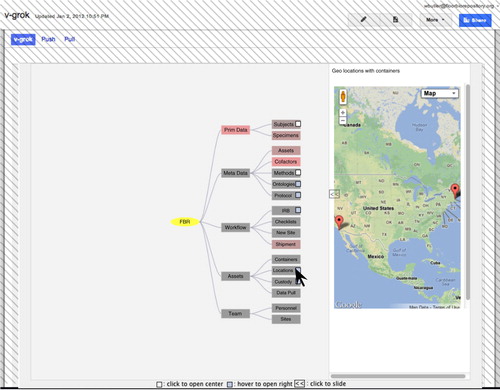
We anticipate the need to accommodate new directions in the science of EVs, including speciation of those obtained from in vitro cell lines, in situ patient specimens, and in vivo animal models, subjected to varying forms of centrifugation and column and filtration separation, and then analysed by transmission electron microscopy (TEM) imaging, immune-gold TEM, nano-particle concentration and size tracking, zeta potential analysis, and lipidomics Citation24–(Citation26) . Hence, we elected to base the GUI on a graph theory paradigm (). An existing data visualization library for the display of networked data is not sufficient for our purposes, but requires 3 additional properties. First, all elements in the GUI must be unified into a single network graph model. This includes programmatic functionality, data query and editing, and meta data maintenance. Second, subject, specimen, and ontology networks may change in response to scientific developments. The system must be able to introspect these data models and modify the network graph model accordingly so that it can be rendered on the screen by the data visualization package. Third, the network graph GUI code must allow the user to query, inspect, and edit data with conventional screen forms, graphic forms, and tabular text formats in the appropriate circumstances.
Fig. 2. Main GUI screen shot. The portion controlled by the Google apps domain is cross hatched. Program functionality, data structures, meta data including ontology networks, and asset relationships are unified into a single network graph theory model. This model is rendered with an open-source data visualization library that we extended to offer interactive data queries and data editing (Citation17). In this example screen shot the mouse hovers over the Locations node, causing an overview map of this global virtual biorepository to appear in the sliding window on the right.
For the development of the web-based GUI, we use an open-source space tree visualization toolkit (Citation27). We augmented the source code to include the additional properties described earlier of unification, of programmatic and data domains, data model introspection, and interactivity. The unified data visualization hypothesis is reified in all use cases since they all are expressed in the GUI.
To address these hypotheses, we surveyed commercially available laboratory specimen–handling computer programs, including Biological Specimen Inventory System (Information Management Services, Inc., http://www.bsisystems.com), a virtual inventory system lacking storage of radiological imaging studies, and a results-handling component, and thus unable to be queried for clinical analytic correlations. However, its web service programming interface provided a useful specimen-tracking component of a larger system. In review of the application programming interface (API) documents, we judged the programming interface to lack sufficient power and flexibility to meet that desired component role.
Methods
A biorepository conventionally supplies methods and resources for the collection, processing, storage/inventory, and distribution of biological specimens, all under a quality management program to promote consistence with evolving standards (Citation28). To serve the particular goal of biomarker identification, this biorepository augments the conventional offering with informatic resources for the acquisition and storage of correlative clinical, laboratory, and imaging data.
Subjects
The eligible experimental subjects are human patients whose clinical care includes sampling of at least one paired lesion tissue and fluid (blood or cerebrospinal fluid) sample as part of a biopsy or resective procedure. At each participating institution, the research protocol was approved by the institutional committee for human subject research, and the subjects sign informed consent before participating.
Specimens
In all instances, the tissue for EV and biomarker studies is provided when clinical needs are met, and thus the tissue is viewed as discarded tissue. Prior to or after diagnosis, biofluids (blood, CSF, urine) may be obtained, aliquoted, and banked for scientific research. Standard operating procedures (SOPs) for sample acquisition are indexed by date and code number for all samples with heavy reliance on the recommendations of the International Society of Extracellular Vesicles () (Citation25, Citation26) (Citation29). The virtual biorepository currently includes 3 fixed locations with postal addresses (partially visible on the right hand panel of ) holding a total of 4,392 physical specimens.
Use cases
The use cases represent narratives of anticipated human interactions with the system.
The field use case refers to use by study personnel. Qualified study personnel may be present in the operating room, the clinic, and the laboratory to acquire tissue and biofluid specimens. The system records the field site and provides unique identifiers for subjects and specimens. The identifiers are applied as bar codes to specimen containers.
The clinical data use case refers to records of clinical presentation, laboratory findings, imaging studies such as magnetic resonance (including the images per se), comorbidities, medications, therapeutic concurrent clinical trials, therapeutic interventions, and outcome metrics, including quality of life, progression-free survival at 6 and 12 months and overall survival. These data are linked to specimens via barcodes to afford biomarker assessment via correlations with tissue and biofluid EV analytic results.
The laboratory use case provides for preparative techniques prior to storage or analysis of biofluids. These techniques include use of specialized tubes, low-speed and high-speed centrifugation, ultracentrifugation, filtration, addition of anticoagulants, addition of stabilizers such as lithium chloride, and reversal of anticoagulants such as heparin. Specimens may need to be prepared differently according to the biofluid, time interval, or analytic requirements according to different protocols. Recording is made of processing and storage variables such as concomitant medications, haemolysis, thrombocytopenia, lymphopenia that may influence analytic results. These SOPs may be contained in documents that are stored in the systems document repository.
The specimen inventory use case refers to the location tracking of all specimens, specimen containers, and fixed storage facilities distributed globally. To quickly locate a given specimen among potentially millions distributed globally, the location of each container and each specimen needs to be tracked. Outer containers and buildings are tracked with respect to their postal addresses and geo coordinates (latitude and longitude). Internal containers and specimens are tracked with respect to their external container and the grid coordinate of their slot in the external container. To find a given specimen, the system thus produces a list of container bar codes and grid coordinates. The specimen inventory use case includes aliquots of specimens and the tracking of residual aliquot quantities as they are consumed by laboratory analysis. The system do not have at this time an explicit method to record specimen-handling exceptions such as those might occur with a freezer failure.
The specimen query use case identifies biorepository specimens to be selected by an investigator for research studies. For example, when specimens are needed for studies of glioma pseudo-progression (Citation30), we support a query of specimens from subjects with glioblastoma who have undergone radiation and whose brain MRI scans reveal oedema manifested by elevated T2 signal and gadolinium enhancement. The system responds to this query with a list of specimens that meet the criteria along with their locations. These specimens may then be transported to the investigators laboratory. The specimen query, inventory, and transport use cases work in coordination.
The specimen transport use case allows the biorepository to be virtual and globally distributed. Some institutions may specialize in acquiring specimens by virtue of their large clinical practices. Other sites may have unique expertise in a particular molecular analytic method. While this coupling enhances efficient science, it requires the transport of specimens. The specimen transport use case thus includes the placement of specimens in a shipping box, recoding the shipper-assigned tracking key, use of the tracking key to monitor the transport of specimens, and the receipt acknowledgement and storage of the specimens by the receiving site.
The collaborative science use case includes the provision of a common platform for investigators to maintain activity calendars, bulletin boards, special interest announcement lists, video-conference tools, and data sharing. This supports the pooling of documents that separate institutions may require such as example documents for institutional committees for research on human subjects, exemplar consent forms, biofluid-handling SOPs, and investigator instruction tutorials.
The clinical data use case refers to records of clinical presentation, laboratory findings, imaging studies (such as magnetic resonance including the images per se), comorbidities, medications, therapeutic concurrent clinical trials, therapeutic interventions, and outcome metrics, including quality of life, progression-free survival at 6 and 12 months and overall survival. These data are linked to specimens via barcodes to afford biomarker assessment via correlations with tissue and biofluid EV analytic results.
These projected use cases drove the following design, programming, and deployment decisions.
System design
The system consists of a custom application built in a 3-tier architecture as commonly employed in contemporary Internet commerce. The custom application is integrated primarily via web services with several external systems, to comprise the biorepository informatic system and its aggregate functionality.
The 3 tiers of the custom application include a structured query language (SQL) server in the data tier, a Java virtual machine (JVM version 1.7.x) in the middle tier (Citation31), and a client tier written in HTML version 5 and JavaScript that is deployed to a web browser. We employ, where available, open-source software libraries (Table ).
Table I. Major open-source libraries that are used by the custom application
In the data tier, we selected Postgres version 9.x as the SQL server for its maturity, robustness, and scalability (Citation32). We leverage its data trigger capabilities to maintain an audit trail. When a record is updated or deleted, the triggers instruct the SQL server to attach a time stamp and copy the record to an audit trail data base for later analysis as needed.
We selected JVM version 1.7.x for the middle tier because its combination of performance, security, language-type safety, memory management, and rich collection of compatible libraries have led it to be the leading language and platform for server applications (Citation31). Most of the middle-tier code is written in Java. We are transitioning to Scala version 2.10.x because it is more expressive and offers functional constructs while preserving type safety (Citation33). It compiles to Java byte codes and has proven in this project to be trivially interoperable with the preceding Java code. Moreover, Scala is convenient for data import tasks because it offers deployment as an interactive language (Citation34). This permits data import scripts to be developed in an interactive fashion.
We employ an object-relational mapping library in the middle tier to transport and operate on the data between the data and client tiers. Because of the ontological richness of biomedical vocabularies, we sought a library that would facilitate the representation of a complex data model in the GUI. With these desiderata, we selected WebObjects because it has a mature object-relational mapping system (Enterprise Objects Foundation) and a rule-based way to map data objects to GUI objects (Direct To Web) Citation35–(Citation37) . With D2W, many core tasks such as presentation in HTML of query, list, and edit screens can be programmed by means of editing a GUI rules file – significantly reducing the quantity of hand-written computer code that needs to be generated, tested, and maintained. This may simplify the task of modifying the system when the science grows in unexpected directions.
In the client tier, the JavaScript language and the jQuery library are used heavily in HTML to control use of the bar code capture device, provide the widgets with live links to the web service maintained by the US NCBO, and implement the screens for visual navigation of the program and data model (Citation38, Citation39).
The software components described earlier are termed the custom application, but they do not comprise the complete informatic system. The application is provided as integrated feature of a larger, complete web-based computing environment. The application was initially provided as a portlet in a Liferay portal deployment (Citation40, Citation41). It is now provided as a Google Gadget that employs the OpenSocial specification (Citation10, Citation42). Thus, the biorepository informatic system described in this paper refers to the integration of this custom application with a private Google Apps for Business account.
Data model
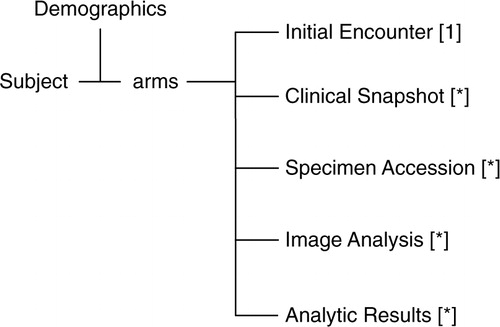
The data model is designed for the gathering of clinical data (symptoms, signs, comorbidities, major interventions, clinical laboratory findings, quality of life, and outcomes) and imaging data (from computed tomography and magnetic resonance imaging) as coupled to fluid and tissue specimens ().
Fig. 3. Overview of the subject data model. The Clinical Snapshot table maintains pointers to sub tables with multimodal clinical data. The Specimen Accession table maintains pointers to sub tables that track the global virtual specimen inventory. The Analytic Results table maintains pointers to sub tables that hold an analytic research methods catalogue and analytic research data as tied to a particular specimen. There are cross pointers not shown between these various tables. Cardinality is in square brackets (* indicates 0 or more). Relationships between the members of the arm are not depicted here.
Specimen data are stored in a collection of tables. There is a SpecimenAccession table that stores information about the acquisition of the specimen such as anatomic site, time, date, geo location, quantity, and related information. This table has a to-many relationship to the SpecimenFraction table that contains a bar code identifier, geo location including a pointer to an enclosing container, and a custody chain record. There are optional pointers between the specimen, the imaging, and the comprehensive clinical data tables.
There are tables that maintain administrative and regulatory compliance information. An audit trail is maintained of all data updates and deletions by coupled use of a Postgres trigger as described earlier.
Other tables maintain information on study personnel and study institutions, including documents pertaining to and status of institutional committees for studies involving human subjects. The tables are mapped to Java objects by the EOF object-relational mapping system included in WebObjects (Citation36).
Bar coding and geo tagging
A unique, machine readable bar code is assigned to every specimen, every specimen container, and every location that contains containers. For example, a laboratory freezer maintained at −80°C may contain several racks, each rack may contain several drawers, each drawer may contain several boxes with dividers, and each cell amidst the dividers may contain a vial with frozen liquid specimen. In this instance, a unique bar code would be on the freezer, the racks, the drawers, the boxes, and the vials.
We employ various methods for bar coding of vials and containers as appropriate for the circumstances. For the small vials to be deep frozen, we selected vials with pre-printed bar codes (Thermo Scientific part #5001-0012). For other bar codes, we employ a bar code printer that prints them on an adhesive tape and then we apply that label to the specimen container. For containers that are already frozen at −80°C and thus may not serve as a sticky surface for a bar code sticker we employ vinyl (Xpress Tags part #TG-2122-WH) or paper tags. The bar code stickers are applied to the tags dry and at room temperature, which are then applied to the frozen container. The bar codes may be read (“gunned”) with a commercial bar code scanner attached via a Universal Serial Bus (USB) computer port (Hewlett Packard part #EY022AA). The bar code scanner reads the identifier code and places it at the cursor point in the active GUI screen.
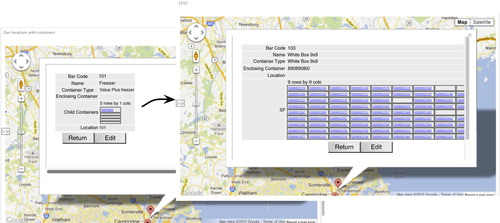
The specimen query, specimen inventory, and specimen transport use cases all for a researcher to be able to search for a specimen from a subject with desired properties, and then for the system to provide a precise set of instructions to physically find that specimen. Since the system is intended to cover the specimen inventory use case with potentially millions of specimens globally distributed in many thousands of containers, the system maintains a recursive geometric map of all container and specimen locations. This is achieved by maintaining in the meta data area of the GUI a list of container types. In the specimen inventory use case, when a bar code that is applied to a new container is gunned, the system recognizes it as a new container, and opens a window prompting user to select the make and model of the container from a drop-down list. When the selection is made, the GUI can then present the contents of the container as a grid of cells. The user places the screen cursor in the field with the row and column corresponding to the grid location of the actual specimen in the container box, and then guns the specimen bar code. This ties that specimen to its particular location in its container. This geometric localization is performed recursively for containers within containers. As a result, the system provides globally geometric navigation of all specimens (; an annotated version from video screen capture is available from http://floorbiorepository.org/resources/Locations.mp4). At the top level, where a container is not within a container but instead is characterized by its geographic longitude and latitude, its location may be displayed on a geographic mapping interface. For this purpose, this system makes calls to the API of Google maps version 3 (Citation43).
Fig. 4. Two consecutive screen shots depicting the recursive geometric localization of specimens. The curved arrow represents the flow of screens when the link in the top row of the Freezer is clicked in the figure on the left. This gives a 9×9 matrix corresponding to the vial slots in the white box. This allows for accountability of specimen locations arose the global biorepository. An annotated version from video screen capture is available from http://floorbiorepository.org/resources/Locations.mp4.
This recursive bar coded geo mapping allows for a global drill down effect in the GUI whereby the user can click with a computer mouse on a symbol representing a container on Google maps. This opens a sub-window with a geometric model of the container's contents, and the user can proceed until an individual specimen is localized. Conversely, a user can identify a specimen based on a query that includes clinical characteristics as described previously, and the system offers a “bread crumb” trail of containers leading to the specimen, thereby facilitating the ability to find physically a desired specimen among potentially millions.
Ontology networks and other meta data
To support the specimen query and data archive and reporting use cases, we designed the system to tag data with terms from any of the ontologies maintained by the US NCBO. Table lists the ontologies currently in use. The NCBO maintains numerous ontologies in a consistent storage scheme that permits a system such as this to easily import NCBO-maintained ontologies. Moreover, the NCBO offers web services and a client side widget written using the jQuery JavaScript library that makes it convenient to include ontology-related data capture tasks in an HTML GUI (Citation14, Citation39). The NCBO widget offers predictive auto-completion behaviour. When a user types characters into the provided text field, the widget issues real time web service calls to the NCBO and offers a drop-down list of matched ontology terms from which the user may select. A modification of this widget is employed throughout this custom application for the user to apply ontology tags to specific elements of multimodal clinical data and to provide a validated vocabulary to specify the anatomic source of a specimen. While certain ontologies such as SNOMED are proprietary intellectual property, their licensing terms are generous for biomedical research use (Citation44, Citation45).
Table II. Externally validated and maintained ontologies currently used in this system
The data model and the ontology comprise networked data structures with intersections (); an annotated version from video screen capture is available from http://floorbiorepository.org/resources/FloorSemanticNetwork.mp4. When a data element is tagged with an ontology term in the GUI using the live widget described earlier, the system creates an entry in a separate table that associates the ontology term with the data element. This allows live cross-cutting queries with ontology terms and enables the use of ontology terms in the specimen query and data archive and reporting use cases, and also allows the use of ontology networks as navigation aids in the network visualization GUI as described in the GUI overview section.
Fig. 5. The data model and the ontology networks are both structured as networks of hierarchical data with intersections. The intersections occur at those particular fields in the data where ontology tags are applied to allow standardized queries. An illustration in the GUI is available from http://floorbiorepository.org/resources/FloorSemanticNetwork.mp4.
Subjects may be enrolled in phase 2 or 3 clinical trials of investigational agents given according to a defined schedule. This trial information may be of importance in interpreting the results of EV RNA or protein analyses. The system maintains a list by subject of clinical trials, with a link to the clinical trial identifier as assigned by clinicaltrials.gov. Users may, in the GUI, record the duration of enrolment in one or multiple trials. These data is then available for query and analysis.
External integrations
This system integrates with several external informatic and computer systems to enhance its functionality and reduce de novo programming tasks. The external integrations are listed in Table . The live link to NCBO has been described earlier.
Table III. External integrations
There are Google integrations that augment functionality in several respects. The name floorbiorepository.org was registered with the Internet Domain Name System (DNS), and a Google Apps for Business account was purchased for it. This account functions as the wrapper for this informatics system. By means of administrative screens supplied by Google, users of this system are assigned a login name and password by a floorbiorepository.org administrator. Authorized users must be assigned to a group within the floorbiorepository.org domain that has authorization to use the various digital resources of this system including the custom application. The custom application described in this paper is deployed in Linux (CentOs 5.x (Citation46)) instances on Amazon Elastic Compute Cloud (EC2) (Citation48). It is embedded in the floorbiorepository.org Google apps domain using the OpenSocial and Google Gadget specifications. When an authorized user logs into the system and navigates to this custom application, a cryptographically signed token is passed from the Google container to the embedded application using the OAuth (a protocol for the secure exchange of authentication and authorization between cooperative systems) (Citation49). The custom application maintains its own list of access permissions. When it receives a cryptographically signed token that is unique to a user, it allows access to that user to elements of information according to its own policies. All exchanges of information between integrated systems are encrypted. In , the cross-hatch area depicts the portion of a typical screen handled by Google Apps whereas the central non cross-hatched area is the custom application. It maintains a set of access policies separate from the Google Apps domain. The privacy and security exposures and their respective countermeasures are further described in the Privacy, security, and permissioning section.
A similar functionality was implemented with the open-source portal Liferay, where the custom application is supplied as a portlet (per the JSR-268 specification) and the Liferay application provides password management, authentication, document sharing, calendar sharing, and social computing services (Citation40, Citation41). Google Apps and Liferay both furnish document libraries that may be user for the shared editing and storage of study documents such as protocols, consent forms, grant applications, manuscripts, and institutional human subjects committee or other regulatory documents. However, we switched to Google Apps as the main option because the users are more familiar with the various Google applications than the Liferay ones, and because Liferay, as a full open-source product, requires one fully to administer the deployment whereas Google Apps are administered by Google. However, the Liferay integration remains as an option.
Google Spreadsheets are used in this system as a medium for data exporting and reporting. The Google Spreadsheets offering includes Apps Script, a programming language and environment that includes facilities for accessing external web services as well as for adding menu items in the spreadsheet GUI (Citation50). We supply a code written in Apps Script to retrieve anonymized subject and specimen data via encrypted web services with proper authorization from the custom application and to insert that data into Google Spreadsheets. This functionality is embedded in selected spreadsheets such that the invocation in the spreadsheet menu of a refresh command causes the retrieval of data from the application into that spreadsheet. This offering allows the ad hoc analysis of data by authorized study personnel (). Moreover, direct access to the SQL tier may be afforded for analysis for research needs not met by data in a spreadsheet format.
Fig. 6. Google spreadsheets may be programmed with the Apps Script programming language and library to make encrypted web service calls to the custom application to retrieve fresh data with which to populate spreadsheets and related analysis and reporting tools. This allows the fresh retrieval of data for analysis as the scientific needs may dictate.
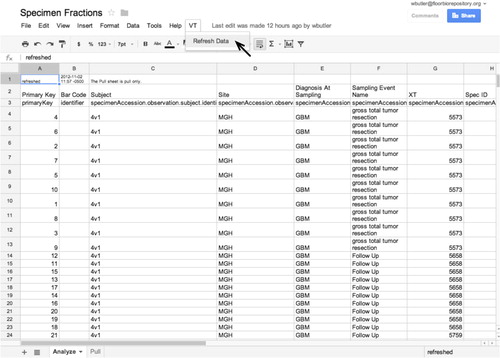
Access to this spread sheet pull capability is compartmented. Authorized users with site scope permission at each participating institution may pull data submitted by that institution. Authorized users with protocol scope permission may pull data pooled across all institutions.
GUI overview
We treat the top levels of the GUI in the custom application as a network data visualization problem. In this formulation, the elements of the data model, meta data, and of program functionality are treated as nodes and the relations between them as edges in a graph (e.g. see the left side of ). As a rendering library, we chose the SpaceTree module of the InfoVis JavaScript library (Citation27). Since this library is open source, we were able to extend it to meet our needs by attaching event handlers to the Document Object Model (DOM) elements that represent nodes as InfoVis renders them in the network graph. The event handlers respond to mouse clicks on the visual node as appropriate, for example, by opening tabular data editing forms on a sliding side window of the GUI. Moreover, we created a declarative programming interface between the InfoVis JavaScript library and the D2W rule-based GUI programming system. We hope this declarative interface facilitates the adaptation to new data structures that may appear in the course of EV science.
The top level nodes in the main screen of the GUI of the custom application are Primary Data, Meta Data, Workflow, Assets, and Team (). When a user clicks on a node, child nodes appear. Some nodes offer extra options, as cued by small icons in the node. For example, in depth information on the topic of the clicked node may appear on a sliding window on the right side of the browser window. The user may choose to expand this to view more detail (in the right side window is unexpanded).
Privacy, security, and permissioning
Table lists the privacy and security exposures that were encountered by this system with the corresponding protective measures. The system conforms to best practices for protection and storage of medical grade data. This includes written policies, checklists as well as confidentially agreements to be signed by investigator-users, and related measures to adhere to the privacy requirements of the Health Insurance Portability Act of America (HIPAA) (Citation52). To adhere to the security requirements of HIPAA, the system employs encryption throughout coupled with password policies (Citation53). The U.S. Food and Drug Administration (FDA), in addition to the Privacy and Security Rules in HIPAA, has guidance documents pertaining to the integrity of research data (Citation54). This system conforms to those guidance documents. The system releases permission parsimoniously to authenticated users to view and edit subject information on a need to know basis. Authorized users may have one of two types of data access scope, site scope and protocol scope. Site scope entitles a user to view and edit data that originates from the user's institution. Most authorized users have site scope. Protocol scope entitles users to view aggregates from across all institutions. Only the overall principal investigator and delegates have protocol scope.
Table IV. Security and privacy measures
For global scale deployment, the World Medical Association provides policy guidance for medical research privacy, and there appears to be convergence in the requirements of various nations Citation55–(Citation57) .
Cloud deployment
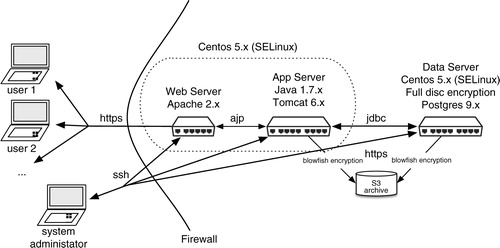
The application is deployed as two separate instances of an EC2 server each running Linux CentOs 5.x, which includes the security enhancements package SELINUX contributed by the United States National Security Agency (Citation46, Citation58). Each server has 2 gigabytes of random access memory. One server holds the database (Postgres version 9.x) and is not web-accessible. There is full disk encryption on the disk that holds the database. There are daily encrypted backups of the database, including the audit trail. The other server runs the middle tier. The Java application is deployed in a Tomcat 6.x container (Citation59). Calls to the application are mediated by Apache 2.x httpd and forwarded to the Tomcat container (Citation60). Encryption policies are stipulated declaratively in the configuration files of the Apache 2.x httpd and Tomcat layers declaratively, in addition to in the wrapper (Google Apps or Liferay) and custom application. As per routine, the EC2 server instances are behind a security firewall ().
Fig. 7. Deployment architecture. The layering enhances stability and security.
Results
The virtual biorepository currently includes 3 fixed locations with postal addresses (). It holds now 4,392 physical specimens that were acquired in 1,443 accessions from 611 subjects. Of those accessions, 1,065 (73.8%) are fluid and 378 (26.2%) are solid tissue.
The specimen anatomic sources are presented with respect to the preferred ontology name given by the Foundational Model of Anatomy in Table , (Citation61) (Citation62) and the pathological diagnoses of tissue specimens with respect to SNOMED in Table , (Citation63).
Table V. Specimen sources reported by preferred ontology name per Foundational Model of Anatomy (Citation50, Citation52)
Table VI. Tissue pathological diagnoses by preferred ontology name per SNOMED (Citation53)
Discussion
We report the initial deployment of a biorepository informatic system whose design is driven by some hypothesized properties of future human EV biomarker research. We hypothesize clinical and basic science research centres collaborating across the world that obligate a coordinated virtual, global specimen inventory management system with global document sharing and social computing features. We hypothesize that novel diagnostic, prognostic, response, toxicity, molecular pathway, and EV biomarker analytics have the best value when correlated with multimodal clinical data, so we include features for multimodal clinical data capture and correlation with experimental EV analysis. We anticipate the need to perform analytics on tightly defined novel patient population cohorts linked by age, tumour appearance on imaging, response or resistance to therapy. We anticipate that EV science may turn in as yet unknown directions, so we include a flexible data model and flexible GUI enriched by externally maintained and validated ontologies. From these hypotheses we derived the use cases that the system ought to support and evolve with the science. They are the field use, clinical data, laboratory, specimen inventory, specimen query, specimen transport, data archive and reporting, and collaborative science use cases. The use cases drove the data model design, the software code creation, the external integration selections, and the deployment decisions.
This software development process where one hypothesizes needs, builds the system, evaluates its usage, and rebuilds it accordingly, shares features with the software development methodology named Behavior Driven Development (BDD) (Citation64). In BDD, the challenges recursively are identified first, and design and deployment choices follow. To some extent, the flexibility to handle unknowability was built into the system. One method is by grouping all elements that belong in the GUI into a single network graph model that is then rendered visually, we hope to allow complex and possibly evolving elements to be intuited visually. A second method is by employing a rule-based GUI programming system, that introspects on the data model and draws GUI elements accordingly, we increase the ease with which evolutions in the data model can be incorporated. If over time the challenges change or the current system as designed does not meet them satisfactorily, we aim to re-evaluate and change the system accordingly.
Data visualization in the web browser is an area of active growth. We selected the InfoVis library because it excels at the display of network graph data, and as an open-source project, its source code is available for modification to meet the custom needs of this system (Citation27). Among other JavaScript-based data visualization open-source libraries that offer network graph visualization modules, Data Driven Documents (D3.js) has a broad range of applicability, and has been used in various bioinformatics applications such as gene ontology visualization (Citation65, Citation66). The selection here of InfoVis is a matter of convenience, and other options such as D3.js could be adopted when they meet better the needs as may arise.
We selected Postgres as the database server software because of its resilience, performance, and because it can be configured to handle maintenance of the data audit trail. However, as a relational database it does not map naturally to network graph data because each node traversal requires an expensive SQL join operation (Citation67). A number of graph databases have been introduced that are optimized for the storage of data richly populated with nodes and edges. These graph databases have efficient traversal of edges during query tasks (Citation19, Citation67). A graph database might be programmed more conveniently to coordinate with a network graph oriented GUI as we have implemented here.
One graph database, Bio4j, a bioinformatics-oriented derivative of Neo4j, comes prepopulated with data from UniProt KB, Gene Ontology, UniRef, RefSeq, NCBI taxonomy, and Expasy Enzyme DB (Citation47). At installation, Bio4j version 0.8 thus has more than 190 million nodes and more than 1.2 trillion edges (relationships between nodes) (Citation68). A transition from Postgres to Bio4j would offer the inclusion of these ontologies for potential use in this system, possibly affording in turn a rich platform for the incorporation of an EV ontology. Such an ontology may leverage underway efforts in EV systematics such as ExoCarta, Vesiclepedia, and LIPID MAPS Citation11–(Citation13, Citation69) . The combination of Bio4j with this system's graph-oriented GUI may also offer a convenient way to implement the visualization of EV-related metabolic pathways in relation to other metabolic, proteomic, or genomic pathways.
Since biomedical software applications commonly have complex data models, one may expect it to be helpful to have application authoring systems that can automate the generation of the GUI from the data model Citation70–(Citation73) . By reducing programmer workload, these extend the possible scope of other programming tasks. However, we find these systems to be inflexible for this application because we need the GUI to render differently according to the context. For example, the same data elements may need to be grouped differently, be editable, or displayed at all according to the user's authorizations and the use case. Instead, we prefer a system where the GUI behaviours may be coded in a set of rules that a programmer can edit. The result, a GUI that requires less programmer work to generate than if the client side code were written by hand, yet remains programmable within large bounds. The resulting compromise meets well the needs of developing research biomedical GUIs, and there is active research in the area of rule-based GUI generation Citation70–(Citation73) .
The various use cases are deployed to the user on a web browser in this system as currently programmed and deployed, but some use cases may be supported better by lighter weight, mobile table-style devices with the application written in a native library rather than for a web browser. For example, the clinical data use case may call for personnel to go to an outpatient clinic setting to capture clinical and outcomes data. The specimen inventory use case may call for personnel to present to a pathology laboratory to acquire tissue not needed for diagnosis. In each of these instances, the use case may be served more efficiently if the study personnel carried a tablet device with which to enter a new specimen and its bar code or to capture more clinical data. We intend thus to observe the usage patterns of the current setup, and as needed create, test and deploy tablet device interfaces.
Virtualized (cloud) deployment allows increased specialization and lowers the cost of deployment (Citation74). The specialization refers both to hardware and software services. The hardware includes the rental of computer units, input/output bandwidth, and long-term storage. The software services are, among others, the maintenance of passwords and the offering of authentication and authorization services. Systems administration tasks are automated by the data centre or are managed by data centre personnel, who have training in and conform to best practice guidelines in the numerous tasks involved in deployment. This lowers the complexity and cost of global, multitiered deployment. This, in turn, allows the developers to focus on design and programming.
The cloud deployment provider selected for this deployment meets security standards much higher than can be met for example with self-managed deployment. The data centres offer multilayered firewalls, intrusion detection, and proactive security policies. The cloud deployment provider selected for this custom application has multiple security certifications and has undergone multiple security and quality audits. These include ISO 27001 certification (Citation75), Payment Card Industry (PCI) Data Security Standard (DSS) Level 1 certification, Federal Information Security Management Act (FISMA) Moderate Authorization and Accreditation, and Federal Information Processing Standard (FIPS) Publication 140–2 validation (Citation76). Moreover, it hosts HIPAA-compliant commercial services.
This biorepository informatic system is currently in an early phase of implementation. It is chiefly tasked now with the recording of clinical, laboratory, and imaging data, and the geo tracking of specimens. As time passes, the usage patterns will be where the underlying hypotheses are tested. Other informatic systems with a narrower purpose may prove to be a better choice for specific tasks covered comprehensively by this system. For example, projects such as OpenPHACTS may provide generic tools for data storage and sharing that may obviate this independent offering in this system (Citation77). Other systems may be embedded into the GUI of this one if their architecture lends to integration with single sign on services and the cross embedding of HTML fragments.
The US National Institutes of Health published a request for applications to build an informatic system for extracellular RNA that includes the concept of an ExRNA Atlas (Citation78). If an EV ontology were to be developed, for example, as part of the proposed ExRNA Atlas, it could be added to the network of ontologies used by this and other systems participating in EV research. The unified representation of EV-related information might help disparate computer systems coordinate a response to automated or human-directed query and retrieval tasks. These disparate systems may include existing repositories of EV data Citation11–(Citation13, Citation79) . The sum may be a semantic web that accelerates insight into the integrative biology of EVs, including their possible role in intercellular and inter-organ communication (Citation80, Citation81).
Conclusion
We created an informatics system to support EV biomarker research. This biorepository informatics system represents a hypothesis-driven experiment on the future course of microvesicle research. Rigorous methods do not exist to test the performance of this system against the actual needs of the field as it develops, so the question of whether the hypotheses represented here is confirmed by the data will likely be addressed only qualitatively. We hope we have built a system that may evolve with EV science.
Conflict of interest and funding
This work was supported by the Richard Floor Fund to the Massachusetts General Hospital and grant UH2TR000931 provided by the NIH Common Fund, through the Office of Strategic Coordination/Office of the NIH Director and NCI grant 5P01CA069246-17 (FHH).
Acknowledgements
Ryan Kim, Sarada Sivaraman, and Lin Dan Zhu provided essential feedback as early users of the system. We acknowledge the editorial help of Dr. C.J.F. Van Noorden.
References
- Louis DN, Ohgaki H, Wiestler OD, Cavenee WK, Burger PC, Jouvet A et al. The 2007 WHO classification of tumours of the central nervous system. Acta Neuropathol. 2007; 114: 97–109.
- Sathornsumetee S, Rich JN, Reardon DA. Diagnosis and treatment of high-grade astrocytoma. Neurol Clin. 2007; 25: 1111–39. x.
- Mellinghoff IK, Wang MY, Vivanco I, Haas-Kogan DA, Zhu S, Dia EQ et al. Molecular determinants of the response of glioblastomas to EGFR kinase inhibitors. N Engl J Med. 2005; 353: 2012–24.
- Baldewpersad Tewarie NM, Burgers IA, Dawood Y, den Boon HC, den Brok MG, Klunder JH et al. NADP+ -dependent IDH1 R132 mutation and its relevance for glioma patient survival. Med Hypotheses. 2013; 80: 728–31.
- Aronson JK. Biomarkers and surrogate endpoints. Br J Clin Pharmacol. 2005; 59: 491–4.
- Prentice RL. Surrogate and mediating endpoints: current status and future directions. J Natl Cancer Inst. 2009; 101: 216–17.
- Amin W, Parwani AV, Schmandt L, Mohanty SK, Farhat G, Pople AK et al. National Mesothelioma Virtual Bank: a standard based biospecimen and clinical data resource to enhance translational research. BMC cancer. 2008; 8: 236.
- BioServe – Molecular Services. Human DNA, RNA, Serum and Tissue Bank. Repository Network. [cited 2014 May 30]. Available from: http://www.bioserve.com/.
- Home Page – Biorepositories and Biospecimen Research Branch. [cited 2014 May 30]. Available from: http://biospecimens.cancer.gov/default.asp.
- Google Apps for Business. Google, Inc. 2014. [cited 2014 August 15]. Available from: http://www.google.com/intl/en/enterprise/apps/business/.
- Kalra H, Simpson RJ, Ji H, Aikawa E, Altevogt P, Askenase P et al. Vesiclepedia: a compendium for extracellular vesicles with continuous community annotation. PLoS Biol. 2012; 10: e1001450.
- Kim DK, Kang B, Kim OY, Choi DS, Lee J, Kim SR et al. EVpedia: an integrated database of high-throughput data for systemic analyses of extracellular vesicles. J Extracell Vesicles. 2013; 2 20384.
- Mathivanan S, Fahner CJ, Reid GE, Simpson RJ. ExoCarta 2012: database of exosomal proteins, RNA and lipids. Nucleic Acids Res. 2014; 40: D1241–4.
- US National Center for Bio Medical Ontology (NCBO). 2014. [cited 2014 May 30]. Available from: http://www.bioontology.org/.
- Sintupisut N, Liu PL, Yeang CH. An integrative characterization of recurrent molecular aberrations in glioblastoma genomes. Nucleic Acids Res. 2013; 41: 8803–21.
- Cancer Genome Atlas Research Network. Comprehensive genomic characterization defines human glioblastoma genes and core pathways. Nature. 2008; 455: 1061–8.
- Rohn H, Junker A, Hartmann A, Grafahrend-Belau E, Treutler H, Klapperstuck M et al. VANTED v2: a framework for systems biology applications. BMC Syst Biol. 2012; 6: 139.
- Rohn H, Klukas C, Schreiber F. Creating views on integrated multidomain data. Bioinformatics. 2011; 27: 1839–45.
- Pavlopoulos GA, Secrier M, Moschopoulos CN, Soldatos TG, Kossida S, Aerts J et al. Using graph theory to analyze biological networks. BioData Min. 2011; 4: 10.
- Chao SY. Graph theory and analysis of biological data in computational biology. InTech. 2009. [cited 2014 May 30]. Available from: http://www.intechopen.com/books/advanced-technologies/graph-theory-and-analysis-of-biological-data-in-computational-biology.
- Croft D, Mundo AF, Haw R, Milacic M, Weiser J, Wu G et al. The Reactome pathway knowledgebase. Nucleic Acids Res. 2014; 42: D472–7.
- Kumar A, Suthers PF, Maranas CD. MetRxn: a knowledgebase of metabolites and reactions spanning metabolic models and databases. BMC Bioinformatics. 2012; 13: 6.
- Sowa JF. Conceptual structures: information processing in mind and machine. 1984; Reading, MA: Addison-Wesley. The Systems programming series.
- Filipe V, Hawe A, Jiskoot W. Critical evaluation of Nanoparticle Tracking Analysis (NTA) by NanoSight for the measurement of nanoparticles and protein aggregates. Pharm Res. 2010; 27: 796–810.
- Momen-Heravi F, Balaj L, Alian S, Mantel PY, Halleck AE, Trachtenberg AJ et al. Current methods for the isolation of extracellular vesicles. Biol Chem. 2013; 394: 1253–62.
- Momen-Heravi F, Balaj L, Alian S, Tigges J, Toxavidis V, Ericsson M et al. Alternative methods for characterization of extracellular vesicles. Front Physiol. 2012; 3: 354.
- Belmonte NG. JavaScript InfoVis Toolkit ver. 2.01. 2013. [cited 2014 May 30]. Available from: http://philogb.github.com/jit/.
- Biorepository Accreditation Program Standards for Accreditation. College of American Pathologists. 2013. [cited 2014 May 30]. Available from: http://www.cap.org/apps/docs/laboratory_accreditation/build/pdf/bap_standards.pdf.
- Witwer KW, Buzas EI, Bemis LT, Bora A, Lasser C, Lotvall J et al. Standardization of sample collection, isolation and analysis methods in extracellular vesicle research. J Extracell Vesicles. 2013; 2 20360.
- Brandes AA, Tosoni A, Spagnolli F, Frezza G, Leonardi M, Calbucci F et al. Disease progression or pseudoprogression after concomitant radiochemotherapy treatment: pitfalls in neurooncology. Neuro Oncol. 2008; 10: 361–7.
- Oracle. Oracle Java ver. 1.7.x. Oracle Corporation. 2014. [cited 2014 May 30]. Available from: http://www.java.com.
- PostgreSQL Global Development Group. PostgreSQL ver. 9.2.x. 2014. [cited 2014 May 30]. Available from: http://www.postgresql.org/.
- Odersky M. Scala ver. 2.10.x. École Polytechnique Fédérale de Lausanne (EPFL). 2014. [cited 2014 May 30]. Available from: http://www.scala-lang.org/.
- Odersky M. The Interactive Interpreter (REPL) Scala ver. 2.10.x. École Polytechnique Fédérale de Lausanne (EPFL). 2014. [cited 2014 May 30]. Available from: http://www.scala-lang.org/node/2097.
- Apple. WebObjects ver 5.4.3. Apple, Inc. 2008. [cited 2014 August 15]. Available from: https://www.apple.com/support/webobjects/.
- Apple. Enterprise Objects Framework (EOF). 2007. [cited 2014 August 15]. Available from: http://developer.apple.com/legacy/mac/library/documentation/WebObjects/Enterprise_Objects/EnterpriseObjects.pdf.
- Gurley R, Robert P. The D2W rule system. [cited 2014 August 15]. Available from: http://wiki.wocommunity.org/display/documentation/The+D2W+Rule+System.
- Foundation j. jQuery ver. 1.9.x. jQuery Foundation. 2014. [cited 2014 August 15]. Available from: http://jquery.com/.
- NCBO Widgets. Term-selection field on a form. U.S. National Center for Bio Medical Ontology. 2014. [cited 2014 August 15]. Available from: http://www.bioontology.org/wiki/index.php/NCBO_Widgets#Term-selection_field_on_a_form.
- Liferay ver. 6.x. Liferay, Inc. 2014. [cited 2014 August 15]. Available from: http://www.liferay.com.
- JSR 286: Portlet Specification. Oracle Corporation. 2013. [cited 2014 August 15]. Available from: https://jcp.org/aboutJava/communityprocess/final/jsr286/.
- OpenSocial ver. 2.x. OpenSocial Foundation. 2014. [cited 2014 August 15]. Available from: http://docs.org/display/OS/Home.
- Google Maps API ver. 3.x. Google, Inc. 2014. [cited 2014 August 15]. Available from: https://developers.google.com/maps/.
- SNOMED Clinical Terms® (SNOMED CT®) [Product, program, and project descriptions]. [cited 2014 August 15]. Available from: http://www.nlm.nih.gov/research/umls/Snomed/snomed_main.html.
- UMLS Terminology Services – License. [cited 2014 August 15]. Available from: https://uts.nlm.nih.gov/license.html.
- The CentOs Project. CentOS-5 documentation. [cited 2014 August 15]. Available from: http://www.centos.org/docs/5/.
- bio4j ver. 0.9. 2014. [cited 2014 August 15]. Available from: http://bio4j.com.
- Amazon Web Services. Amazon Elastic Compute Cloud (EC2) – Scalable Cloud Servers. [cited 2014 August 15]. Available from: http://aws.amazon.com/ec2/.
- OAuth. 2014. [cited 2014 August 15]. Available from: http://oauth.net.
- Apps Script. Google, Inc. 2014. [cited 2014 August 15]. Available from: http://developers.google.com/apps-script/.
- NCI Metathesaurus. vol. 2.3. 2014; U.S. National Cancer Institute. [cited 2014 August 15]. Available from: http://ncimeta.nci.nih.gov/ncimbrowser/.
- Summary of the HIPAA privacy rule. U.S. Department of Health & Human Services. 2014. [cited 2014 August 15]. Available from: http://www.hhs.gov/ocr/privacy/hipaa/understanding/summary/index.html.
- U.S. Department of Health & Human Services. HIPAA administrative simplification statute and rules – security rule. 2014. [cited 2014 August 15]. Available from: http://www.hhs.gov/ocr/privacy/hipaa/administrative/securityrule/securityruleguidance.html.
- Office of the Commissioner, U S Food and Drug Administration. Guidance for industry. Computerized systems used in clinical investigations. 2007; U.S. Department of Health and Human Services. [cited 2014 August 15]. Available from: http://www.fda.gov/downloads/Drugs/GuidanceComplianceRegulatoryInformation/Guidances/UCM070266.pdf.
- WMA declaration of Helsinki – ethical principles for medical research involving human subjects. [cited 2014 August 15]. Available from: http://www.wma.net/en/30publications/10policies/b3/.
- WMA declaration on ethical considerations regarding health databases. [cited 2014 August 15]. Available from: http://www.wma.net/en/30publications/10policies/d1/.
- Medical privacy in principle. Privacy International. [cited 2014 August 15]. Available from: https://www.privacyinternational.org/reports/privacy-and-security-in-developing-countries-and-emergency-sitmedical-privacy-in
- Security-Enhanced Linux (SELINUX). U.S. National Security Agency, Central Security Service. 2009. [cited 2014 August 15]. Available from: http://www.nsa.gov/research/selinux/.
- Tomcat ver. 6.x. The Apache Software Foundation. 2013. [cited 2014 August 15]. Available from: http://tomcat.apache.org/.
- The Apache Software Foundation. 2014. httpd 2.x. [cited 2014 August 15]. Available from: http://www.apache.org.
- Rosse C, Mejino JL Jr. A reference ontology for biomedical informatics: the Foundational Model of Anatomy. J Biomed Inform. 2003; 36: 478–500.
- Nichols BN, Mejino JL, Detwiler LT, Nilsen TT, Martone ME, Turner JA et al. Neuroanatomical domain of the foundational model of anatomy ontology. J Biomed Semantics. 2014; 5: 1.
- SNOMED-CT Standard Nomenclature in Medicine Clinical Terms. International Health Terminology Standards Development Organisation. 2014. [cited 2014 August 15]. Available from: http://www.ihtsdo.org/snomed-ct/.
- North D. Behavior driven development. [cited 2014 August 15]. Available from: http://leanagilemachine.blogspot.com/p/bdd.html.
- Bostock M. Data driven documents D3.js. 2013. [cited 2014 August 15]. Available from: http://d3js.org/.
- Kao D. Code: gene ontology data visualization with D3.js and python. 2012. [cited 2014 August 15]. Available from: http://blog.nextgenetics.net/?e=19 vol. 2014.
- Vicknair C, Macias M, Zhendong Z, Nan Z, Chen Y, Wilkins D. A comparison of a graph database and a relational database: a data provenance perspective. The 48th ACM Southeast Conference. vol. 10. [cited 2014 May 30]. Available from: http://www.cs.olemiss.edu/ychen/publications/conference/vicknair_acmse10.pdf.
- Pareja P. Bio4j 0.9 the billion relationships are here!. vol. 2014. oh no sequences!. 2013. [cited 2014 May 30]. Available from: http://bio4j.com/blog/2013/10/bio4j-09-the-billion-relationships-is-here/.
- Cotter D, Maer A, Guda C, Saunders B, Subramaniam S. LMPD: LIPID MAPS proteome database. Nucleic Acids Res. 2006; 34: D507–10.
- Spring ROO ver. 1.2.3. Spring Source, VMWare, Inc. 2012. [cited 2014 May 30]. Available from: http://www.springsource.org/spring-roo.
- Ruby on Rails ver. 4.0.x. 37 Signals. 2013. [cited 2014 May 30]. Available from: http://rubyonrails.org.
- GoPivotal. Grails 2.3.x. GoPivotal, Inc. 2014. [cited 2014 May 30]. Available from: http://grails.org.
- Federighi C, Ngan K. AribaWeb ver. 5.2. Ariba, Inc. 2013. [cited 2014 May 30]. Available from: http://aribaweb.org/.
- Mergen MF, Uhlig V, Krieger O, Xenidis J. Virtualization for high-performance computing. SIGOPS Oper Syst Rev. 2006; 40: 8–11.
- ISO 27001. International Standards Organization. 2014. [cited 2014 May 30]. Available from: http://27000.org/iso-27001.htm.
- AWS Security Center. Amazon Web Services. 2013. [cited 2014 May 30]. Available from: http://aws.amazon.com/security/.
- Williams AJ, Harland L, Groth P, Pettifer S, Chichester C, Willighagen EL et al. Open PHACTS: semantic interoperability for drug discovery. Drug Discov Today. 2012; 17: 1188–98.
- RFA-RM-12-010. Data Management and Resource Repository (DMRR) on Extracellular RNA (U54). 2012. [cited 2014 May 30]. Available from: http://grants.nih.gov/grants/guide/rfa-files/RFA-RM-12-010.html.
- Choi DS, Kim DK, Kim YK, Gho YS. Proteomics of extracellular vesicles: exosomes and ectosomes. Mass Spectrom Rev. 2014
- Mathivanan S, Ji H, Simpson RJ. Exosomes: extracellular organelles important in intercellular communication. J Proteomics. 2010; 73: 1907–20.
- Chen H, Yu T, Chen JY. Semantic web meets integrative biology: a survey. Brief Bioinform. 2013; 14: 109–25.