
Abstract
Despite an enormous interest in the role of extracellular vesicles, including exosomes, in cancer and their use as biomarkers for diagnosis, prognosis, drug response and recurrence, there is no consensus on dependable isolation protocols. We provide a comparative evaluation of 4 exosome isolation protocols for their usability, yield and purity, and their impact on downstream omics approaches for biomarker discovery. OptiPrep density gradient centrifugation outperforms ultracentrifugation and ExoQuick and Total Exosome Isolation precipitation in terms of purity, as illustrated by the highest number of CD63-positive nanovesicles, the highest enrichment in exosomal marker proteins and a lack of contaminating proteins such as extracellular Argonaute-2 complexes. The purest exosome fractions reveal a unique mRNA profile enriched for translation, ribosome, mitochondrion and nuclear lumen function. Our results demonstrate that implementation of high purification techniques is a prerequisite to obtain reliable omics data and identify exosome-specific functions and biomarkers.
To access the supplementary material to this article, please see Supplementary files under Article Tools online.
Tumours are ecosystems characterized by an intense communication between cancer cells and stromal cells. These ecosystems establish para- and endocrine- signalling networks that support invasive growth and metastasis, and consist of soluble factors as well as membrane-bound ligands and receptors, free or enclosed in small extracellular vesicles (EVs), including exosomes (Citation1). Exosomes are bilayered and nm-sized (50–150 nm) EVs that express a characteristic set of proteins [heat-shock protein (HSP)90α, HSP70, CD63, Alix and TSG101] and are released by fusion of multivesicular endosomes (MVE) with the plasma membrane (Citation2). The observation that exosomes contain not only proteins but also RNA species promoted them as potential powerful communicators in both local and distant tumour ecosystems and caused a paradigm shift in current cancer research (Citation3). This is reflected in the rapid growth of the number of publications, a trend driven by the growing interest in revealing exosome functions and discovering diagnostic, prognostic and therapeutic biomarkers.
One important challenge is the lack of standard methods to obtain highly pure and well-characterized exosome populations. A literature search of full-text available research articles published in the years 2011–2013 with the key words “exosomes,” “cancer” and “human” revealed that different methods are implemented to isolate exosomes for functional studies and biomarker discovery, including (differential) ultracentrifugation (UC) (56%), density gradient- or cushion-based UC (27%) and ExoQuick™ precipitation (13%). Additionally, new methods are being commercialized, such as the Total Exosome Isolation™ precipitation solution, and are finding their way to common practice. A robust method with the ability to minimize co-isolating protein aggregates and other membranous particles is a prerequisite to identify consistent and biologically relevant exosome-specific functions and biomarkers. Unfortunately, many studies fail to assess the purity of isolated exosome populations before performing functional assays or downstream omics approaches.
The current gold standard for exosome isolation is differential UC, which, in its classical form, consists of multiple centrifugation steps with increasing centrifugal strength to sequentially pellet cells (300 g), microvesicles (10,000 g) and exosomes (100,000 g) (Citation4). Many variations to these speeds are implemented in practice. Alternatively, serial filtration through 0.45 and 0.2 µm filters is used before exosome pelleting (Citation4). Density gradient–based isolation, using sucrose or iodixanol (OptiPrep™), can be applied to obtain more pure exosome preparations. Recent reports encourage the use of iodixanol-based gradients for improved separation of exosomes from viruses and small apoptotic bodies (Citation5). Also, unlike sucrose, iodixanol is capable of forming iso-osmotic solutions at all densities, thus better preserving the size of the vesicles in the gradient (Citation6). Therefore, in this study iodixanol was chosen as gradient component instead of the more conventionally used sucrose. In addition to these traditional isolation techniques, easy-to-use precipitation solutions, such as ExoQuick™ and Total Exosome Isolation™ (TEI), have been commercialized in the last few years with no need for expensive equipment or technical know-how. Although their mode-of-action has not been disclosed or validated, these kits are commonly used.
In this study, we evaluate the impact of 4 isolation methods (single-step and density-gradient UC-based protocols, and two commercially available precipitation solution–based protocols) on yield, purity, size, morphology and proteome and transcriptome content. We implement conditioned medium (CM) of a breast cancer cell culture model that stably expresses Rab27B, a small GTPase that recruits MVEs towards the plasma membrane and thus drives exosome release in the extracellular environment (Citation7, Citation8). We demonstrate that the choice of isolation method severely impacts the purity and accordingly the omics profiles of exosome populations. OptiPrep™ density gradient UC outperforms the other 3 methods and reveals a unique mRNA profile enriched for translation, ribosome, mitochondrion and nuclear lumen function.
Materials and methods
Cell culture
The oestrogen receptor-positive human breast cancer cell line MCF-7 (ATCC, Manassas, VA) was stably transfected with either an empty peGFP-c1 vector (Clontech, Mountain View, CA) (MCF-7 GFP) or the same vector containing a GFP-Rab27B fusion construct (MCF-7 Rab27B), as described previously (Citation9). The cell line was maintained in Dulbecco's minimal essential medium supplemented with 10% foetal bovine serum, 100 U/mL penicillin, 100 µg/mL streptomycin and 1 mg/mL G418 (i.e. culture medium) and incubated at 37°C in 10% CO2 (Invitrogen, Carlsbad, CA). Cell cultures were regularly tested and found negative for mycoplasma contamination using the MycoAlert Mycoplasma Detection Kit (Lonza, Verviers, Belgium) (Citation10).
Antibodies and reagents
The following primary and secondary antibodies were used for immunostaining: rabbit polyclonal anti-Ago2 (1:1,000) (ab32381, Abcam, Cambridge, UK), mouse monoclonal anti-Alix (1:1,000) (2171, Cell Signaling, Danvers, MA, USA), rabbit polyclonal anti-calreticulin (1:1,000) (2891, Cell Signaling), mouse monoclonal anti-CD63 clone MEM-259 (1:200) (ab8219, Abcam), mouse monoclonal anti-GM130 (1:500) (610822, Becton Dickinson, Franklin Lakes, NJ, USA), rabbit polyclonal anti-HSP70 (1:1,000) (EXOAB-HSP70A-1, System Biosciences, Mountain View, CA, USA), rabbit polyclonal anti-HSP90α (1:500) (PA3-012, Thermo Scientific, Erembodegem, Belgium), mouse monoclonal anti-PARP (poly ADP ribose polymerase) clone 4C10-5 (1:1,000) (556494, Becton Dickinson), rabbit polyclonal anti-PMP70 (1:2,000) (P0497, Sigma, Diegem, Belgium), rabbit monoclonal anti-prohibitin (1:1,000) (NBP7-40505, Novus Biologicals, Cambridge, UK), mouse monoclonal anti-TSG101 (1:1,000) (sc-7964, Santa Cruz, Santa Cruz, CA, USA) and mouse monoclonal anti-α-tubulin (1:4,000) (T5168, Sigma). Secondary antibodies coupled to horseradish peroxidase were obtained from Amersham Pharmacia Biotech (Diegem, Belgium). Immunoelectron microscopy was performed with a primary mouse monoclonal anti-CD63 antibody (clone H5C6) (557305, Becton Dickinson) and a rabbit anti-mouse IgG (Zymed Laboratories, San Francisco, CA, USA). OptiPrep™ was purchased from Axis-Shield PoC (Oslo, Norway). Total Exosome Isolation™ and ExoQuick-TC™ were purchased from Invitrogen and System Biosciences respectively. TNFα was obtained from R&D Systems (Minneapolis, MN, USA).
Preparation of CM
CM was prepared from 3×10⁸ cells grown at 70% confluency in T175 cell culture flasks. Cell cultures were washed 3 times using DMEM followed by 24 hours incubation with 15 mL exosome-harvesting medium at 37°C and 10% CO2. Exosome-harvesting medium is DMEM supplemented with 0.5% exosome-depleted foetal bovine serum (EDS). EDS was obtained through 18 hours centrifugation of foetal bovine serum at 100,000 g and subsequent filtering through a 0.2-µm filter (Whatman, Dassel, Germany). Residual EV contamination was negligible since no protein or particles could be retrieved from the exosomal gradient fractions after ODG centrifugation of 150-fold concentrated 0.5% EDS medium (data not shown). CM was harvested and centrifuged for 10 minutes at 200 g and 4°C to remove detached cells, followed by a 0.45 µm cellulose acetate filtration (Corning, New York, USA) to remove larger particles. Next, CM was concentrated approximately 200 times using a Centricon® Plus-70 centrifugal filter device with a 10 K nominal molecular weight limit (Millipore, MA, USA). The resulting 4 mL concentrated CM (CCM) was filtered through a 0.2 µm cellulose acetate filter (Whatman) and 1 mL was used for each exosome isolation method. Following collection of the medium, cell cultures were trypsinized and cell viability was measured on a Countess Automatic Cell Counter (Invitrogen) using a 0.1% trypan blue exclusion test. In addition, absence of apoptotic cells was evaluated through analysis of PARP cleavage (Supplementary Fig. 1).
Ultracentrifugation
One millilitre of CCM was diluted to 5 mL in phosphate buffered saline (PBS) (Invitrogen), transferred to a 5.2 mL open top polyallomer centrifuge tube (Beckman Coulter, Fullerton, CA) and centrifuged for 3 hours at 100,000 g and 4°C in a swinging bucket centrifuge (Optima XPN-80, SW 55 Ti rotor, Beckman Coulter). The pellet was resuspended in 50 µL of PBS and stored at −80°C. Note: (a) in this protocol the 10,000 g. Hence it has no meaning anymore in this section. Centrifugation step was omitted due to the prior use of 0.45 and 0.2 µm filters to obtain the CCM, and (b) no extra washing step was carried out in regard to recently published observations (Citation11).
OptiPrep™ density gradient centrifugation
A discontinuous iodixanol gradient was used as described by (Citation12) with some modifications. Solutions of 5, 10, 20 and 40% iodixanol were made by mixing appropriate amounts of a homogenization buffer [0.25 M sucrose, 1 mM EDTA, 10 mM Tris-HCL, (pH 7.4)] and an iodixanol working solution. This working solution was prepared by combining a working solution buffer [0.25 M sucrose, 6 mM EDTA, 60 mM Tris-HCl, (pH 7.4)] and a stock solution of OptiPrep™ (60% (w/v) aqueous iodixanol solution). The gradient was formed by layering 4 mL of 40%, 4 mL of 20%, 4 mL of 10% and 3.5 mL of 5% solutions on top of each other in a 16.8 mL open top polyallomer tube (Beckman Coulter). One millilitre CCM sample was overlaid onto the top of the gradient which was then centrifuged for 18 hours at 100,000 g and 4°C (SW 32.1 Ti rotor, Beckman Coulter). Gradient fractions of 1 mL were collected from the top of the gradient, diluted to 16 mL in PBS and centrifuged for 3 hours at 100,000 g and 4°C. The resulting pellets were resuspended in 100 µL PBS and stored at −80°C. To estimate the density of each fraction, a standard curve was made of the absorbance values at 340 nm of 1:1 aqueous dilutions of 5, 10, 20 and 40% iodixanol solutions. This standard curve was used to determine the density of fractions collected from a control gradient overlaid with 1 mL of PBS.
ExoQuick-TC™ precipitation
ExoQuick-TC™ was used according to manufacturer's instructions (System Biosciences). Briefly, 1 mL of CCM was diluted to 5 mL in PBS and mixed with 1 mL of ExoQuick-TC™ solution by inverting the tube. The sample was incubated overnight at 4°C after which it was spun down twice at 1,500 g for 30 and 5 minutes, respectively. The supernatant was discarded and the pellet was resuspended in 50 µL of PBS and stored at −80°C.
TEI precipitation
TEI was used according to manufacturer's instructions (Invitrogen). Briefly, 1 mL of CCM was diluted to 5 mL in PBS and mixed with 2.5 mL of TEI solution by repeated pipetting. The sample was incubated overnight at 4°C and spun down for 1 hour at 10,000 g and 4°C. The supernatant was discarded and the pellet was resuspended in 100 µL of PBS and stored at −80°C.
Protein analysis
To measure protein concentration of isolated exosomes, 5 µL sample was mixed with 5 µL of Laemmli lysis buffer [0.125 M Tris–HCl (pH 6.8), 10% glycerol, 2.3% sodium dodecyl sulphate (SDS)]. Protein concentration was determined using the Bio-Rad DC Protein Assay (Bio-Rad, Hercules, USA). For analysis, 10 µg of protein was suspended in reducing sample buffer [1 M Tris–HCl (pH 6.8), 30% glycerol, 6% SDS, 3% 2-mercaptoethanol, 0.005% bromophenol blue] or non-reducing sample buffer (without 2-mercaptoethanol) and boiled for 5 minutes at 95°C. Proteins were separated by SDS-PAGE (SDS-polyacrylamide gel electrophoresis) and transferred to polyvinylidene fluoride membranes, blocked in 5% non-fat milk in PBS with 0.5% Tween-20, and immunostained. Alternatively, separated proteins were stained with 0.5% Coomassie Brilliant Blue (Bio-Rad) in 40% methanol and 10% acetic acid for 90 minutes and destained in a solution composed of 40% methanol and 10% acetic acid.
Immunoelectron microscopy
Isolated exosomes were deposited on Formvar carbon-coated, glow-discharged grids. After 20 minutes, the grids were incubated in a blocking serum containing 1% BSA in PBS. Antibodies and gold conjugates were diluted in 1% BSA in PBS. The grids were exposed to the primary anti-CD63 antibody for 20 minutes, followed by secondary antibody to rabbit anti-mouse IgG (Zymed, San Francisco, CA, USA) for 20 minutes and protein A-gold complex [10 nm size (Citation13)] (CMC Utrecht, The Netherlands) for 20 minutes. The efficiency of blocking was controlled by performing the labelling procedure in the absence of the primary antibody. The grids were stained with neutral uranylacetate and embedded in methylcellulose/uranyl acetate and examined in a Tecnai Spirit transmission electron microscope (FEI, Eindhoven, The Netherlands). Images were captured by Quemesa charge-coupled device camera (Olympus Soft Imaging Solutions GMBH, Munster, Germany).
Nanoparticle tracking analysis
Nanoparticle tracking analysis (NTA) was performed using a NanoSight LM10-HS microscope (NanoSight Ltd., Amesbury, UK) equipped with a 405 nm laser and an automatic syringe pump system. Three 60-second videos were recorded of each sample with camera level and detection threshold set at 10. Temperature was monitored throughout the measurements. Videos recorded for each sample were analysed with NTA software version 2.3 to determine the concentration and size of measured particles with corresponding standard error. For analysis, auto settings were used for blur, minimum track length and minimum expected particle size. The NanoSight system was calibrated with polystyrene latex microbeads of 50, 100, and 200 nm (Thermo Scientific, Fremont, USA) prior to analysis. PBS was used to dilute the starting material.
RNA analysis
Total RNA was isolated from exosome samples using the miRNeasy Micro kit according to manufacturer's instructions (Qiagen, Valencia, CA, USA). RNA concentration was measured using a UV-Vis spectrophotometer (Nanodrop Technologies, Wilmington, DE, USA). The Experion electrophoresis system using the standard RNA chips (Bio-Rad) was used to assess RNA quality and create electropherograms. Whole genome mRNA expression profiling was performed using a custom gene expression microarray (Agilent Technologies, Amstelveen, The Netherlands). In brief, 10 ng of total RNA was labelled using the Low Input Quick Amp labelling kit (Agilent) according to the manufacturer's instructions. Cy-3-labelled cRNA was hybridized and probe intensities were analysed using an Agilent microarray scanner and Feature Extraction software. Probe intensities were background subtracted and normalized using Quantile normalization. For downstream data analysis, only probes with a normalized signal at least 2-fold above that of the negative control probe (DarkCorner) were labelled as expressed. Probes were included if expressed in all 3 replicates of 1 method. For gene-level analysis, the probe with the highest mean expression value for that gene across all samples was used. Validation of differentially expressed genes was performed via quantitative real-time polymerase chain reaction (PCR) (RT-qPCR) using PrimePCR™ assays (Bio-Rad). The 10.0-µL PCR reaction mix contained PrimePCR Assay (0.5 µL), SsoAdvanced SYBR Green Supermix (5.0 µL), cDNA (1 µL corresponding to the cDNA reverse transcribed from approximately 10 ng RNA), and nuclease-free water (4.5 µL). The 384-well plate was then run on the CFX 384 (Bio-Rad) at 95°C for 30 seconds, then 95°C for 5 seconds and 60°C for 15 seconds (for 45 cycles). PrimePCR assays that were used for qPCR are listed in Supplementary Table 1. Data were processed and normalized using qbase+2.6 software (www.biogazelle.com). Assays with too low an expression level (i.e. missing values in multiple samples) were excluded. Three reference genes (CYB5A, RCL1 and SYNGR2) were selected based on geNorm analysis including 6 candidate genes with low standard deviation across all samples in the microarray experiment.
Gene set enrichment analysis was performed on mRNA lists, ranked according to mean fold change between methods using Gene Ontology biological process and KEGG pathways as gene set collections (Citation14). Alternatively, functional annotation of enriched genes was determined using the DAVID bioinformatics database (Citation15). Hierarchical clustering was performed using Manhattan distance and Ward clustering.
LC-MS/MS
Exosome samples were suspended in reducing sample buffer (Novex® Tris-Glycine sample buffer, Invitrogen) and boiled for 2 minutes at 85°C. Samples were run on Novex® 4–20% Tris-Glycine gradient gels (Invitrogen) in denaturing SDS buffer, stained with 0.5% Coomassie Brilliant Blue (Bio-Rad) in 40% methanol and 10% acetic acid for 20 minutes, and destained in a solution composed of 40% methanol and 10% acetic acid. Gel bands were processed and analysed by liquid chromatography–mass spectrometry/mass spectrometry (LC-MS/MS) as previously described (Citation16). Raw MS/MS files were submitted to the NIH MASCOT Cluster (Citation17) using MASCOT DAEMON version 2.2. Data were searched against the UNIPROT-SPROT database, updated on 20/05/08 as described (Citation16). For each peptide identification, MASCOT reports a probability-based ion score, which is defined as −10×log10(P), where P is the absolute probability that the observed match between the experimental data and the database sequence is a random event. The significance threshold for inclusion of each peptide in the output file is the individual ion score meeting or exceeding its MASCOT identity score threshold (p<0.05). Peptides with ion scores below their identity scores were rejected. MASS SIEVE was used to calculate percentage coverage for each protein identification (http://www.ncbi.nlm.nih.gov/staff/slottad/MassSieve). Peptide identifications from 1 representative experiment are shown.
Results
Exosome markers are most enriched in ODG exosome preparations
Exosomes were prepared from pre-purified CM derived from non-apoptotic Rab27B-expressing MCF-7 cells using 4 methods: UC, OptiPrep™ density gradient ultracentrifugation (ODG), ExoQuick™ solution (EQ) and TEI solution (TEI) (). In all experiments, cell viability was 95%, which is in accordance with the generally accepted percentage to avoid potential contribution of apoptotic bodies to the exosome preparations (Supplementary Fig. 1) (Citation18, Citation19). Since fractions 8 and 9 obtained from the ODG method, corresponding to a buoyant density of ~1.094 g/mL, were characterized by a high number of particles as measured by NTA and high CD63 expression as assessed by Western blot, a pool of both fractions was used (Supplementary Fig. 2). This density is comparable to earlier publications on exosomes isolated from cancer cells using an OptiPrep™ gradient (Citation20–Citation24). Western blot analysis demonstrated elevated levels of exosomal marker proteins (Alix, HSP90α, HSP70, TSG101 and CD63) in lysates from the centrifugation-based (UC and ODG) compared to the precipitation solution-based methods (EQ and TEI) (a). Of note, increased protein concentrations were required to identify CD63 in lysates from EQ and TEI (b, lower panel). All exosome preparations were clear from contaminating cell organelles as indicated by the absence of markers of peroxisomes (PMP70), mitochondria (prohibitin), Golgi apparatus (GM130) or endoplasmic reticulum and apoptotic bodies (calreticulin) as opposed to total lysate of MCF-7 Rab27B cells (b).
Fig. 1 Schematic overview of 4 methods to isolate exosomes from conditioned medium (CM). Approximately 3×10⁸ MCF-7 Rab27B cells were grown for 24 hours in DMEM containing 0.5% exosome-depleted serum. The CM was harvested, centrifuged, filtrated and concentrated. The concentrated conditioned medium (CCM) was equally divided over 4 isolation methods: ultracentrifugation (UC), OptiPrep™ density gradient centrifugation (ODG), ExoQuick-TC™ precipitation (EQ) and Total Exosome Isolation™ precipitation (TEI).
Fig. 2 Characterization of exosome preparations by Western blot. Western blot analysis of (a) common exosome markers (Alix, HSP90α, HSP70, TSG101 and CD63) and (b) cell organelle and apoptosis markers (GM130, PMP70, calreticulin and prohibitin) in 10 µg of exosomes isolated by 4 different methods. MCF-7 Rab27B total cell lysate (TCL) was loaded as positive control. Asterisks indicate loading of 50 µg of protein.
Exosome preparations display morphological and quantitative differences
Exosome preparations obtained by UC, ODG, EQ and TEI were loaded onto carbon-coated grids and analysed by immunoelectron microscopy with an anti-CD63 antibody recognizing an epitope either in the small or large extracellular loop (EC1 or EC2) (Citation25) (a and Supplementary Fig. 3). Samples isolated using ODG were characterized by a typically heterogeneous exosomal population consisting of abundant CD63-positive and a few CD63-negative exosomes with a size range between 35 and 100 nm in diameter. The other 3 methods resulted in the isolation of sparsely dispersed CD63-positive exosomes, larger and smaller vesicles clumped together, and background contaminants.
Fig. 3 Morphological characterization and quantification of exosome preparations by immunoelectron microscopy and Nanoparticle Tracking Analysis. (a) Electron micrographs of exosomes stained with 10 nm gold-conjugated anti-CD63 antibody followed by uranyl acetate counterstaining. Scale bar: 100 nm. (b) Exosome samples were analysed using Nanoparticle Tracking Analysis. The calculated size distribution is depicted as a mean (black line) with standard error (red shaded area). Total particle number, mean particle size and modus are shown for each preparation.
Next, NTA revealed the sharpest size distribution curves for UC and ODG, with 10% more particles outside the 50–150 nm range in EQ and TEI, indicating more homogeneous preparations in the two former methods (b). Mean particle sizes (~160 nm) were higher than those measured by TEM. As previously reported, this difference can be explained by the fact that NTA measures the hydrodynamic diameter of particles and is inherently biased towards larger particles (Citation26, Citation27). ODG isolated approximately 2-fold less particles compared to UC and TEI, and 5-fold less compared to EQ (b). Combined with the protein marker analysis and immunoelectron microscopy data, this indicates co-isolation of non-exosomal particles by EQ, TEI and UC.
Isolation methods affect protein yield and profile
Protein yield, expressed as relative protein amount per 108 particles, was 2-fold less in exosome preparations from ODG compared to UC. By contrast, EQ and TEI contained respectively 3 and 8 times more protein per 108 particles than UC. Per 106 cells, ODG and UC protocols typically harvested respectively 0.3 and 0.7 µg protein, compared to an excessive amount of ~5 µg by precipitation techniques. Coomassie brilliant blue staining of proteins, separated under reducing conditions by SDS-PAGE, revealed a distinct protein profile with multiple unique protein bands for ODG (b). LC-MS/MS. Analysis of 2 selected bands in EQ identified contaminating serum proteins albumin and apolipoprotein E, while these could not be detected in ODG samples (c). The characteristic 69 kDa albumin band was also present in UC and TEI. By contrast, Coomassie brilliant blue staining of top-to-bottom fractions from ODG identifies albumin mainly in top fractions 1 to 3 (Supplementary Fig. 4).
Fig. 4 Analysis of the protein content of exosome preparations. (a) Relative level of protein per 108 particles in each preparation. Error bars indicate relative standard error of two experiments. (b) Coomassie blue staining of 20 µg of MCF-7 Rab27B total cell lysate (TCL) or exosome samples separated by SDS-PAGE. (c) Number of unique peptides and corresponding percentage coverage for indicated proteins identified in MS analysis of an EQ exosome sample.
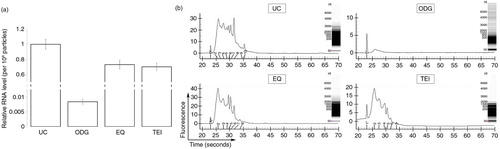
ODG exosome preparations are characterized by a unique mRNA profile
Compared to UC, the relative amount of RNA per 108 particles was almost 1.5-fold lower for EQ and TEI and 100-fold lower for ODG (). Per 106 cells, the RNA yield was typically 0.7 ng for ODG, while being considerably higher for UC (40 ng), EQ (75 ng) and TEI (50 ng). Experion analysis for RNA yield and size of 3 replicates for each method (2 technical and 1 biological) showed no signs of ribosomal 18S and 28S peaks, indicating that the RNA present was not derived from cells or debris (b). RNA of 100–1,500 nucleotides (nt) was enriched in UC, EQ and TEI, whereas the ODG sample contained a small RNA population (less than 500 nt) with a lower yield (b).
Fig. 5 Identification of the RNA content in exosome preparations. (a) Relative level of RNA per 108 particles in each preparation. Error bars indicate relative standard error of two experiments. (b) Representative electropherograms of exosome samples generated using the Experion system. Insets show RNA band pattern.
To examine the variations in RNA content due to technical, biological and methodological effects, we performed gene expression microarray profiling. Expression correlation analysis revealed that the overall reproducibility within UC, ODG and EQ was high with Spearman rho-values between 0.78 and 0.97 (Supplementary Fig. 5a and b). For TEI, the technical reproducibility was observed to be poor which led us to exclude this technique in further analyses (Supplementary Fig. 6). When comparing the variations among the different methods, we found striking differences between UC, ODG and EQ with Spearman rho-values down to 0.40 (Supplementary Fig. 5b).
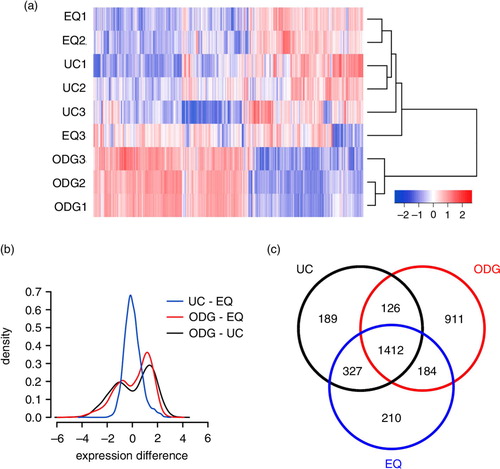
To further evaluate technical, biological and methodological variations, we performed an unsupervised hierarchical clustering using mRNAs detected in all replicates of at least 1 of 3 methods (UC, ODG, EQ) (a). The heatmap showed 1) technical and biological reproducibility for UC, ODG and EQ, and 2) a clear differential clustering of ODG in 1 group, and UC and EQ in a second group. When evaluating mRNA expression differences between methods, UC–EQ showed a Gaussian distribution with a negligible mean expression difference of 0.020 [95% confidence interval: 0.001 to 0.034] whereas ODG–UC and ODG–EQ showed a bimodal distribution revealing a fraction of genes with higher and lower abundance in ODG versus UC and EQ (b). Looking at the total number of mRNAs detected over all methods, about 40% was shared between all of them. Almost 30% of the mRNAs were exclusive to ODG samples, while UC and EQ had only around 6% unique mRNAs. UC and EQ had a mutual overlap of over 80%, while ODG shared only about 65% of its detected mRNAs with the other methods (c).
Fig. 6 Agilent microarray-based RNA profiling of exosome samples. (a) Heatmap showing unsupervised hierarchical clustering of samples. Code from blue (−2 log2 normalized expression) to red (+2 log2 normalized expression) indicates RNA expression levels. NB: Replicates 1 and 2 are technical, 3 is biological. (b) Plot showing mean expression difference and corresponding density of probes for the 3 different methods. (c) Venn diagram of unique and shared mRNAs in UC, ODG and EQ samples.
ODG samples are enriched in mRNA related to translation, ribosome and mitochondrion functions
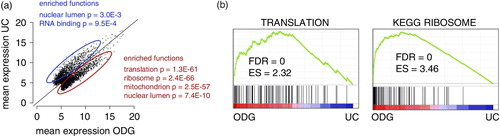
To better understand the biological significance of our data, we performed a pathway enrichment analysis and Gene Set Enrichment Analysis (a and b). When running DAVID analysis on genes overrepresented in ODG versus UC, functions related to translation, ribosome, mitochondrion and nuclear lumen were very significantly enriched (a). These findings were further validated by means of a GSEA analysis identifying gene sets related to translation and ribosome as significantly enriched in ODG compared to UC (b). Similar results were obtained when comparing ODG versus EQ, while no enrichment analysis was performed on UC and EQ because of their strong correlation (data not shown and Supplementary Fig. 7a and b).
Fig. 7 Identification of enriched genes in exosome RNA samples. (a) Scatter plot showing mean RNA expression in UC versus ODG samples and indicating enriched GO terms according to DAVID analysis. (b) Gene Set Enrichment Analysis of UC versus ODG.
RT-qPCR validates microarray data for 10 selected genes
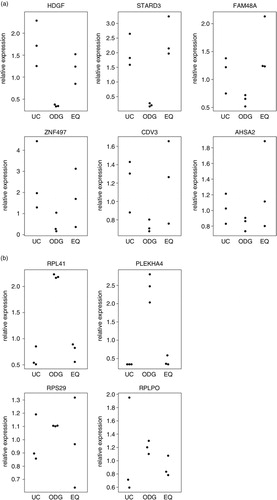
RT-qPCR for the 6 most enriched genes in UC and EQ and the 4 most enriched genes in ODG validated the microarray generated data (a and b): (a) technical and biological reproducibility was the highest for ODG, and (b) relative expression levels as measured by RT-qPCR followed those as analysed by microarray for ODG, UC and EQ. This again showed the consistency of ODG which has a similar expression of each investigated RNA as opposed to UC and EQ where considerably more variation occurs between replicates.
Fig. 8 RT-qPCR validation of mRNA expression. Normalized expression level of 6 genes with the lowest expression (a), and 4 genes with the highest expression (b) in ODG compared to UC and EQ according to the performed microarray. Plotted values represent 3 replicates for each method.
RNA-binding proteins are confounding contaminants of exosome preparations
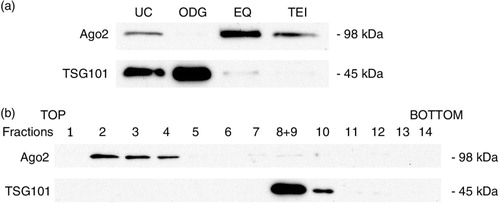
Based on the RNA data, we hypothesized that all methods except ODG co-isolate RNA of non-exosomal origin, possibly stabilized in protein complexes. We analysed the presence of Argonaute-2 (Ago2) protein, a member of the RNA-induced silencing complex and a well-characterized extracellular RNA-binding protein (Citation28, Citation29), in all exosome preparations by Western blot analysis (a). Ago2 was detected in UC, EQ and TEI, while it was absent in ODG. Furthermore, the presence of Ago2 was inversely correlated with the presence of exosome marker TSG101 (a). This was further confirmed on EQ and ODG exosome preparations from a control MCF-7 cell line not manipulated for increased exosome release (Supplementary Fig. 8). Western blot analysis on top-to-bottom fractions from ODG identified Ago2 in the non-exosomal upper fractions 2, 3 and 4 (b).
Fig. 9 Ago2 protein expression analysis. (a) Western blot results for Ago2 and TSG101 expression in each exosome preparation. (b) Individual fractions of an OptiPrep™ gradient were lysed, separated by SDS-PAGE, and tested for the presence of Ago2 and TSG101 by Western blot.
Discussion
To accurately define the exosome-specific proteome, transcriptome, glycome and lipidome, and thus understand the functional significance of intercellular exosomal communication, there is a growing need for standardized and validated isolation methods to obtain pure exosomes. This is a main topic of interest for exosome researchers worldwide, as illustrated by recent position papers by the International Society for Extracellular Vesicles (Citation19, Citation30). Although previous studies comparing exosome isolation methods were published, these mainly focused on the proteome of isolated preparations, and never included increasingly used precipitation solutions (Citation12, Citation31). Here, for the first time, we assessed the impact of isolation method, including precipitation methods, on (m)RNA. We evaluated 4 commonly used methods for yield, size, morphology, and protein and RNA content of exosome preparations. Pros and cons of the different methods are listed in . We found that all methods were able to isolate exosomes, as illustrated by Western blot analysis and immunoelectron microscopy for exosome markers. However, we demonstrated using complementary techniques that ODG obtains the purest exosome preparations for downstream omics profiling. Multiple observations indicate that UC, EQ and TEI do not selectively enrich for exosomes but also co-isolate contaminating factors.
Table I Characteristics of exosome isolation methods
CD63-immuno-TEM showed clean exosome preparations for UC and ODG, whereas background contaminants were clearly visible in EQ and TEI images. Smaller, 30–40 nm-sized CD63-positive vesicles could be seen in UC and ODG, but were absent in EQ and TEI (Supplementary Fig. 3). These observations point out that precipitation solution–based techniques do not succeed in extracting all exosomal particles from CM, while they do co-precipitate non-exosomal impurities.
Western blot analysis showed that UC and particularly ODG preparations were more enriched in exosomal marker proteins, despite harvesting considerably less protein than EQ and TEI. Accordingly, higher overall protein yield by precipitation techniques is not an indication of higher exosome yields, but a consequence of contaminating non-exosomal proteins. Thus, although the absence of cell organelle markers is useful to exclude cell lysis and apoptosis, these markers are insufficient to rule out contaminating factors such as soluble proteins, protein aggregates, chylomicrons and other vesicles. In our study, 0.5% EDS medium was used to avoid induction of apoptosis, cellular stress, and subsequent changes in exosome content. Therefore, besides the cell's own non-exosomal secretome, a potential source for these contaminants is residual bovine serum, as it has been reported that 5–10% of secretome proteins and nanovesicles possibly originates from serum (Citation32).
Coomassie blue staining of the overall protein content from EQ and TEI preparations showed a distinct pattern compared to UC and especially ODG, supporting the differences in protein isolation. Furthermore, it revealed that ODG is the only technique capable of minimizing serum albumin contamination. MS-assisted proteome analysis revealed the presence of serum albumin and apolipoprotein E as contaminants in the EQ preparation. The presence of soluble proteins and protein complexes and aggregates in exosome preparations should therefore be verified using markers such as albumin and apolipoproteins. Coomassie blue staining of all ODG fractions shows an efficient removal of serum albumin in the top fractions of the gradient (Supplementary Fig. 4). This observation is consistent with a recent study on plasma exosomes describing OptiPrep™ gradient centrifugation as the only technique capable of eliminating contaminating plasma proteins (Citation31). Non-vesicular proteins, predominantly high molecular weight proteins and protein aggregates, co-sedimenting with exosomes in UC have been reported previously as well (Citation12). This contamination increases with prolonged centrifugation time, predominantly when centrifuging longer than 4 hours (Citation33). As mentioned earlier, different protocols of differential UC have been used to date, and we cannot exclude that alternative centrifugation steps, including a 10,000 g spin and washing steps of the exosome pellet, could help reducing contamination of the exosome pellet.
NTA-mediated quantification of isolated particle numbers revealed that UC, EQ and TEI isolated 2- to 5-fold more particles than ODG. Since ODG contained more CD63-positive exosomes and was most enriched in exosomal marker proteins, as exemplified by IEM and Western blotting, respectively, these particles are of non-exosomal origin. However, no differences in mean size were detected between preparations. This indicates that sizing via NTA alone is not sufficient to rule out contamination of exosome preparations with particles with a similar hydrodynamic diameter such as chylomicrons or protein complexes.
Microarray-based comparison of extracted RNA revealed a distinct mRNA profile of ODG compared to UC and EQ exosome preparations. It has been shown that the choice of isolation technique can cause substantial differences in isolated proteome (Citation12) and according to our data the impact on transcriptome is even more profound. Unfortunately, ODG is implemented by a very limited number of groups in the exosome research field, and only once has it been used for transcriptomics (Citation12, Citation20–Citation24, Citation31, Citation34–Citation40). Extracellular RNA shows remarkable stability in an RNase rich environment, most likely by encapsulation in membrane-bound vesicles such as exosomes or by binding to protein complexes such as the ribonucleoprotein Ago2. Although the presence of limited amounts of Ago2 in exosomes has been reported (Citation41), the enrichment of Ago2 in all exosome preparations except ODG suggests a potential contamination by protein/RNA complexes. The fact that EQ precipitates Ago2 complexes while ODG does not was confirmed on a cell line showing basal secretion of exosomes (Supplementary Fig. 8). While it does have an mRNA-binding pocket, until now Ago2 is only known to form an extracellular complex with miRNAs (Citation29, Citation42). Therefore, it remains unclear whether it could contribute to the discrepancy in mRNA profiles between exosome samples and this should be investigated in the future. Nonetheless, the observation that an RNA binding protein is predominantly found in UC, EQ and TEI samples is another indication for contamination of these preparations with non-exosomal complexes of protein and/or RNA, thus hampering detection of exosomal RNA of interest. In agreement, the purest exosome preparation contains 100-fold less total RNA compared to UC and EQ exosome pellets. Collection of different gradient fractions showed that Ago2 and RNA with a size ranging from 100 to 500 nt are predominantly present in the upper fractions (Supplementary Fig. 9), corresponding to less dense, soluble protein/RNA complexes. Our data indicate that Ago2 could be a promising candidate marker to evaluate contamination of exosome preparations.
Choice of isolation method had a profound impact on the identification of enriched pathways and gene sets in the samples. The enrichment of mRNAs with ribosomal, nuclear and mitochondrial functions in the purest exosome fractions (ODG) from breast cancer cells comes as no surprise since cancer cells show an increased cellular metabolism and proliferation, necessitating an abundance of mRNAs sustaining the metabolic needs for proliferation. Enrichment of mRNA related to ribosomes and mitochondria in exosomes has been indicated in previous studies (Citation43–Citation45). Whether exosomes should be considered as cellular waste containers acting to discard high abundant molecular components is a point of intensive research. Our data underpin the possible role of exosomes as powerful biomarkers.
A proper isolation method is crucial to unravel exosome-specific functions and biomarkers. We have shown that 1) ODG outperforms the commonly implemented methods UC, EQ and TEI in terms of purity and consequently also exosome-specific protein and RNA yield; and 2) the choice of isolation method severely impacts downstream RNA profiling. In this study, we have not compared the performance of sucrose-based density gradients versus OptiPrep™, although we would expect it to be similar because both have the same mode of action. To what extent specific pre-processing and centrifugation steps, such as concentrating the medium, applying pressure-driven filtration or performing a 10,000 g spin, could influence the performance of different techniques is beyond the present study but should be investigated in the future.
We strongly recommend considering and validating isolation methods of choice to avoid confounding results regarding exosome-specific content, functions and biomarkers. Since ODG is the most labour-intensive method (see ), we propose a workflow where newly identified functions and biomarkers are at least validated on exosome preparations obtained by density gradient UC. Finally, we encourage researchers to adequately address the quality of exosome preparations and to report experimental details in a transparent manner that permits replication with the aim to increase the availability of consistent and biologically relevant data.
Conflict of interest and funding
The authors declare that they have no conflict of interests. This study was supported by Fund for Scientific Spearheads and Oncological Research Program of the Ghent University Hospital, Concerted Research Actions from Ghent University, Emmanuel van der Schueren (JVD) from Vlaamse Liga tegen Kanker, a postdoctoral grant and Krediet aan Navorsers (AH) from Fund for Scientific Research-Flanders.
Supplementary Figures
Download PDF (2.2 MB)Acknowledgements
The authors thank the staff of the Electron Microscopy Laboratory (Biocenter Oulu, University of Oulu, Finland) and Katrien Vanderheyden of the Center for Medical Genetics (Ghent University Hospital) for excellent technical assistance. We also thank Wojciech Witkowski from the Retrovirology Lab (Ghent University Hospital) for advice on gradient methodology.
Notes
To access the supplementary material to this article, please see Supplementary files under Article Tools online.
Related Research Data
References
- Hendrix A, De Wever O. Rab27 GTPases distribute extracellular nanomaps for invasive growth and metastasis: implications for prognosis and treatment. Int J Mol Sci. 2013; 14: 9883–92.
- Simons M, Raposo G. Exosomes – vesicular carriers for intercellular communication. Curr Opin Cell Biol. 2009; 21: 575–81.
- Valadi H, Ekstrom K, Bossios A, Sjostrand M, Lee JJ, Lotvall JO. Exosome-mediated transfer of mRNAs and microRNAs is a novel mechanism of genetic exchange between cells. Nat Cell Biol. 2007; 9: 654–9.
- Thery C, Amigorena S, Raposo G, Clayton A. Isolation and characterization of exosomes from cell culture supernatants and biological fluids. Curr Protoc Cell Biol. 2006 22. Chapter 3:Unit 3.
- Cantin R, Diou J, Belanger D, Tremblay AM, Gilbert C. Discrimination between exosomes and HIV-1: purification of both vesicles from cell-free supernatants. J Immunol Methods. 2008; 338: 21–30.
- Dettenhofer M, Yu XF. Highly purified human immunodeficiency virus type 1 reveals a virtual absence of Vif in virions. J Virol. 1999; 73: 1460–7.
- Ostrowski M, Carmo NB, Krumeich S, Fanget I, Raposo G, Savina A et al. Rab27a and Rab27b control different steps of the exosome secretion pathway. Nat Cell Biol. 2010; 12: 1–13. 19–30; sup.
- Hendrix A, Westbroek W, Bracke M, De Wever O. An ex(o)citing machinery for invasive tumor growth. Cancer Res. 2010; 70: 9533–7.
- Hendrix A, Maynard D, Pauwels P, Braems G, Denys H, Van den Broecke R et al. Effect of the secretory small GTPase Rab27B on breast cancer growth, invasion, and metastasis. J Natl Cancer Inst. 2010; 102: 866–80.
- Quah BJ, O'Neill HC. Mycoplasma contaminants present in exosome preparations induce polyclonal B cell responses. J Leukoc Biol. 2007; 82(5): 1070–82.
- Webber J, Clayton A. How pure are your vesicles?. J Extracell Vesicles. 2013; 2 19861, doi: http://dx.doi.org/10.3402/jev.v2i0.19861.
- Tauro BJ, Greening DW, Mathias RA, Ji H, Mathivanan S, Scott AM et al. Comparison of ultracentrifugation, density gradient separation, and immunoaffinity capture methods for isolating human colon cancer cell line LIM 1863-derived exosomes. Methods. 2012; 56: 293–304.
- Slot JW, Geuze HJ. A new method of preparing gold probes for multiple-labeling cytochemistry. Eur J Cell Biol. 1985; 38: 87–93.
- Subramanian A, Tamayo P, Mootha VK, Mukherjee S, Ebert BL, Gillette MA et al. Gene set enrichment analysis: a knowledge-based approach for interpreting genome-wide expression profiles. Proc Natl Acad Sci U S A. 2005; 102: 15545–50.
- Huang da W, Sherman BT, Lempicki RA. Systematic and integrative analysis of large gene lists using DAVID bioinformatics resources. Nat Protoc. 2009; 4: 44–57.
- Maynard DM, Heijnen HF, Horne MK, White JG, Gahl WA. Proteomic analysis of platelet alpha-granules using mass spectrometry. J Thromb Haemostasis. 2007; 5: 1945–55.
- Perkins DN, Pappin DJ, Creasy DM, Cottrell JS. Probability-based protein identification by searching sequence databases using mass spectrometry data. Electrophoresis. 1999; 20: 3551–67.
- Chaput N, Thery C. Exosomes: immune properties and potential clinical implementations. Semin Immunopathol. 2011; 33: 419–40.
- Witwer KW, Buzás EI, Bemis LT, Bora A, Lässer C, Lötvall J et al. Standardization of sample collection, isolation and analysis methods in extracellular vesicle research. J Extracell Vesicles. 2013; 2 20360, doi: http://dx.doi.org/10.3402/jev.v2i0.20360.
- Ji H, Greening DW, Barnes TW, Lim JW, Tauro BJ, Rai A et al. Proteome profiling of exosomes derived from human primary and metastatic colorectal cancer cells reveal differential expression of key metastatic factors and signal transduction components. Proteomics. 2013; 13: 1672–86.
- Tauro BJ, Mathias RA, Greening DW, Gopal SK, Ji H, Kapp EA et al. Oncogenic H-ras reprograms Madin-Darby canine kidney (MDCK) cell-derived exosomal proteins following epithelial-mesenchymal transition. Mol Cell Proteomics. 2013; 12: 2148–59.
- Choi DS, Choi DY, Hong BS, Jang SC, Kim DK, Lee J et al. Quantitative proteomics of extracellular vesicles derived from human primary and metastatic colorectal cancer cells. J Extracell Vesicles. 2012; 1 18704, doi: http://dx.doi.org/10.3402/jev.v1i0.18704.
- Park JO, Choi DY, Choi DS, Kim HJ, Kang JW, Jung JH et al. Identification and characterization of proteins isolated from microvesicles derived from human lung cancer pleural effusions. Proteomics. 2013; 13: 2125–34.
- Hong BS, Cho JH, Kim H, Choi EJ, Rho S, Kim J et al. Colorectal cancer cell-derived microvesicles are enriched in cell cycle-related mRNAs that promote proliferation of endothelial cells. BMC Genomics. 2009; 10: 556.
- Azorsa DO, Hyman JA, Hildreth JE. CD63/Pltgp40: a platelet activation antigen identical to the stage-specific, melanoma-associated antigen ME491. Blood. 1991; 78: 280–4.
- Sokolova V, Ludwig AK, Hornung S, Rotan O, Horn PA, Epple M et al. Characterisation of exosomes derived from human cells by nanoparticle tracking analysis and scanning electron microscopy. Colloids Surf B Biointerfaces. 2011; 87: 146–50.
- Gardiner C, Ferreira YJ, Dragovic RA, Redman CW, Sargent IL. Extracellular vesicle sizing and enumeration by nanoparticle tracking analysis. J Extracell Vesicles. 2013; 2 19671, doi: http://dx.doi.org/10.3402/jev.v2i0.19671.
- Turchinovich A, Weiz L, Langheinz A, Burwinkel B. Characterization of extracellular circulating microRNA. Nucleic Acids Res. 2011; 39: 7223–33.
- Arroyo JD, Chevillet JR, Kroh EM, Ruf IK, Pritchard CC, Gibson DF et al. Argonaute2 complexes carry a population of circulating microRNAs independent of vesicles in human plasma. Proc Natl Acad Sci U S A. 2011; 108: 5003–8.
- Hill AF, Pegtel DM, Lambertz U, Leonardi T, O'Driscoll L, Pluchino S et al. ISEV position paper: extracellular vesicle RNA analysis and bioinformatics. J Extracell Vesicles. 2013; 2 22859, doi: http://dx.doi.org/10.3402/jev.v2i0.22859.
- Kalra H, Adda CG, Liem M, Ang CS, Mechler A, Simpson RJ et al. Comparative proteomics evaluation of plasma exosome isolation techniques and assessment of the stability of exosomes in normal human blood plasma. Proteomics. 2013; 13: 3354–64.
- Villarreal L, Mendez O, Salvans C, Gregori J, Baselga J, Villanueva J. Unconventional secretion is a major contributor of cancer cell line secretomes. Mol Cell Proteomics. 2013; 12: 1046–60.
- Cvjetkovic A, Lotvall J, Lasser C. The influence of rotor type and centrifugation time on the yield and purity of extracellular vesicles. J Extracell Vesicles. 2014; 3 23111, doi: http://dx.doi.org/10.3402/jev.v3.23111.
- Choi DS, Park JO, Jang SC, Yoon YJ, Jung JW, Choi DY et al. Proteomic analysis of microvesicles derived from human colorectal cancer ascites. Proteomics. 2011; 11: 2745–51.
- Epple LM, Griffiths SG, Dechkovskaia AM, Dusto NL, White J, Ouellette RJ et al. Medulloblastoma exosome proteomics yield functional roles for extracellular vesicles. PLoS One. 2012; 7: e42064.
- Graner MW, Alzate O, Dechkovskaia AM, Keene JD, Sampson JH, Mitchell DA et al. Proteomic and immunologic analyses of brain tumor exosomes. FASEB Journal. 2009; 23: 1541–57.
- Kim HS, Choi DY, Yun SJ, Choi SM, Kang JW, Jung JW et al. Proteomic analysis of microvesicles derived from human mesenchymal stem cells. J Proteome Res. 2012; 11: 839–49.
- Mathivanan S, Lim JW, Tauro BJ, Ji H, Moritz RL, Simpson RJ. Proteomics analysis of A33 immunoaffinity-purified exosomes released from the human colon tumor cell line LIM1215 reveals a tissue-specific protein signature. Mol Cell Proteomics. 2010; 9: 197–208.
- Gangalum RK, Atanasov IC, Zhou ZH, Bhat SP. AlphaB-crystallin is found in detergent-resistant membrane microdomains and is secreted via exosomes from human retinal pigment epithelial cells. J Biol Chem. 2011; 286: 3261–9.
- Coleman BM, Hanssen E, Lawson VA, Hill AF. Prion-infected cells regulate the release of exosomes with distinct ultrastructural features. FASEB J. 2012; 26: 4160–73.
- Gibbings DJ, Ciaudo C, Erhardt M, Voinnet O. Multivesicular bodies associate with components of miRNA effector complexes and modulate miRNA activity. Nat Cell Bio. 2009; 11: 1143–9.
- Hutvagner G, Simard MJ. Argonaute proteins: key players in RNA silencing. Nat Rev Mol Cell Biol. 2008; 9: 22–32.
- Nolte-‘t Hoen EN, Buermans HP, Waasdorp M, Stoorvogel W, Wauben MH, t Hoen PA. Deep sequencing of RNA from immune cell-derived vesicles uncovers the selective incorporation of small non-coding RNA biotypes with potential regulatory functions. Nucleic Acids Res. 2012; 40: 9272–85.
- Genneback N, Hellman U, Malm L, Larsson G, Ronquist G, Waldenstrom A et al. Growth factor stimulation of cardiomyocytes induces changes in the transcriptional contents of secreted exosomes. J Extracell Vesicles. 2013; 2 20167, doi: http://dx.doi.org/10.3402/jev.v2i0.20167.
- Jenjaroenpun P, Kremenska Y, Nair VM, Kremenskoy M, Joseph B, Kurochkin IV. Characterization of RNA in exosomes secreted by human breast cancer cell lines using next-generation sequencing. Peer J. 2013; 1: e201.