
Abstract
Background
Microvesicles (MV) have been implicated in the development of thrombotic disease, such as acute respiratory distress syndrome (ARDS) and multiple organ failure (MOF). Trauma patients are at increased risk of late thrombotic events, particularly those who receive a major transfusion. The aims of this study were: (a) to determine whether there were increased numbers of pro-coagulant MV following injury; (b) to determine their cellular origin; and (c) to explore the effects of MV with clinical outcomes; in particular red cell transfusion requirements and death.
Methods
Trauma patients were recruited at a Level 1 trauma centre. The presence of MV procoagulant phospholipid (PPL) was assessed using 2 activity assays (PPL and thrombin generation). Enumeration and MV cellular origin was assessed using 2 colour flow cytometry.
Results
Fifty consecutive patients were recruited; median age 38 (IQR: 24–55), median ISS 18 (IQR: 9–27). Circulating procoagulant MV, rich in phospholipid, were significantly elevated following traumatic injury relative to controls and remained elevated at 72 h post-injury. Red cell/AnnV+ and platelet/AnnV+ MV numbers were 6-fold and 2-fold higher than controls, respectively. Patients who died (n=9, 18%) had significantly fewer CD41/AnnV+ MV and lower endogenous thrombin potential relative to patients who survived.
Conclusions
MV are elevated following traumatic injury and may be implicated in the increased risk of trauma patients to pro-thrombotic states such as MOF and ARDS. Lower levels of procoagulant MV are associated with mortality and further investigation of this association is warranted.
Thrombosis-related morbidity rates are high following traumatic injury particularly in patients who survive major haemorrhage (Citation1–Citation4). Pathophysiological changes that lead to the pro-thrombotic state after injury are incompletely understood. Inflammatory mediators, cytokines and microvesicles (MV) are known to be produced and released in large quantities following major trauma, which may contribute to a dysfunctional, exaggerated pro-thrombotic inflammatory response and risks of adverse clinical outcomes including secondary organ damage associated with acute respiratory distress syndrome (ARDS) and multiple organ failure (MOF) (Citation2), both of which have a high prevalence in trauma survivors (Citation5). Almost a third of severely injured patients develop MOF (Citation4) and in those patients who receive a major transfusion (≥6 Units RBC), 50% go on to develop ARDS (Citation3).
MV have been shown to play a role in the development of venous thromboembolism (VTE), MOF and ARDS (Citation5–Citation7). MV are small (100 nm−1 µM), extracellular vesicles, released from a range of cell types following cellular activation and injury, and possess cell markers that are characteristic of their cell of origin (Citation8). MV often express anionic phospholipids which can activate and support coagulation and thus promote thrombosis. Some types of MV (mostly those of monocytic or tumour origin) have exposed tissue factor (TF) on their surfaces, which can activate the clotting cascade and increase the risk of thrombosis (Citation8).
The overall objective of this pilot study was to characterise the changes in MV during trauma. The aims of this work were: (a) to determine whether there were increased numbers of MV in the plasma of patients following injury and to determine their cellular origin; (b) to ascertain whether the MVwere pro-coagulant in nature, due either to the presence of phospholipid or TF and (c) to explore the effects of MV with clinical outcomes; in particular red cell transfusion requirements and death.
Materials and methods
Patient selection
This was a sub-study of a larger prospective observational study (Activation of Coagulation and Inflammation after Trauma, ACIT) of consecutive trauma patients presenting directly to a Level 1 trauma centre. All adult trauma patients (16 years and over) who met the local criteria for trauma team activation were eligible for enrolment. Exclusion criteria were: arrival in the emergency department (ED) more than 2 h following injury, administration of more than 2,000 mL intravenous fluid prior to hospital arrival, transfer from another hospital, and burns of more than 5% total body surface area. Patients were retrospectively excluded if they: declined to give consent for the research study, were receiving anticoagulant medications (not including aspirin), or had moderate or severe liver disease or a known bleeding diathesis. Emergency consent was obtained from the trauma team leader (a physician independent of the research study), who acted as the patient's legally authorised representative. Written consent from the patient or next of kin was obtained as soon after enrolment as appropriate. Twenty healthy, age and gender matched, volunteers were used as a control group. The study was reviewed and approved by the National Research Ethics Committee.
Sampling technique
Blood was drawn from the antecubital fossa or femoral vein (trauma participants) or antecubital fossa only (healthy volunteers) with minimal stasis and at least a 5 mL discard. Blood draw from trauma participants was performed within 20 min of arrival to the ED. The blood for MV analysis was drawn into two 2.7 mL citrated Vacutainer tubes (0.109 M buffered sodium citrate, 3.2% (w/v) Becton Dickinson, Plymouth, UK) and processed in the trauma research laboratory. Blood samples were also drawn at 72 h (±12 h) from admission for trauma participants. Samples were drawn at 1 time point only for the healthy control group. All samples were transported to the laboratory with minimal agitation and were processed within 1h of collection (Citation9).
Pre-analytical sample handling was conducted as carefully as the clinical situation allowed and samples from the healthy controls were handled identically to trauma patients, to enable direct comparisons to be made between groups (Citation9, Citation10). Samples were subjected to a double centrifugation step; 2,000 g at 20°C for 20 min followed by 13,000 g at 20°C for 2 min (Citation11, Citation12). The resulting platelet free plasma was immediately frozen in 500 µL Eppendorf tubes at −80°C until batch analysis. Storage for controls and subjects samples was of similar duration and samples were analysed within 6 months of collection (Citation10). All samples were defrosted at 37°C in a water bath and analysis followed the methods set out below. None of the patients or controls were receiving thrombin inhibitors or treatment doses of low molecular weight heparin.
Sample analysis
The presence of MV procoagulant phospholipid was assessed using 2 activity assays (PPL and thrombin generation) and validated by flow cytometry. The presence of TF was assessed using the thrombin generation assay and validated by flow cytometry. Enumeration and cellular origin of the MV was assessed using 2 colour flow cytometry.
PPL assay
This is an automated clotting activity assay (STA®-Procoag-PPL, Stago, Asnieres, France) in which the measured clotting time is dependent on the quantity of PPL present in the test plasma. Exogenous PPL accelerates the activation of prothrombin by Factor Xa, therefore, the more PPL present in a plasma sample, the shorter the clotting time. 25 µL of test plasma was added to 25 µL of manufactured citrated human plasma, from which PPLs had been removed, and incubated at 37°C. 100 µL of a CaCl2 and bovine Factor Xa mix was added as an automated step and the time to fibrin formation was measured by the STA-R® evolution (Stago, Asnieres, France). All samples were tested in duplicate. Test assay controls (P-PPL Controls N and P) were performed according to the manufacturer's instructions (Stago Diagnostica, France).
CAT assay
Thrombin generation assays were performed on the plasma samples using 2 different reagents; PRP reagent and MP (microparticle) reagent. Thrombin generation was assessed by calibrated automated thrombography (CAT) as previously described (Citation13). 80 µL of platelet poor plasma from each trauma patient or healthy control was dispensed into the wells of round-bottom polypropylene 96-well micro titre plates. 20 µL of either a PRP reagent containing 1pM TF and no phospholipid (PRP reagent, TS42, Thrombinoscope, BV) or a MP reagent containing no TF and 4 µM phospholipid (a mixture of phosphatidylserine, phosphatidylethanolamine and phosphatidylcholine) (MP reagent, TS60, Thrombinoscope, BV), used to initiate thrombin generation, was added to the plasma samples. 20 µL FLUCA reagent (Fluca kit, TS50, Thrombinoscope, BV), containing fluorogenic substrate and CaCl2 were automatically dispensed by the fluorometer into each well to trigger thrombin generation. Fluorescence was continuously monitored with a Fluoroscan Ascent plate reader (Thermo Labsystems, Helsinki, Finland) and a dedicated programme, Thrombinoscope®, was used to calculate thrombin activity against a Thrombin Calibrator (TS30, Thrombinoscope, BV) and display thrombin activity versus time. The fluorescence filters used were an excitation filter of 390 nm and an emission filter of 460 nm, as supplied by Thrombinoscope BV. Four parameters were derived from the thrombograms: lag-time, time to peak, peak thrombin activity, and area under the curve – the endogenous thrombin potential (ETP) (Citation13).
Flow cytometry
All assays were performed on a BD LSR-II flow cytometer (BD Biosciences, Oxford, UK) and analysed at high flow rate with an aperture of 50 microns. Photomultiplier tube gain/voltage settingsand instrument thresholds were optimised for gating on MV using Megamix fluorescent beads (Biocytex, Marseille, France) (Citation9). Fluorescent labelled monoclonal antibodies (Beckman-Coulter and BD Pharmingen) were selected to establish the cellular origin of the MV. The antibodies selected were against pan leucocyte (CD45+), monocyte (CD14+), platelet GPIIb (CD41+), TF (CD142+), and red cell glycophorin A (CD235a+) surface markers. To differentiate between platelets and endothelial cells, a combination of CD31 and CD41 was used (i.e. endothelial cells were CD31 positive, CD41 negative) (Citation14, Citation15). To establish procoagulant properties of the MV, a dual labelling procedure was used, where by the MV were additionally labelled with either annexin V (BD Biosciences, Cowley, UK) (Citation16) or CD142+ (BD Biosciences) to detect expression of phospholipid or TF, respectively (see Table ). The CD142+ solution was centrifuged prior to use (at 12,000g for 2 min) and the resulting supernatant used, to remove antibody aggregates from the monoclonal antibody solution (Citation17). No other antibodies contained significant levels of antibody aggregates.
Table I. Monoclonal antibody markers
For each sample, 50 µL of test plasma was stained with 5 µL fluorochrome-labelled monoclonal antibody or respective isotype control. Isoton flow sheath fluid (40 µL) was then added and the tube incubated at room temperature for 10 min (Citation14). Samples were then diluted with a further 900 µL Isoton flow sheath fluid. 950 µL of this suspension was transferred to a Trucount® bead tube (BD Biosciences). For those samples labelled with annexin V-FITC, HBS-Ca (NaCl 0.145 mmol/L, KCl 5mmol/L, MgSO4 1 mmol/L, HEPES 10 mmol/L, pH 7.4) was used as the diluent containing either 2.5 mmol/L CaCl2 or K2 EDTA-HBS (5 mmol/L, K2 EDTA in HBS) in the control tubes. Where HBS-Ca was used, Gly–Pro–Arg–Pro amide (Sigma-Aldrich, Poole, UK) was used to prevent clot formation (Citation18), and the volume of diluent adjusted accordingly. All samples were subsequently evaluated with compensation made to control for fluorescence crosstalk of the emission spectra of fluorescein isothiocyanate and phycoerythrin in single labelling experiments. Trucount® beads (BD Biosciences) facilitated the accurate calculation of MV absolute numbers, using the following formulaFootnote
:
Isotype controls were performed to validate all test results, where a <2% cut-off was used and was similar for all controls. In addition to measuring the MV using a forward scatter trigger, 10 volunteer and 10 patient samples were analysed using an alternative analysis method using a fluorescence threshold or trigger alone to evaluate the effects of a scatter threshold and Megamix gating on microvesicle detection (Citation19).
Filtration analysis
To demonstrate the particulate nature of the MV, a small number of samples were analysed pre- and post-single filtration step. Five trauma samples and 5 healthy volunteer samples were tested using the PPL and thrombin generation assays and were then subjected to filtration using a 0.2 µm filter (Ceveron® MFU-500, Technoclone, Dorking, UK). The freshly prepared filtered aliquots were then re-analysed to study the impact of the removal of the MV by this procedure (Citation14).
Data collection
Data were collected prospectively on patient demographics, time of injury, mechanism of injury (blunt or penetrating), pre-hospital fluid administration, time of arrival to ED, and admission vital signs. Blood transfusion requirements were collected prospectively for each patient. Venous thromboembolic events (deep venous thrombosis and pulmonary embolism), organ failure data – that is, single organ failure, ARDS and MOF data were prospectively collected to day 28.
Outcome measures
Patients were followed until hospital discharge or death. Outcome measures recorded were 28 day mortality, red cell transfusion requirements, single organ failure, ARDS and MOF. ARDS was defined according to the Berlin consensus definition (Citation20) and organ failure was defined as a SOFA score of >2 for any of the 6 organs/systems evaluated, and MOF as more than 1 failing organ (Citation21).
Statistical analysis
Data were analysed using EXCEL 2003 (Microsoft Inc., Redmond, WA, USA) and SPSS (IBM Statistical Package for Social Sciences, version 20, Chicago, Illinois). All data were tested for normality. Normally distributed data were described using mean and standard deviation (SD), and non-parametric data were described using median and interquartile range (IQR). Parametric data were compared using a Student's t-test (unpaired, 2 tails) test and non-parametric data using a Mann–Whitney U test or Wilcoxon test as appropriate. Reference ranges were determined according to standard guidelines for PPL analysis, calculating the range as 1.96 SD from the mean. A p-value of <0.05 was chosen to represent statistical significance throughout, unless otherwise stated.
Results
Fifty consecutive patients were recruited over a 10 month period into the ACIT study at the John Radcliffe Hospital, Oxford, UK. No patients were excluded and all patients, or their next of kin, provided written informed consent. Fifty trauma samples were available for analysis at time 0 h but fewer samples were available for testing at time 72 h (n=30) as a result of: death (n=6), patients being discharged home (n=4) or patients declining blood samples (n=10). Median time from injury (estimated as the time from when the emergency services were alerted) to blood sampling was 64 min (IQR: 50–85 min). The demographics and injury characteristics of all patients are shown in Table . No patient developed a VTE, 4 patients (8%) developed ARDS and 3 (6%) developed single organ failure, whilst 4 (8%) patients developed MOF. Three out of the 4 patients with MOF also had ARDS.
Table II. Clinical characteristics of trauma patients
Twenty healthy volunteers formed the control group; median age 38 (IQR: 31–48) and 60% were male. Results for the control group conformed to normality (unless otherwise stated) and all results for the trauma patients’ violated normality (Kolmogorov–Smirnov and Shapiro–Wilks tests).
PPL analysis
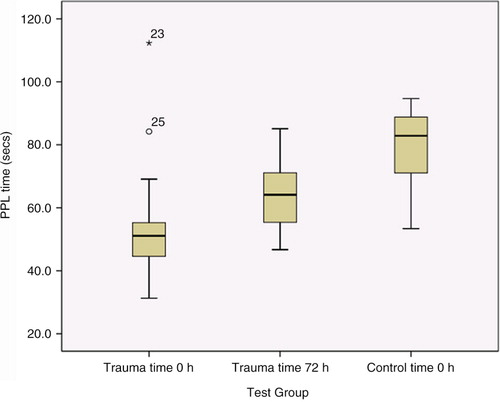
PPL clotting times were significantly shorter in the trauma group; median value 51.1 sec at time 0 h (IQR: 36.1–55.5 sec) and 64.2 sec at time 72 h (IQR: 55.7–70.6 sec), when compared with the control group, median 82.9 sec (IQR: 71.1–88.8 sec); p<0.001 for both time points (Mann–Whitney U, 2 tailed) (see ). 80% and 33% of trauma patients' results were shorter than the local normal range (data not shown), for admission and time 72 h, respectively. Comparison between the 2 time points for trauma demonstrated significantly shorter PPL times at admission than at 72 h (p<0.001, Wilcoxon signed rank).
Fig. 1. Procoagulant phospholipid measurements using the PPL assay: comparison of 2 time points following injury. Box plots (median and IQR) depicting average PPL results in trauma participants at 2 time points (time 0 and 72 h), when compared to a healthy control group. The PPL assays were significantly shorter (p<0.001) at both time points in the trauma cohort when compared to the control. Time 0 h trauma samples were significantly shorter than the results at time 72 h (p<0.001), suggesting more procoagulant MV early after injury.
CAT results
PRP reagent
All 4 CAT parameters for trauma patients at time 0 h were found to be significant relative to the control group (p≤0.001 for all parameters, except lagtime; p=0.003) (see Table ), indicating that thrombin generation was higher (64% of participants had an ETP higher than the normal range) and occurred more quickly in the trauma group. Comparison between the 2 time points for the trauma patients corroborated the PPL results; all CAT parameters were significant (ETP: p=0.02; lagtime, peak and ttPeak: p≤0.001) with time 0 h results being overall faster and having higher thrombin production. Peak thrombin production and ETP correlated highly with PPL times; r=−0.80 and −0.56, respectively (p≤0.001, Spearman rho).
Table III. Thrombin generation data: PRP reagent
MP reagent
Three CAT parameters at time 0 h were found to be significant relative to the control group (p≤0.001 for ETP and peak thrombin; p=0.04 for lagtime) (see Table ), with results that suggested that overall thrombin generation was lower but occurred more quickly in the trauma group. Time 72 h results were mixed when compared to the controls. Only 1 parameter, peak thrombin, was significantly higher than the control group (p=0.01). Overall, ETP was not significantly greater (p=0.5) than controls. Comparison between the 2 time points for the trauma patients revealed significantly different results (Lagtime: p=0.02; ttPeak: p=0.03; ETP and peak: p≤0.001) with time 0 h results being overall faster and having higher thrombin production.
Table IV. Thrombin generation data: microparticle reagent
Filtration results
Five trauma patients and 5 volunteers were analysed and these groups were representative of the each group as a whole. Significant prolongation of PPL times (p=0.04, Wilcoxon signed rank) occurred following filtration in trauma samples, with the average PPL time increasing by 48%. CAT results were consistent; a significant reduction in thrombin generation was seen (p=0.04). ETP and peak thrombin values fell by 62 and 78%, respectively. Filtration of control samples led to similar changes. These results suggest that particulate matter which is actively involved in coagulation is removed by filtration.
Flow cytometry
Trauma patients had significantly increased total numbers of Annexin V positive (AnnV+) MV relative to controls (p=0.001) (see Table ), and this included a 2-fold increase in those MV identified as platelet/AnnV+ (p=0.02) and a 6-fold increase in those MV identified as RBC/AnnV+ (p≤0.001) particles. The highest number of MV were found to label solely for AnnV+ and these were 2-fold higher in the trauma group relative to controls (p=0.01). Numbers of endothelial cells and leucocyte/TF marked cells did not differ significantly from the control group (p>0.1), but there were higher absolute numbers of monocyte/TF and platelet/TF MV in trauma patients.
Table V. Quantification of microvesicle numbers in platelet poor plasma from trauma and control groups using dual labelled flow cytometry
In order to assess whether trauma per se affected the relative proportions of MV subtypes, the percentage of each MV subtype was calculated for individual trauma patients as well as control subjects, and these data were compared using non-parametric tests (Table ). Significant differences were only noted in 2 MV subtypes: procoagulant red cells (CD235a+/AV+) and endothelial cells (CD31+/41−). There was a greater proportion of CD235a+/AV+ MV (p=0.02, Mann–Whitney U, 2 tailed) and a lower proportion of CD31+/41− MV (p=0.004, Mann–Whitney U, 2 tailed) in the plasma of trauma patients.
Analysis using a fluorescence threshold delivered near comparable results, but with higher numbers of MV found for each cell type. The only result that was in variance to scatter thresholding, was that a significantly higher number of endothelial cells were seen in the trauma group relative to controls (data not shown)
Correlation with clinical outcomes
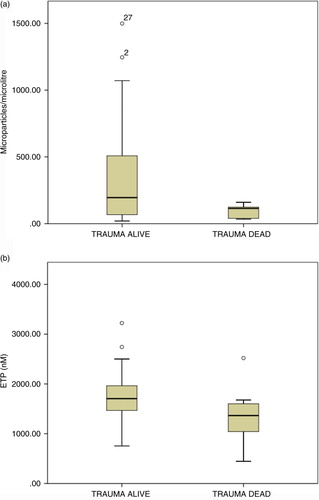
The PRP ETP result at admission was significantly lower in patients who died (median=1524.5 per µL; IQR: 1155.5–1551.5) relative to those who survived to day 28 (median=1732.3 per µL; IQR: 1,466–1973.9) (p=0.025, Mann–Whitney U, 2 tailed). In keeping with this finding, absolute numbers of CD41/Annexin V-positive MV were significantly lower in trauma patients who died (n=9, median=40.2 per µL; IQR: 38.6–133.5) compared to patients who survived (n=41, median=202.1 per µL; IQR: 93.4–561.7) to day 28 (p=0.015, Mann–Whitney U, 2 tailed) (see ). Survival correlated positively with CD41/AnnV+ MV numbers (p=0.01, r=0.35). Median platelet counts were significantly lower 197×10−9L (IQR: 145–223) in the cohort of patients that died compared with 273×10−9 L (IQR: 223–301) in those that survived (p=0.004, Mann–Whitney U, 2 tailed). The platelet count and CD41/AnnV+ MV numbers did not show a correlation with each other (r=−0.12; p=0.44).
Fig. 2. Association between procoagulant microvesicle number, procoagulant derived thrombin generation and mortality. (a). Numbers of procoagulant MV of platelet origin (CD41+/AnnV+) in the plasma of samples at admission to hospital from trauma survivors and non-survivors. There is a significantly greater number of platelet derived procoagulant MV in plasma from survivors (n=41, median=202.1 per µL; IQR: 93.4–561.7) when compared to participants who died (n=9, median=40.2 per µL; IQR: 38.6–133.5) (p=0.015). Survival correlated positively with CD41/AnnV+ MV numbers (p=0.01, r=0.35). (b). Endogenous thrombin potential values in admission samples from trauma survivors and non-survivors. Box plots of median ETP values (PRP reagent) comparing survivors with non-survivors. The PRP ETP result at admission was significantly lower in patients who died (median=1524.5 per µL; IQR: 1155.5–1551.5) relative to those who survived to day 28 (median=1732.3 per µL; IQR: 1466–1973.9) (p=0.025).
A trend was seen between numbers of TF-positive MV at admission and numbers of RBC transfused within the first 24 h of admission; r=0.247, p=0.09 for platelet/TF microparticles and r=0.248, p=0.05 for monocyte/TF MV (all TF-positive cells together: r=0.395, p=0.005). When dividing the trauma group into those who received no RBC or those who received at least 1 unit or more RBC; there was a significantly greater number of platelet/TF-positive MV (median=40.5µL−1; IQR: 30.2–53.4) in the group that received RBC relative to the group that received no RBC (median=24.7µL−1; IQR: 8.9–45.6).
Discussion
This pilot study has characterised and reported on longitudinal changes in MV formation in trauma. Using 3 complementary laboratory methods, circulating procoagulant MV, rich in phospholipid, were found to be significantly elevated following traumatic injury relative to controls and remained elevated at 72 h post injury. The presence of procoagulant particulate matter was confirmed by filtration. Red cell/AnnV+ and platelet/AnnV+ MV numbers were 6-fold and 2-fold higher than controls, respectively. Endothelial cell and leucocyte/TF microvesicle numbers were not elevated following trauma and although the absolute numbers of monocyte/TF and platelet/TF MV were higher in the trauma group compared to controls, significance was not reached.
MV are known to be released following cellular activation, as well as during vascular shear stress (Citation8, Citation22), and it was hypothesised that MV numbers would increase following trauma. All 3 laboratory methods confirmed that injury caused a significant increase in MV associated phospholipid procoagulant activity (as measured by PPL and CAT PRP assays) and an increase in total numbers of phospholipid-rich procoagulant MV (as measured by flow cytometry). There were differences between the distribution of MV between trauma and control subjects. Recently published data show similar results with both elevated procoagulant red cell MV and proportionately lower platelet MV in the trauma group (Citation23).
A strong relationship was evident between results from the 2 activity assays, providing intra-study validation and as further confirmation, there was good correlation between total numbers of AnnV+ microvesicles and PRP ETP (r=0.34; p=0.02) and PRP peak thrombin production (r=0.33; p=0.02). These results provide early evidence that trauma leads to a marked increase in phospholipid rich red cell and platelet MV that have procoagulant activity by the time of hospital admission. These data confirm results from another study to evaluate MV after injury (Citation24), although this study was also able to demonstrate a relationship between AnnV+MV number and injury severity, which was not evident with these data.
This study did not demonstrate a significant increase in TF-positive MV numbers, using either flow cytometry or CAT, although a small absolute increase in numbers was seen. The presence of TF on MV has been reported to be an important risk factor for thrombosis (Citation25). In health, circulating TF levels are low, and the majority of TF can be found on MV surfaces (Citation26). Other studies have reported high plasma TF levels after traumatic injury (Citation27, Citation28). The reasons for these differences are unclear. There has been no consensus about the most accurate standard for the measurement of TF-bearing MV (Citation29) and false-negative results with certain anti-TF monoclonal antibodies can occur as shown with HTF-1 the clone used in this study (Citation30). It is also possible that MV associated TF due to its low copy number and/or the size of vesicle measured is below the detection limit of current flow cytometers (Citation31).
In our study, an activity assay was also used to improve validity of results. Of interest, however, was the positive finding that the volume of RBC transfused was associated with higher TF-rich MV numbers. It is theoretically possible that those patients with greater vessel damage, that is, those more likely to bleed also have greater amounts of exposed subendothelial TF.
Nine trauma patients died in our study. Eight patients had a pro-thrombotic disorder: ARDS, and/or single or MOF. None of the patients developed a VTE during their hospital stay. These small numbers limit interpretation of the results for clinical implications. No clear associations were found with either MV numbers or activity and outcomes. Of interest, patients who died were found to have significantly lower numbers of CD41+/AnnV+ MV and lower ETP relative to patients who survived. This suggests that those patients at greatest risk of death were those unable to mount a hypercoagulable response to injury. A recent study in trauma confirmed the association between fewer CD41+/AnnV+ MV, hypocoagulability and mortality (Citation23). Similar associations between MOF and/or mortality and MV have been reported in other studies (Citation32, Citation33). In a small study, Soriano et al. (Citation32) showed that platelet MV numbers and markers of inflammation were significantly lower in septic patients with MOF, and were strong predictors of death.
There are potential limitations to this study, in addition to sample size. Analysis of MV depends on many pre-analytical and analytical factors (Citation9) and to minimise variation this study followed the recommended ISTH SSC guidance for standardisation of MV analysis. Notably, however, there were significant differences in numbers of MV detected depending on the set up of the flow cytometer (using a scatter threshold and instrument parameters/gating set with polystyrene megamix beads compared to a fluorescence threshold). The data from this study confirm that instrument settings based upon a scatter trigger and calibration bead gating leads to detection of only larger MV with loss of detection of smaller MV (Citation19). A fluorescence threshold therefore enables smaller MV to be detected (Citation34). Similarly, CAT results are highly dependent on TF quantities and the presence of contact factor activation (Citation35). The CAT samples were not collected in corn trypsin inhibitor (which inhibits contact activation) for pragmatic reasons and this may have had an effect on the CAT results. The comparison of results between volunteer and patient groups went some way towards minimising the importance of this effect.
Conclusions
MV are elevated following traumatic injury, and have been shown in vitro to be procoagulant in nature. These MV may be implicated in the increased risk of trauma patients to VTE and other pro-thrombotic states such as MOF and ARDS. Lower levels of procoagulant MV are associated with mortality and further investigation of this association is warranted as MV levels and transient increases following injury may be an important and normal physiological response to injury.
Conflict of interest and funding
The authors have not received any funding or benefits from industry or elsewhere to conduct this study. Paul Harrison is funded by the Healing Foundation.
Notes
*Provided by manufacturer.
Related Research Data
References
- Selby R, Geerts W, Ofosu FA, Craven S, Dewar L, Phillips A et al. Hypercoagulability after trauma: hemostatic changes and relationship to venous thromboembolism. Thromb Res. 2009; 124: 281–7. [PubMed Abstract].
- Gruen RL, Brohi K, Schreiber M, Balogh ZJ, Pitt V, Narayan M et al. Haemorrhage control in severely injured patients. Lancet. 2012; 380: 1099–108. [PubMed Abstract].
- Holena DN, Netzer G, Localio R, Gallop RJ, Bellamy SL, Meyer NJ et al. The association of early transfusion with acute lung injury in patients with severe injury. J Trauma Acute Care Surg. 2012; 73: 825–31. [PubMed Abstract] [PubMed CentralFull Text].
- Minei JP, Cuschieri J, Sperry J, Moore EE, West MA, Harbrecht BG et al. Inflammation and the Host Response to Injury Collaborative Research Program. The changing pattern and implications of multiple organ failure after blunt injury with hemorrhagic shock. Crit Care Med. 2012; 40: 1129–35. [PubMed Abstract] [PubMed CentralFull Text].
- Abrams ST, Zhang N, Manson J, Liu T, Dart C, Baluwa F et al. Circulating histones are mediators of trauma-associated lung injury. Am J Respir Crit Care Med. 2013; 187: 160–9. [PubMed Abstract] [PubMed CentralFull Text].
- Morel O, Morel N, Freyssinet JM, Toti F. Platelet microparticles and vascular cell interactions: a checkpoint between the haemostatic and thrombotic responses. Platelets. 2008; 19: 9–23. [PubMed Abstract].
- Chirono GN, Boulanger CM, Simon A, Dignat-George F, Freyssinet JM, Tedgui A. Endothelial microparticles in diseases. Cell Tissue Res. 2009; 335: 143–51.
- Lee RD, Barcel DA, Williams JC, Wang JG, Boles JC, Manly DA et al. Pre-analytical and analytical variables affecting the measurement of plasma-derived microparticle tissue factor activity. Thromb Res. 2012; 129: 80–5. [PubMed Abstract] [PubMed CentralFull Text].
- Lacroix R, Robert S, Poncelet P, Kasthuri RS, Key NS, Dignat-George F, on behalf of the ISTH SSC Workshop. Standardization of platelet-derived microparticle enumeration by flow cytometry with calibrated beads: results of the International Society on Thrombosis and Haemostasis SSC Collaborative workshop. J Thromb Haemost. 2010; 8: 2571–4. [PubMed Abstract].
- Ayers L, Kohler M, Harrison P, Sargent I, Dragovic R, Schaap M et al. Measurement of circulating cell-derived microparticles by flow cytometry: sources of variability within the assay. Thromb Res. 2011; 127: 370–7. [PubMed Abstract].
- Aupeix K, Hugel B, Martin T, Bischoff P, Lill H, Pasquali JL et al. The significance of shed membrane particles during programmed cell death in vitro, and in vivo, in HIV-1 infection. J Clin Invest. 1997; 99: 1546–54. [PubMed Abstract] [PubMed CentralFull Text].
- Hugel B, Zobairi F, Freyssinet JM. Measuring circulating-cell derived microparticles. J Thromb Haemost. 2004; 2: 1846–7.
- Hemker HC, Giesen P, Al Dieri R, Regnault V, de Smedt E, Wagenvoord R et al. Calibrated automated thrombin generation measurement in clotting plasma. Pathophysiol Haemost Thromb. 2003; 33: 4–15. [PubMed Abstract].
- Lawrie AS, Harrison P, Cardigan RA, Mackie I. The characterization and impact of microparticles on haemostasis within fresh-frozen plasma. Vox Sang. 2008; 95: 197–204. [PubMed Abstract].
- Lynch SF, Ludlam CA. Plasma microparticles and vascular disorders. Br J Haematol. 2007; 137: 36–48. [PubMed Abstract].
- Xiong Z, Oriss TB, Cavaretta JP, Rosengart MR, Lee JS. Red cell microparticle enumeration: validation of a flow cytometric approach. Vox Sang. 2012; 103: 42–8. [PubMed Abstract].
- Aass HC, Øvstebø R, Trøseid AM, Kierulf P, Berg JP, Henriksson CE. Fluorescent particles in the antibody solution result in false TF- and CD14-positive microparticles in flow cytometric analysis. Cytometry. 2011; 79: 990–9. [PubMed Abstract].
- Michelson AD. Platelet activation by thrombin can be directly measured in whole blood through the use of the peptide GPRP and flow cytometry: methods and clinical applications. Blood Coag Fibrinolysis. 1994; 5: 121–31.
- Harrison P, Gardiner C. Invisible vesicles swarm within the iceberg. J Thromb Haemost. 2012; 10: 916–18. [PubMed Abstract].
- Definition Task Force ARDS, Ranieri VM, Rubenfeld GD, Thompson BT, Ferguson ND, Caldwell E et al. Acute respiratory distress syndrome: the Berlin Definition. JAMA. 2012; 307: 2526–33.
- Vincent JL, DeMendonca A, Cantraine F, Takala J, Suter PM, Sprung CL et al. Use of the SOFA score to assess the incidence of organ dysfunction/failure in intensive care units: results of a multicenter, prospective study. Working group on ‘sepsis-related problems’ of the European Society of Intensive Care Medicine. Crit Care. 1998; 26: 1793–800.
- Rubin O, Delobel J, Prudent M, Lion N, Kohl K, Tucker EI et al. Red blood cell-derived microparticles isolated from blood units initiate and propagate thrombin generation. Transfusion. 2013; 53: 1744–54. [PubMed Abstract].
- Matijevic N, Wang YW, Wade CE, Holcomb JB, Cotton BA, Schreiber MA et al. Cellular microparticle and thrombogram phenotypes in the Prospective Observational Multicenter Major Trauma Transfusion (PROMMTT) Study: correlation with coagulopathy. Thromb Res. 2014; 134: 652–8. [PubMed Abstract].
- Park MS, Owen BA, Ballinger BA, Sarr MG, Schiller HJ, Zietlow SP et al. Quantification of hypercoagulable state after blunt trauma: microparticle and thrombin generation are increased relative to injury severity, while standard markers are not. Surgery. 2012; 151: 831–6. [PubMed Abstract] [PubMed CentralFull Text].
- Thaler J, Ay C, Mackman N, Bertina RM, Kaider A, Marosi C et al. Microparticle-associated tissue factor activity, venous thromboembolism and mortality in pancreatic, gastric, colorectal and brain cancer patients. J Thromb Haemost. 2012; 10: 1363–70. [PubMed Abstract].
- Key NS. Analysis of tissue factor positive microparticles. Thromb Res. 2010; 125(Suppl 1): S42–5. [PubMed Abstract] [PubMed CentralFull Text].
- Gando S, Nanzaki S, Sasaki S, Kemmotsu O. Significant correlations between tissue factor and thrombin markers in trauma and septic patients with disseminated intravascular coagulation. Thromb Haemost. 1998; 79: 1111–15. [PubMed Abstract].
- Chandler W. Procoagulant activity in trauma patients. Am J Clin Pathol. 2010; 134: 90–6. [PubMed Abstract].
- Zwicker JI, Lacroix R, Dignat-George F, Furie BC, Furie B. Measurement of platelet microparticles. Methods Mol Biol. 2012; 788: 127–39. [PubMed Abstract].
- Basavaraj MG, Olsen JO, Østerud B, Hansen JB. Differential ability of tissue factor antibody clones on detection of tissue factor in blood cells and microparticles. Thromb Res. 2012; 130: 538–46. [PubMed Abstract].
- Tatsumi K, Antoniak S, Monroe DM III, Khorana AA, Mackman N, for the Subcommittee on Hemostasis and Malignancy. Evaluation of a new commercial assay to measure microparticle tissue factor activity in plasma: communication from the SSC of the ISTH. J Thromb Haemostasis. 2014; 13: 1–3.
- Soriano AO, Jy W, Chirinos JA, Valdivia MA, Velasquez HS, Jimenez JJ et al. Levels of endothelial and platelet microparticles and their interactions with leucocytes negatively correlate with organ dysfunction and predict mortality in severe sepsis. Crit Care Med. 2005; 33: 2540–6. [PubMed Abstract].
- Joop K, Berckmans RJ, Nieuwland R, Berkhout J, Romijn FP, Hack CE et al. Microparticles from patients with multiple organ dysfunction syndrome and sepsis support coagulation through multiple mechanisms. Thromb Haemost. 2001; 85: 810–20. [PubMed Abstract].
- Nolan JP, Stoner SA. A trigger channel threshold artefact in nanoparticle analysis. Cytometry. 2013; 83: 301–5. [PubMed Abstract] [PubMed CentralFull Text].
- Spronk HM, Dielis AW, Panova-Noeva M, van Oerle R, Govers-Riemslag JW, Hamulyak K et al. Monitoring thrombin generation: is addition of corn trypsin inhibitor needed?. Thromb Haemost. 2009; 101: 1156–62. [PubMed Abstract].