Abstract
Six-year data (2006–2011) of short-wave (SW) radiation, aerosol optical depth and cloud fraction were used in the evaluation of cloud radiative forcing (1-min data) at the surface in the SW spectral range at Granada station (South-Western Europe). Three different systems were analysed in this study: cloud radiative forcing (CRFSW), cloud–aerosol radiative forcing (CARFSW) and aerosol radiative forcing under cloudy conditions (ARFSW). Average values of these variables presented a clear dependence on solar zenith angle (SZA), for example, at SZA=30°, the results were CRFSW=−78 W m−2, CARFSW=−100 W m−2 and ARFSW=−22 W m−2, and the values decreased to CRFSW=−50 W m−2, CARFSW=−69 W m−2 and ARFSW=−19 W m−2 at SZA=60°. These three variables exhibited a similar pattern: they increased in the absolute magnitude up to moderate SZAs and strongly decreased towards zero for high SZAs. The hemispherical fractional sky cover (SCV) and the fractional sky cover inside the octant where the Sun is placed (SCV-Sun) also played a key role in the determination of cloud forcing. As expected, the strongest cloud effect appeared when clouds covered the Sun. However, when SCV-Sun was low or moderate and total SCV was over 0.5, there was a high likelihood of enhancement occurrence (i.e., positive cloud forcing values). Finally, the evolution of CRFSW values during a case study (ranging from −600 to +200 W m−2) with a wide variety of cloud conditions could be explained by the temporal evolution of SCV and SCV-Sun.
1. Introduction
The climate system is defined as an interactive system consisting of the atmosphere, Earth's surface and biosphere (Denman et al., Citation2007). It is powered by solar radiation mainly in the short-wave (SW) spectral range up to 4 µm. Radiation reaching the top of the Earth's atmosphere (TOA) can be absorbed, scattered and reflected back to space by the atmospheric constituents (e.g., gases, clouds, aerosols) and the Earth's surface. To balance incoming radiation, energy is emitted from the Earth as longwave (LW) radiation, with a wavelength larger than 4 µm. Clouds are the main factor involved in modulating the energy balance (Ramanathan et al., Citation1989), because they can reflect solar radiation back to space (albedo effect), absorb a fraction of solar radiation, scatter the solar radiation to Earth's surface (scattering effect) and trap infrared radiation emitted by both the surface and the lower troposphere, re-emitting it to the Earth's surface (greenhouse effect) (Alados-Arboledas et al., Citation1995). The relationship between these effects depends on many factors, including cloud microphysical properties (Denman et al., Citation2007). The term surface cloud radiative forcing (CRF) at the SW spectral range (CRFSW) defines the change of the net SW radiation at ground level that is due to variations in cloud conditions (Ramanathan et al., Citation1989). An equivalent definition can be applied to the surface CRF at the LW range (CRFLW). Hence, the net surface CRF at the surface is the sum of CRFSW and CRFLW.
Numerous studies have been focused on the evaluation of net CRF, CRFSW and CRFLW; however, only a few of them were carried out using experimental ground-based data. Intrieri et al. (Citation2002) and Shupe and Intrieri (Citation2004) analysed the annual cycle of the net CRF in the Arctic and their dependences on cloud fraction, cloud microphysical properties and solar zenith angle (SZA). They found that, generally, Arctic clouds warm the surface with a strong effect of SZA, liquid water path and surface albedo. As regards the hourly evolution of the CRFSW, Wacker et al. (Citation2011) and Dong et al. (Citation2006) in Switzerland and the United States, respectively, obtained the maximum cloud radiative effect around solar noon because the Sun is highest in the sky and the cloud shading effect is strongest. The seasonal variation of monthly CRFSW averages in the United States exhibits the extreme CRFSW values in spring months (e.g., Gautier and Landsfeld, Citation1997; Dong et al., Citation2006; Ebell et al., Citation2011). Hourly values of CRFSW and CRFLW were studied by Berg et al. (Citation2011) in the United States as a function of fractional sky cover. These two variables show different behaviours when the cloud cover increases. SW forcing at surface, atmosphere and TOA were evaluated by Mace et al. (Citation2006) for overcast conditions at the Atmospheric Radiation Measurement Program – Southern Great Plains site, discovering that CRFSW is a function of cloud type. Usually, satellite data are used in the evaluation of CRF to obtain its geographical and seasonal trends (e.g., Su et al., Citation2008; Allan, Citation2011; Taylor, Citation2012). Intercomparisons of several case studies have shown a good agreement between the CRF derived from satellite and ground-based data (e.g., Hanschmann et al., Citation2012). Different radiative transfer models have also been used to determine the effect of diverse atmospheric variables on cloud forcing (e.g., Erlick and Ramaswamy, Citation2003; Kim and Ramanathan, Citation2008; Corti and Peter, Citation2009; Andrews et al., Citation2010).
When CRFSW is obtained from experimental ground-based data recorded under cloudy conditions, it is necessary to estimate the equivalent values for cloudless sky conditions. Following the analysis carried out by Erlick and Ramaswamy (Citation2003), there are different scenarios depending on the variables used in the cloudless-sky modelling. If aerosols are considered in these simulations, the forcing evaluation can be exclusively related to clouds, that is, CRFSW. However, if no aerosol information is used in the model, the forcing is obtained for the cloud–aerosol system, that is, cloud–aerosol radiative forcing (CARFSW). Other variables, such as the water vapour profile within the cloud layer exhibit less impact on forcing evaluation (Erlick and Ramaswamy, Citation2003). Therefore, the aerosol radiative forcing (ARFSW) under cloudy conditions can be evaluated as CARFSW–CRFSW.
The uniqueness of this work is the simultaneous evaluation of the CRFSW, CARFSW and ARFSW from experimental data at the surface. In fact, few studies deal with the impact of aerosols on radiative properties under cloudy conditions (e.g., Erlick et al., Citation1998; Taylor et al., Citation2000) and, to our knowledge, no studies about empirical estimations of aerosol forcing under cloudy conditions are found in the literature. Hence, the main aim of this study is to characterise instantaneous forcing of the three systems mentioned above. To this end, good estimations under cloud-free conditions were proposed by using empirical models. The role of SZA and the fractional sky cover inside the octant where the Sun is placed (SCV-Sun) were also analysed. A case study was useful to better explain the cloud forcing at the Earth's surface.
The article has the following structure: in Sections 2 and 3, a detailed description of the ground-based station and the methodology, respectively, can be found. Section 4 shows the proposal and validation of the empirical cloudless models for SW radiation. The analysis of the CRFSW is carried out in Section 5 including a statistical study, the role of different variables, and a case study. Finally, the conclusion section summarises the main results obtained in this article.
2. Instruments and data
Ground-based data were measured at the radiometric station located on the rooftop of the Andalusian Center for Environmental Studies (CEAMA, 37.16°N, 3.60°W, 680 m a.s.l.) in Granada (South-Eastern Spain). This ground-based station is equipped with a pyranometer (CM-11, Kipp & Zonnen) for the measurement of global (direct plus diffuse) solar irradiance from 0.305 to 2.8 µm with a resolution of 1 minute. The CM-11 pyranometer is fully compliant with the highest ISO performance criteria for this type of instrument. According to Kratzenberg et al. (Citation2006), this type of pyranometer has a combined standard uncertainty of 15 W m−2 for a global solar irradiance of 800 W m−2 (relative uncertainty of 1.9%). The stability of the calibration factor is periodically verified using a reference instrument at the study site, with variations below 1% (four intercomparisons were performed between March 2005 and June 2010).
A sun-photometer (CE-318-4, Cimel Electronique, France), included in the NASA Aerosol Robotic Network (AERONET) (Holben et al., 1998), is located near the CM-11 pyranometer. The sun-photometer provides solar extinction measurements in seven channels ranging from 340 to 1020nm under cloud-free conditions. Sky radiances in the solar almucantar configuration are measured at 440, 670, 870 and 1020 nm. The solar extinction measurements are used to compute the aerosol optical depth (AOD) at 340, 380, 440, 670, 870 and 1020nm (Holben et al., Citation1998). The uncertainty ranges from±0.01 in the infrared-visible to±0.02 in the ultraviolet channels (Eck et al., Citation1999). The daily values of AERONET level 2 data, the highest quality AERONET data (Dubovik and King, Citation2000) of the aerosol optical depth at 440 nm (AOD440 nm) were used in this work. As in this study, we only needed a source of information about the aerosol load in the atmosphere; this variable was the simplest option to carry out this classification. When persistent cloudy conditions were present throughout a given day, and no Cimel measurements were available, a linear interpolation between the next and previous daily AOD440 nm averages values was performed. To ensure the applicability of this method, the longest subset of consecutive CIMEL data during 2006 and 2011 was used. More than 40 daily AOD440 nm data were obtained by the new method and compared with the real AERONET data. As a result, the linear interpolation methodology introduced an average uncertainty about 15%. This result is suitable for this study since it allows more than 500 daily new data to be included in the analysis.
An All-Sky Imager was used to obtain images of the whole sky dome in daytime every 5 minutes during the study period (Cazorla et al., Citation2008a). This instrument is a custom adaptation of a CCD camera for scientific use with a fish-eye lens pointing at zenith and has been previously used for cloud cover characterisation and retrieval of atmospheric aerosol load (Cazorla et al., Citation2008b, Citation2009; Olmo et al., Citation2008). In this work, the cloud cover was characterised by the hemispherical fractional sky cover (SCV) and the fractional sky cover inside the octant where the Sun is placed (SCV-Sun). Values of these variables were supposed to be constant during the 5 minutes and attributed to the SW radiation data (1-min resolution).
3. Methodology
The instantaneous variation in cloud conditions produces changes on the net SW radiation flux at the surface, being the net flux the difference between the downwelling and the upwelling surface flux. This is known as surface CRFSW and can be derived from1
Assuming that with α the surface albedo, CRFSW can be obtained from Ramanathan et al. (Citation1989) as follows:
2
where represents the experimental global solar irradiance recorded at the surface under any cloudy conditions and
corresponds to the global solar irradiance for the same SZA but for cloud-free conditions which were simulated by means of an empirical expression, as explained in the next section. These simulated values took into account the aerosols during cloudy conditions and so the radiative forcing may be exclusively related to clouds. Nevertheless, the forcing for the cloud–aerosol system, that is, cloud–aerosol radiative forcing (CARFSW), can be easily calculated if the global solar radiation is modelled for aerosol-free and cloud-free conditions:
3
Finally, the aerosol radiative forcing (ARFSW) under cloudy conditions was obtained as follows:4
To establish the percentage of each forcing with respect to the net SW radiation under cloud-free conditions, we also evaluated the normalised cloud forcing (Sengupta et al., Citation2004) as follows:5
6
7
The surface albedo used in eqs. (2) and (3) is a monthly ‘effective’ broadband albedo with values between 0.16 (January and December) and 0.20 (July, August and September) which was derived from Strahler et al. (Citation1999) as follows:8
where E(λ) is the spectral solar irradiance at the surface under cloud–aerosol-free conditions simulated by SBDART code (Ricchiazzi et al., Citation1998) and α(λ) is the spectral surface albedo derived from the interpolation/extrapolation of the monthly average spectral values given by the AERONET at 440, 675, 870 and 1020 nm, calculated for Granada station. As we were using broadband SW measurements in the CRFSW and CARFSW evaluation by eqs. (2) and (3), the use of the spectral surface albedo values was meaningless. Hence, the ‘effective’ broadband surface albedo must be calculated.
4. Empirical SW model under cloud-free conditions
In this section, an empirical model to obtain SW radiation under cloud-free conditions was evaluated as a function of the values of the SZA and AOD440 nm. We elaborated a list of cloud-free days selecting those cases with SCV=0 (obtained by the All-Sky Imager) throughout the day. In addition, a visual inspection of each day was carried out to ensure real cloud-free conditions. The whole 1-min data series under cloud-free conditions was divided into two sub-groups. The period from January 2006 to December 2010 was used to construct the empirical model, while the period from January 2011 to December 2011 was selected for the validation process. In this way, CRF can be evaluated for the whole database (January 2006–December 2011).
With the corresponding sub-group, the dataset was classified as a function of the value of the AOD440
nm in seven intervals: (0, 0.1], (0.1, 0.2], …, (0.5, 0.6] and (0.6, 1.0]. For each class, a fit in the form of eq. (9) was carried out.9
This empirical model was already used for the estimation of SW radiation in other studies (e.g., Mateos et al., Citation2010; de Miguel et al., Citation2011). shows the three fitting coefficients (c 1, c 2 and c 3) for each interval of AOD440 nm that were obtained for this database. As can be observed, each interval of aerosol load exhibits different coefficients, which highlights the influence of atmospheric aerosols on SW radiation.
Table 1. Values of c 1, c 2 and c 3 (eq. 1) for each interval of AOD440 nm
The c
1, c
2 and c
3 coefficients when 0<AOD440
nm≤0.1 (see ) can be used to evaluate the SW radiation under cloud- and aerosol-free conditions ().
The data from 2011 (not used in the previous calculation of the fitting coefficients) were utilised to validate the model proposed in eq. (1) and . In the validation process, several statistical indices were evaluated:10
11
where x i is the predicted i value, y i is the i measurement, y ave is the database average value of this variable and n is the data number.
In addition, linear fits and the percentage of cases falling below ±i% of error (W i%) were also calculated. For instance, W10% is the percentage of cases with an error <10%. shows the comparison between the estimations under cloud-free conditions using eq. (9) and the experimental data. The linear fit plotted in , and the values of the other statistical estimators are presented in . The analysis showed satisfactory results with slope close to the unity, correlation coefficient r 2=0.99 and rmse of 4.6%, supporting the validity of the empirical model used in this work. The results indicated that around 99% of the global solar radiation variability under cloud-free conditions in Granada may be attributed to changes in the SZA and the aerosol properties. Other variables, such as atmospheric water vapour, seem to play a minor role. To corroborate this topic, a simple sensitivity analysis was performed with the libRadtran v1.6 model (Mayer and Kylling, Citation2005) considering two ‘extreme’ values of both AOD440 nm and precipitable water column (PWC) in the atmosphere. The values of the aerosol load were 0.05 and 0.6, while the ones for PWC were 0.5 and 2.5 cm. These figures included >97% of the daily data over this measuring site. At SZA=20°, the change on SW radiation between the two cases of AOD440 nm was −75 W m−2, while this value decreased (in absolute term) for the PWC up to −59 W m−2. The impact of aerosol and water vapour on SW radiation diminished at SZA=80°: −44 W m−2 when AOD440 nm passed from 0.6 to 0.05; and −13 W m−2 when PWC changed between 2.5 and 0.5 cm. As pointed out by Di Biagio et al. (Citation2012), the change in SW radiation due to water vapour does not follow a linear relationship. In addition, the range of surface albedo of the measuring site (0.16 and 0.20) had minimal impact on SW radiation levels. Therefore, aerosol load resulted in the main parameter in the cloud-free modelling for SW radiation over Granada station.
Fig. 1 Comparison of SW measurements and estimations by eq. (1) and . Solid line is the linear fit and dashed line is the 1:1 line.
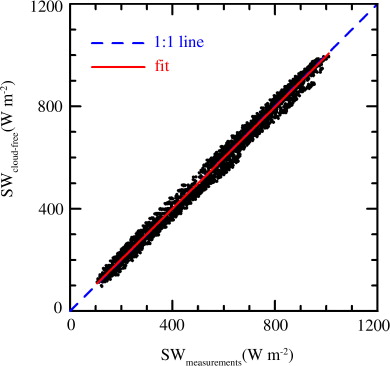
Table 2. Statistical estimators in the validation of SWcloud−free model [eq. (1) and Table 1]
5. Results and discussion
5.1. Statistics of CRFSW, CARFSW and ARFSW
In this section, the 1-min database (2006–2011) of the cloud forcing was classified as a function of the SZA. Each interval of SZA was taken with a width of ±0.5°. We performed a complete statistical study between 14 and 80° of SZA at 1° steps. To facilitate the understanding, shows the information obtained at two SZAs (30° and 60°). From these results, it can be seen that the distribution of the three data series (CRFSW, CARFSW and ARFSW) is not symmetric; the average and median value of each series differ significantly, being the average value out of the interval limited by the first and third quartiles. This result may be related to the strong attenuation that presents the surface solar radiation during overcast conditions (intense negative cloud forcing) although these situations are less common than cloudless and partially cloudy cases at the study location (e.g., Foyo-Moreno et al., Citation2003). This explanation was supported by the large values of the standard deviation derived from the analysis, pointing out a wide dispersion in the cloud forcing values at the study site. This fact can be associated with different cloudy conditions: diverse sky cover, the Sun covered or not covered by clouds, and different cloud optical and microphysical properties. also shows the statistical parameters for the normalised cloud forcing (ratio of cloud forcing to the cloud-free net global radiation) with average values (in absolute value) around 11% for NCRFSW, about 14% for NCARFSW and below 3% for the NARFSW.
Table 3. CRFSW (NCRFSW), CARFSW (NCARFSW) and ARFSW (NARFSW) 1-min statistics at 30° and 60° of SZA: average (ave), standard deviation (SD), first quartile (q1), median (md) and third quartile (q3)
Due to the methodology used in this study, those cases with AOD440
nm≤0.1 exhibited CRFSW=CARFSW, that is, ARFSW=0, since and
were identical in eqs. (2) and (3). Hence, the value of ARFSW=0 was the minimum absolute value of the aerosol forcing in this study.
The average CRFSW values can be compared with previous studies. Wacker et al. (Citation2011) obtained at local noon cloud radiative effect between −167.4 and −456 W m−2 for different cloudy scenarios at Payerne (Switzerland). Using hourly data, Shupe and Intrieri (Citation2004) obtained CRFSW between −200 and +20 Wn m−2 in the Arctic. Dong et al. (Citation2006) and Berg et al. (Citation2011) recorded maximum hourly CRFSW around −400 W m−2 in the United States. At the same American ground-based station, Gautier and Landsfeld (Citation1997) evaluated the frequency distribution of the hourly CRFSW, showing the maximum occurrence at the interval 0 W m−2<CRFSW<−50 W m−2, but with some periods presenting cloud forcing values reaching −800 W m−2. Although cloud properties and time resolutions were different in each study, all these values seem to be in agreement. Instantaneous values of CRFSW can reach stronger values than hourly values. The results obtained for CRFSW in this study were obtained for a region with a wide variety of SZA values (14–90°) and aerosol load with a high occurrence of desert dust intrusions from Northern Africa (Valenzuela et al., Citation2012). However, surface albedo did not exhibit great variations through the year; hence, other sites with surfaces covered by snow cover or high-latitude stations may present a stronger effect of clouds due to the increase in the multiple scattering between surface and cloud bases.
The instantaneous average values of the surface ARFSW shown in our study, −22 and −19 W m−2 at 30° and 60° of SZA, respectively, can be compared with the values under cloud-free conditions obtained by previous studies at similar SZAs. In this sense, Valenzuela et al. (Citation2012) analysed the aerosol forcing during desert dust intrusions at Granada obtaining average values between −35 and −50 W m−2 for 30°<SZA<60°. Meloni et al. (Citation2005) obtained values between −11 and −20 W m−2 depending on SZA and aerosol conditions at Lampedusa Island in the central Mediterranean Sea. The differences among the obtained values lie in the different aerosol optical and microphysical properties analysed in each study.
5.2. Role of the solar zenith angle on CRFSW, CARFSW and ARFSW
To analyse the role of the SZA on the variation of the cloud forcing values for different systems, shows the dependence of CRFSW, CARFSW and ARFSW on this variable. The CRFSW exhibited the strongest (more negative) values (around −80 W m−2) for small SZAs (15–30°). From these small SZA values, CRFSW decreased (in absolute value) as SZA increased, with minimum CRFSW values around −10 W m−2 for SZA of 80°. Additionally, it was seen that the curve for CARFSW followed a similar pattern, showing more negative radiative forcing for the whole SZA range. The CRFSW evolution shown in this study is in agreement with those presented by Shupe and Intrieri (Citation2004), although they studied the SZA dependence from 50 to 90°. Sedlar et al. (Citation2011) also reported similar CRFSW behaviour at a high-latitude sea ice drifting observatory for SZA>70°. As other authors found (e.g., Dong et al., Citation2006), the strongest (more negative) CRF occurs at the smallest SZAs. This behaviour can be expected since the maximum solar irradiance occurs at these angles and clouds block the direct component of the incident radiation. Hence, the effect at small SZAs was stronger in absolute value than at higher SZAs.
Fig. 2 Evolution of the average values for CRFSW (a, with triangles), CARFSW (a, with diamonds), ARFSW (a, with circles), NCRFSW (b, with triangles), NCARFSW (b, with diamonds), and NARFSW (b, with circles) as a function of solar zenith angle.
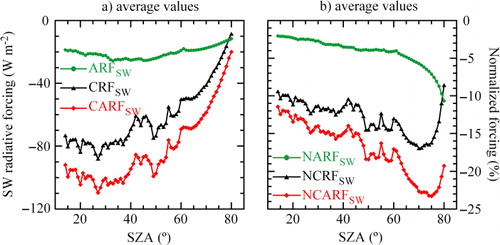
also shows the ARFSW slightly increased (in absolute value) from −20 W m−2 (SZA of 15°) to −26 W m−2 (SZA of 50°). Beyond this point, there was a reversal of this trend, reaching an ARFSW value of about −10 W m−2 for the largest SZA. At large SZA values (around 80°), ARFSW presented absolute values larger than CRFSW, which is corroborated in the normalised values. This result can be useful for sites experiencing large SZAs. To explain the evolution of ARFSW as a function of the SZA, the behaviour of the aerosol forcing under cloud-free conditions should be considered. Meloni et al. (Citation2005) showed that the aerosol forcing under these conditions presents a decreasing trend until 50°–70° of SZA. The angle of the maximum forcing decreases as the aerosol absorption increases (i.e., for decreasing single scattering albedo), and for increasing optical depth. Beyond this angle, the aerosol forcing decreases (in absolute value) because the atmosphere is optically thick. This behaviour was also obtained by other studies (e.g., Lyamani et al., Citation2006; Valenzuela et al., Citation2012).
Meloni et al. (Citation2005) also analysed the role of the aerosol load on the aerosol forcing dependence on SZA. They found that a large aerosol load produces a stronger SZA dependence due to the longer photon path length under these conditions. These phenomena can be extrapolated under cloudy conditions, because the cloud presence produces a longer optical path (see, e.g., Mateos et al., Citation2011), and therefore, the largest ARFSW occurred at 30°–50° of SZA, followed by a strong decrease in the ARFSW trend towards zero. From 40° to 80° of SZA, the ARFSW values underwent a decrease over 60%.
5.3. Role of the cloud cover on CRFSW
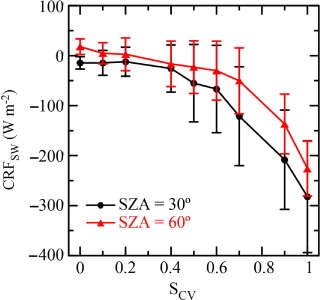
Different studies have evidenced the great influence of cloud cover on different spectral components of the solar irradiance over the study region (Alados et al., Citation1996, Citation2000; Alados-Arboledas et al., Citation2003; Foyo-Moreno et al., Citation2003; Esteve et al., Citation2010; Antón et al., Citation2011; Bilbao et al., Citation2011). Furthermore, previous studies (e.g., Dong et al., Citation2006; Berg et al., Citation2011) dealt with the dependence of cloud forcing on fractional sky cover (SCV). They found that these variables correlate by a non-linear function. In the database used in this study, we selected two SZAs (30° and 60°) to plot the CRFSW dependence on SCV. shows the results obtained by using average values at intervals of ±0.05 units centred in SCV=0 (cloud-free), 0.1, 0.2, …, 0.9 and 1.0 (overcast) (the first and last intervals are 0−0.05 and 0.95−1, respectively). In this study, we corroborated the non-linear relationship between CRFSW and SCV, that, is a result of the non-linear function linking solar irradiance and fractional cloud cover. As we know, the cloud influence on solar radiation varies throughout the solar spectrum (e.g., Alados-Arboledas et al., Citation2003; de Miguel et al., Citation2011). We carried out this analysis at two different SZAs and, as mentioned before, the CRFSW values were smaller for the larger SZA. In addition, at both angles CRFSW raised in magnitude with increasing SCV. For instance, at SZA=60°, CRFSW values changed from slightly positive values for SCV<0.2 to~−225 W m−2 at SCV=1; while at SZA=30°, CRFSW showed the maximum radiative effects at SCV=1 with ~ −300 W m−2.
Fig. 3 CRFSW as a function of SCV at 30° (line with circles) and 60° (line with triangles) of solar zenith angle. Vertical bars are the standard deviation of each interval (see text).
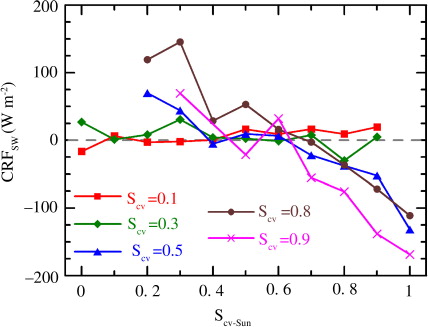
As noted by Berg et al. (Citation2011), the large scattering in each bin of SCV can be related to the variety of cloud properties (cloud optical thickness, microphysical properties, cloud geometric thickness, and morphology, among others) that affect SW radiation at the surface. To complete the analysis with respect to the fractional sky cover, we also tested the role of the fractional sky cover inside the octant where the Sun is placed on the cloud forcing behaviour. To this end, several values of the hemispheric SCV were fixed. shows the dependence of the CRFSW on the SCV-Sun at SZA=60° for each value of the hemispheric SCV. For small values of this variable (0.1–0.3 in this figure), no dependence on SCV-Sun was observed. This was probably due to the small fraction of cloud cover and the cloud position inside the Sun's octant. However, when the total cloud amount increased, positive CRFSW associated with enhancement effects appeared when SCV-Sun is 0.5 (or less). Particularly, a strong positive CRFSW is observed for SCV=0.8. Thus, these cloudy conditions were the most favourable for the reflection of SW radiation at the cloud edges or multi-reflections between the cloud base and surface, increasing the SW radiation levels at the surface compared with the equivalent cloud-free situation (e.g., Cede et al., Citation2002; Pfister et al., Citation2003). From SCV-Sun>0.7, CRFSWincreased its magnitude up to the case with the whole octant covered by clouds. For these cases, clouds blocked the direct component of SW radiation and produced a strong attenuation on the global radiation at the surface. All of the cases presenting SCV≥0.5 were selected to evaluate the percentage of probability of enhancement effect occurrence, which was defined in this study as those cases where CRFSW>100 W m−2. These cases were grouped into two sub-sets: SCV-Sun≤0.6 and SCV-Sun>0.6. As a result, >18% of the cases with SCV-Sun≤0.6 and SCV≥0.5 presented enhancement effect, while the percentage strongly decreased up to 3.4% for conditions of SCV-Sun>0.6 and SCV≥0.5. Therefore, a clear dependence of cloud forcing on SCV-Sun can be established because CRFSW values passed from positive to negatives values for large SCV.
Fig. 4 CRFSW as a function of SCV-Sun at SZA = 60°. Different symbols are the different values of the hemispheric SCV. The grey dotted line is the CRFSW=0 case.
5.4. Case study
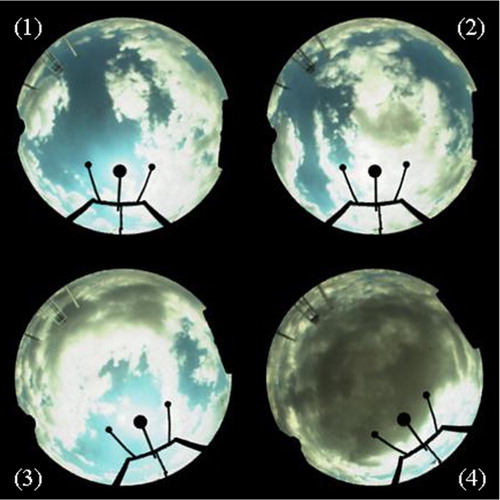
A case study with different cloudy conditions throughout a day is useful to better understand the evolution of cloud forcing under cloudy conditions. One of the most interesting radiative effects for cloud studies is the enhancement effect. Hence, to identity these enhancement cases, we used a similar methodology to those explained in detail by Antón et al. (Citation2012). On 3 April 2007, cloud-free conditions followed by cloudy periods and a small amount of aerosol load occurred. To minimise possible error sources in the cloud-free modelling for this case study (see Section 4), all cloud-free SW measurements (no more than 1 okta) recorded during the analysed day were considered to elaborate an exclusive cloud-free empirical model to estimate cloud-free SW data for the whole day. In this way, differences emerging from the variability of aerosol properties (optical thickness, single scattering albedo, and asymmetry factor, among others), precipitable water column, total ozone column and other gases in the atmosphere were almost negligible. shows the evolution of the SW radiation and the estimation under cloud-free conditions for the study day. As can be observed, there was an excellent agreement, as can be expected, between the empirical data derived from the model and the experimental data for cloud-free conditions. Although, it is also evident that the surface SW radiation presented values higher than the cloud-free estimations during some intervals due to enhancement effects. In particular, the period between 11-h and 15-h UTC presented different cloudy conditions. Hence, shows the evolution of CRFSW, SCV and SCV-Sun during this period. In <4 h, SCV values were >0.5 and SCV-Sun varied between 0 and 1. CRFSW showed a large variability during this period: maximum values around +200 W m−2 and minimum values around −600 W m−2. Therefore, enhancement and reduction effects in the levels of SW radiation at surface were detected. In , we marked some periods that correspond with the sky photos shown in . As can be observed, several enhancement effects were observed, some of them present for relatively long durations. For instance, during 8 minutes, we observed an enhancement over 100 W m−2 (with respect to the cloud-free case) between 13:01-h and 13:09-h UTC [position (3) in ]. The variability observed in CRFSW, with values above and below zero changing in short time periods, can be explained by the evolution in cloud cover (, middle and bottom panels). At the beginning of the period shown in , CRFSW presented positive values. These enhancement effects corresponded with values of intermediate SCV and an increasing SCV-Sun trend between 11-h and 12-h UTC. From 12:00-h to 13:00-h UTC, we observed broken cloud conditions [see the sky images in (1) and (2) in ] with fast changes between enhancement and reduction effects. When the SCV-Sun showed values close to one, the solar disk was obscured by clouds, and the levels of SW radiation decreased considerably (CRFSW<−400 W m−2). The strongest enhancement case occurred around 13:00 UTC, which presented a total cloud cover of ~6 oktas and a fractional sky cover in the Sun's octant of ~0.6 [see sky image in (3) in ]. These conditions corroborated the results obtained in the previous section () about the positive values of cloud forcing for intermediate hemispheric SCV and intermediate SCV-Sun cases. After the enhancement case, both SCV and SCV-Sun increased towards one (see sky image in (4) in ). From 14-h UTC, the cloud amount decreased and SCV-Sun again presented variability in the range 0.1–0.8, that is, enhancement and reductions in an alternative way.
Fig. 5 Evolution of SW radiation measurements and cloud-free estimations.
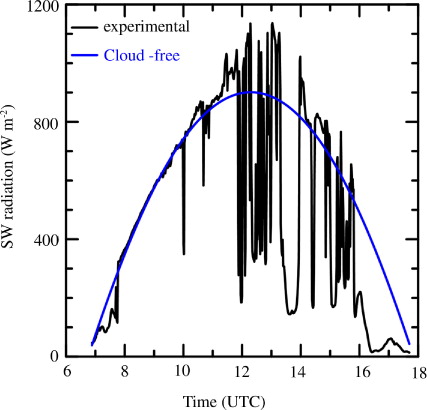
Fig. 6 Evolution of CRFSW, SCV and SCV-Sun for the case study analysed in this study on 3 April 2007. Vertical dashed lines point out four positions that correspond with the sky photo shown in . Horizontal dashed line in the upper panel points out CRFSW=0.
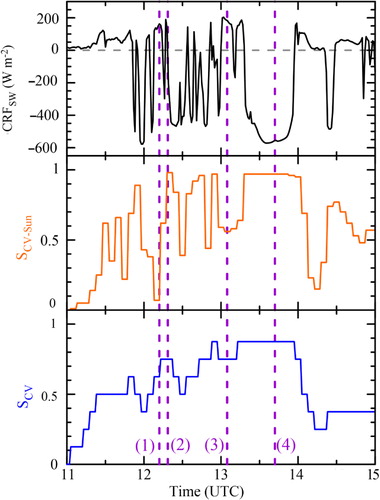
Fig. 7 Sky photo for the four positions highlighted in : (1) at 12:10 h, (2) at 12:20 h, (3) at 13:05 h and (4) at 13:40 h UTC on 3 April 2007.
6. Summary and conclusions
Experimental observations of SW radiation, AOD440 nm, and cloud properties are used to evaluate 1-min cloud forcing values in a ground-based station located in Granada (Spain) for six years (2006–2011). An empirical cloud-free model of SW radiation as a function of the aerosol load is proposed and validated, obtaining very good results. From this empirical model, the cloud forcing and the cloud–aerosol radiative forcing are evaluated. Additionally, the aerosol radiative forcing under cloudy conditions can be derived from the subtraction of these two variables. The average values for the database used in this study are, for example, CRFSW=−78 W m−2, CARFSW=−100 W m−2, and ARFSW=−22 W m−2 at SZA=30°, and CRFSW=−49 W m−2, CARFSW=−67 W m−2, and ARFSW=−19 W m−2 at SZA=60°. The percentage of each cloud forcing with respect to cloud-free conditions is around 10% for CRFSW and CARFSW, and <2% for ARFSW. The statistical analysis shows that the cloud forcing does not follow a symmetric distribution. CRFSW, CARFSW and ARFSW exhibit a clear dependence on SZA. These variables increase their value (in absolute magnitude) up to moderate angles. Beyond this point, the values tend towards zero with a very sharp evolution. Cloud forcing dominates, in general, over the aerosol impact. However, ARFSW is larger (in absolute term) than CRFSW at large SZA. In addition, cloud cover presents a strong influence on cloud forcing. As expected, the strongest cloud effect appears with high hemispherical fractional sky cover. Another interesting variable, which exhibits great influence on cloud forcing, is the amount of clouds inside the octant where the Sun is placed. We studied the influence that this variable presents for a fixed value of fractional sky cover. The results showed that SCV-Sun is a determinant when the fractional sky cover presents moderate or large values. Under these conditions, when the Sun's octant presents low values of cloud fraction, there is a high probability of enhancement case occurrence. However, when the SCV-Sun increases, the cloud forcing becomes negative. For instance, 18% of the cases showing SCV-Sun≤0.6 and SCV≥0.5 present CRFSW>100 W m−2. This percentage is only 3.4% for the cases of SCV-Sun>0.6 and SCV≥0.5. Finally, a case study with a high variability of cloudy conditions during four hours is also analysed. The evolution of the cloud fractions (hemispheric and in the Sun's octant) explains all of the variability in the cloud forcing values which pass from positive (~200 W m−2) to negative values (around −600 W m−2).
Acknowledgments
Manuel Antón thanks Ministerio de Ciencia e Innovación and Fondo Social Europeo for the award of a postdoctoral grant (Ramón y Cajal). This work was partially supported by the Andalusian Regional Government through projects P08-RNM-3568 and P10-RNM-6299, the MIECO through projects CGL2008-05939-C03-03/CLI, CGL2010-18782, CGL2011-29921-C02-01, CGL2011-16124-E, and CSD2007-00067, and by the European Union through ACTRIS project (EU INFRA-2010-1.1.16-262254).
Related Research Data
References
- Alados I , Foyo-Moreno I , Alados-Arboledas L . Photosynthetically active radiation: measurements and modelling. Agr. Forest Meteorol. 1996; 78: 121–131.
- Alados I , Olmo F. J , Foyo-Moreno I , Alados-Arboledas L . Estimation of photosynthetically active radiation under cloudy conditions. Agr. Forest Meteorol. 2000; 102: 39–50.
- Alados-Arboledas L , Alados I , Foyo-Moreno I , Olmo F. J , Alcántara A . The influence of clouds on surface UV erythemal irradiance. Atmos. Res. 2003; 66: 273–290.
- Alados-Arboledas L , Vida J , Olmo F. J . The estimation of thermal radiation under cloudy conditions. Int. J. Climatol. 1995; 15: 107–116.
- Allan R. P . Combining satellite data and models to estimate cloud radiative effect at the surface and in the atmosphere. Meterol. Appl. 2011; 18: 324–333.
- Andrews T , Forster P. M , Boucher O , Bellouin N , Jones A . Precipitation, radiative forcing and global temperature change. Geophys. Res. Lett. 2010; 37: 14701.
- Antón M , Gil J. E , Cazorla A , Fernández-Gálvez J , Foyo-Moreno I , co-authors. Short-term variability of experimental ultraviolet and total solar irradiance in Southeastern Spain. Atmos. Environ. 2011; 45: 4815–4821.
- Antón M , Piedehierro A. A , Alados-Arboledas L , Wolfran E , Olmo F. J . Extreme ultraviolet index due to broken clouds at a midlatitude site, Granada (southeastern Spain). Atmos. Res. 2012; 118: 10–14.
- Berg L. K , Kassianov E. I , Long C. N , Mills D. L. Jr . Surface summertime radiative forcing by shallow cumuli at the Atmospheric Radiation Measurement Southern Great Plains site. J. Geophys. Res. 2011; 116: 01202.
- Bilbao J , Mateos D , de Miguel A . Analysis and cloudiness influence on UV total irradiation. Int. J. Climatol. 2011; 31(3): 451–460.
- Cazorla A , Olmo F. J , Alados-Arboledas L . Development of a sky imager for cloud cover assessment. J. Opt. Soc. Am. A. Opt. Image Sci. Vis. 2008a; 25: 29–39.
- Cazorla A , Olmo F. J , Alados-Arboledas L . Using a sky imager for aerosol characterization. Atmos. Environ. 2008b; 42: 2739–2745.
- Cazorla A , Shields J. E , Karr M. E , Olmo F. J , Burden A , co-authors . Technical note: determination of aerosol optical properties by a calibrated sky imager. Atmos. Chem. Phys. 2009; 9: 6417–6427.
- Cede A , Blumthaler M , Luccini E , Piacentini R , Nuñez L . Effects of clouds on erythemal and total irradiance as derived from data of the Argentine network. Geophys. Res. Lett. 2002; 29(24): 2223. DOI: 10.1029/2002GL015708.
- Corti T , Peter T . A simple model for cloud radiative forcing. Atmos. Chem. Phys. 2009; 9: 5751–5758.
- De Miguel A , Román R , Bilbao J , Mateos D . Evolution of erythemal and total shortwave solar radiation in Valladolid, Spain: effects of atmospheric factors. J. Atmos. Sol-Terr. Phys. 2011; 73: 578–586.
- Denman K. L , Brasseur G , Chidthaisong A , Ciais P , Cox P. M , co-authors , Solomon S , Qin D , Manning M , Chen Z , Marquis M , co-authors . Couplings between changes in the climate system and biogeochemistry. Climate Change 2007: The Physical Science Basis. Contribution of Working Group I to the Fourth Assessment Report of the Intergovernmental Panel on Climate Change. 2007; Cambridge University Press, Cambridge, UK, New York.
- Di Biagio C , di Sarra A , Eriksen P , Ascanius S. E , Muscari G , co-authors . Effect of surface albedo, water vapour, and atmospheric aerosols on the cloud-free shortwave radiative budget in the Arctic. Clim. Dyn. 2012; 39: 953–969.
- Dong X , Xi B , Minnis P . A Climatology of Midlatitude Continental Clouds from the ARM SGP Central Facility. Part II: cloud fraction and surface radiative forcing. J. Clim. 2006; 19: 1765–1782.
- Dubovik O , King M. D . A flexible inversion algorithm for retrieval of aerosol optical properties from Sun and sky radiance measurements. J. Geophys. Res. 2000; 105: 20673–20696.
- Ebell K , Crewell S , Löhnert U , Turner D. D , O'Connor E. J . Cloud statistics and cloud radiative effect for a low-mountain site. Q. J. Roy. Meteorol. Soc. 2011; 137: 306–324.
- Eck T. F , Holben B. N , Reid J. S , Dubovik O , Smirnov A , co-authors . Wavelength dependence of the optical depth of biomass burning, urban, and desert dust aerosol. J. Geophys. Res. 1999; 104: 31333–31349.
- Erlick C , Frederick J. E , Saxena V. K , Wenny B. N . Atmospheric transmission in the ultraviolet and visible: aerosols in cloudy atmospheres. J. Geophys. Res. 1998; 103(D24) : 31541–31556.
- Erlick C , Ramaswamy V . Note on the definition of clear sky in calculations of shortwave cloud forcing. J. Geophys. Res. 2003; 108(D5): 4156.
- Esteve A. R , Marin M. J , Tena F , Utrillas M. P , Martínez-Lozano J. A . Influence of cloudiness over the values of erythemal radiation in Valencia, Spain. Int. J. Climatol. 2010; 30: 127–136.
- Foyo-Moreno I , Alados I , Olmo F. J , Alados-Arboledas L . The influence of cloudiness on UV global irradiance (295–385 nm). Agr. Forest Meteorol. 2003; 120(1): 101–111.
- Gautier C , Landsfeld M . Surface solar radiation flux and cloud radiative forcing for the Atmospheric Radiation Measurement (ARM) Southern Great Plains (SGP): a satellite, surface observations, and radiative transfer model study. J. Atmos. Sci. 1997; 54(10): 1289–1307.
- Hanschmann T , Roebeling R , Macke A . Evaluation of the shortwave cloud radiative effect over the ocean by use of ship and satellite observations. Atmos. Chem. Phys. 2012; 12: 12243–12253.
- Holben B. N , Eck T. F , Slutsker I , Tanré D , Buis J. P , co-authors . AERONET – a federated instrument network and data archive for aerosol characterization. Rem. Sens. Environ. 1998; 66: 1–16.
- Intrieri J. M , Fairall C. W , Shupe M. D , Persson P. O. G , Andreas E. L , co-authors . An annual cycle of Arctic surface cloud forcing at SHEBA. J. Geophys. Res. 2002; 107(C10): 8039.
- Kim D , Ramanathan V . Solar radiation budget and radiative forcing due to aerosols and clouds. J. Geophys. Res. 2008; 113: 02203.
- Kratzenberg M. G , Beyer H. G , Colle S , Albertazzi A . Uncertainty calculations in pyranometer measurements and application, ASME 2006 International Solar Energy Conference (ISEC2006), July 2006, Denver, Colorado, USA, paper number ISEC2006-99168. 2006; 689–698. Online at: http://dx.doi.org/10.1115/ISEC2006-99168 .
- Lyamani H , Olmo F. J , Alcántara A , Alados-Arboledas L . Atmospheric aerosols during the 2003 heat wave in southeastern Spain II: microphysical columnar properties and radiative forcing. Atmos. Environ. 2006; 40: 6465–6476.
- Mace G. G , Benson S , Kato S . Cloud radiative forcing at the Atmospheric Radiation Measurement Program Climate Research Facility: 2. Vertical redistribution of radiant energy by clouds. J. Geophys. Res. 2006; 111: 11S91.
- Mateos D , de Miguel A , Bilbao J . Empirical models of UV total radiation and cloud effect study. Int. J. Climatol. 2010; 30: 1407–1415.
- Mateos D , di Sarra A , Meloni D , Di Biagio C , Sferlazzo D. M . Experimental determination of cloud influence on the spectral UV radiation and implications for biological effects. J. Atmos. Sol-Terr. Phys. 2011; 73: 1739–1746.
- Mayer B , Kylling A . Technical note: The libRadtran software package for radiative transfer calculations – description and examples of use. Atmos. Chem. Phys. 2005; 5: 1855–1877.
- Meloni D , di Sarra A , Di Iorio T , Fiocco G . Influence of the vertical profile of Saharan dust on the visible direct radiative forcing. J. Quant. Spectrosc. Radiat. Transfer. 2005; 93: 397–413.
- Olmo F. J , Cazorla A , Alados-Arboledas L , López-Álvarez M. A , Hernández-Andrés J , co-authors . Retrieval of the optical depth suing an all-sky CCD camera. Appl. Optics. 2008; 47(34): H182–H189.
- Pfister G , Mckenzie R. L , Liley J. B , Thomas A . Cloud coverage based on all-sky imaging and its impact on surface solar irradiance. J. Appl. Meteorol. 2003; 42: 1421–1434.
- Ramanathan V , Cess R. D , Harrison E. F , Minnis P , Barkstrom B. R , co-authors . Cloud-radiative forcing and climate: results from the earth radiation budget experiment. Science. 1989; 243(4887): 57–63.
- Ricchiazzi P , Yang S , Gautier C , Sowle D . SBDART: a research and teaching software tool for plane-parallel radiative transfer in the Earth's atmosphere. Bull. Am. Meteorol. Soc. 1998; 79: 2101–2114.
- Sedlar J , Tjernström M , Mauritsen T , Shupe M. D , Brooks I. M , co-authors . A transitioning Arctic surface energy budget: the impacts of solar zenith angle, surface albedo and cloud radiative forcing. Clim. Dyn. 2011; 37: 1643–1660.
- Sengupta M , Clothianux E. E , Ackerman T . Climatology of warm boundary layer clouds at the ARM SGP Site and their comparison to models. J. Clim. 2004; 17: 4760–4782.
- Shupe M. D , Intrieri J. M . Cloud radiative forcing of the Artic surface: the influence of cloud properties, surface albedo, and solar Zenith angle. J. Clim. 2004; 17: 616–628.
- Strahler A. H , Lucht W , Schaaf C. B , Tsang T , Gao F , co-authors . MODIS BRDF/albedo product: algorithm theoretical basis documentation. NASA EOS-MODIS Doc. 1999. V5.0, 53, NASA.
- Su J , Huang J , Fu Q , Minnis P , Ge J , co-authors . Estimation of Asian dust aerosol effect on cloud radiation forcing using Fu-Liou radiative model and CERES measurements. Atmos. Chem. Phys. 2008; 8: 2763–2771.
- Taylor J. P , Glew M , Coakley J. A , Tahnk W. R , Platnick S , co-authors . Effects of aerosols on the radiative properties of clouds. J. Atmos. Sci. 2000; 57: 2656–2670.
- Taylor P. C . Tropical outgoing longwave radiation and longwave cloud forcing diurnal cycles from CERES. J. Atmos. Sci. 2012; 69: 3652–3669.
- Valenzuela A , Olmo F. J , Lyamani H , Antón M , Quirantes A , co-authors . Aerosol radiative forcing during African desert dust events (2005–2010) over Southeastern Spain. Atmos. Chem. Phys. 2012; 12: 10331–10351.
- Wacker S , Gröbner J , Nowak D , Vuilleumier L , Kämpfer N . Cloud effect of persistent stratus nebulosus at the Payerne BSRN site. Atmos. Res. 2011; 102: 1–9.