
Abstract
Recent evidence suggests that autophagy may favor fibrosis through enhanced differentiation of fibroblasts in myofibroblasts. Here, we sought to characterize the mediators and signaling pathways implicated in autophagy-induced myofibroblast differentiation. Fibroblasts, serum starved for up to 4 d, showed increased LC3-II/-I ratios and decreased SQSTM1/p62 levels. Autophagy was associated with acquisition of markers of myofibroblast differentiation including increased protein levels of ACTA2/αSMA (actin, α 2, smooth muscle, aorta), enhanced gene and protein levels of COL1A1 (collagen, type I, α 1) and COL3A1, and the formation of stress fibers. Inhibiting autophagy with 3 different class I phosphoinositide 3-kinase and class III phosphatidylinositol 3-kinase (PtdIns3K) inhibitors or through ATG7 silencing prevented myofibroblast differentiation. Autophagic fibroblasts showed increased expression and secretion of CTGF (connective tissue growth factor), and CTGF silencing prevented myofibroblast differentiation. Phosphorylation of the MTORC1 target RPS6KB1/p70S6K kinase was abolished in starved fibroblasts. Phosphorylation of AKT at Ser473, a MTORC2 target, was reduced after initiation of starvation but was followed by spontaneous rephosphorylation after 2 d of starvation, suggesting the reactivation of MTORC2 with sustained autophagy. Inhibiting MTORC2 activation with long-term exposure to rapamycin or by silencing RICTOR, a central component of the MTORC2 complex abolished AKT rephosphorylation. Both RICTOR silencing and rapamycin treatment prevented CTGF and ACTA2 upregulation, demonstrating the central role of MTORC2 activation in CTGF induction and myofibroblast differentiation. Finally, inhibition of autophagy with PtdIns3K inhibitors or ATG7 silencing blocked AKT rephosphorylation. Collectively, these results identify autophagy as a novel activator of MTORC2 signaling leading to CTGF induction and myofibroblast differentiation.
Abbreviations:
- 3-MA, 3-methyladenine
- ACTA2, actin, α 2, smooth muscle, aorta
- Ctl, control
- DAPI, 4′, 6-diamidino-2-phenylindole
- ECM, extracellular matrix
- FBS, fetal bovine serum
- GF, growth factor
- iso, isotype control
- LC3B, MAP1LC3B (microtubule-associated protein 1 light chain 3 β)
- LY, LY294002
- N, normal growth medium
- R, rapamycin
- SS, serum-free (starvation) medium
- T, TGFB1 (transforming growth factor, β 1)
- TUBA, tubulin, α
- V, vehicle
- W, wortmannin
- WB, western blotting
Introduction
In most, if not all, organs, tissue repair follows a stereotypical sequence of events that includes the differentiation of resident fibroblasts and stromal cells into myofibroblasts. In turn, differentiated myofibroblasts produce increased amounts of extracellular matrix (ECM) components such as COL1A1 and COL3A1 and acquire a contractile phenotype through enhanced expression of ACTA2 and formation of stress fibers.Citation1-3 Myofibroblasts are key effectors of tissue repair and, under the influence of appropriate extracellular signals, favor tissue remodeling and wound closure. In fibrotic disorders, persistent myofibroblast accumulation fuels inappropriate ECM deposition, contracture, tissue deformation, and loss of function.Citation3-5 TGFB (transforming growth factor, β) is one of the first mediators shown to mediate both initiation and perpetuation of myofibroblast differentiation.Citation3,6 TGFB gene and protein expression are increased in an array of fibrotic disorders including pulmonary fibrosis, liver cirrhosis, chronic renal failure, and systemic sclerosis.Citation7-10 In the past decade, a large body of evidence has demonstrated that CTGF/CCN2, is another central mediator of myofibroblast differentiation and fibrosis. CTGF expression is activated downstream of TGFB-dependent SMAD signaling and various reports point to CTGF as a key activator of myofibroblast differentiation.Citation11 Also, the secretion of CTGF enhances TGFB signaling through increased receptor and cell-surface binding and SMAD phosphorylation favoring an autocrine fibrogenic amplification loop.Citation12 Increased expression of CTGF has also been reported in a wide variety of fibrotic conditions including liver, renal and pulmonary fibrosis, and systemic sclerosis.Citation13-18 More recently, different reports have shown that, in certain systems, CTGF can induce and sustain myofibroblast differentiation and development of fibrosis through TGFB-independent pathways.Citation19,20 The pathways that foster CTGF overexpression independently of TGFB-signaling remain incompletely characterized but appear to involve, at least in part, responses to stress and hypoxia.Citation19-22
Autophagy is a highly conserved catabolic pathway activated in response to stress or starvation. During autophagy, damaged organelles and selected proteins are sequestered within autophagosomes and targeted for degradation following autophagosome-lysosome fusion as a means of sustaining metabolism. Autophagy is initiated by MTORC1 inhibition, which facilitates activation of the PIK3C3/VPS34-PIK3R4-AMBRA1 complex required for initiation of autophagosome formation.Citation23 Recent studies have highlighted a correlation between dysregulated autophagy and the development of fibrosis.Citation24 Both up- and downregulation of autophagy have been associated with fibrosis in various organs, highlighting the potentially diverse functional role that autophagy may play in the various phases of response to stress and tissue repair.Citation24 In models of liver fibrosis, reduced autophagy was shown to prevent differentiation of hepatic stellate cells into myofibroblast-like cells, therefore leading to reduced fibrogenesis.Citation25,26 Fibrogenic cells of kidney and lung origin have also been shown to rely on autophagy to maintain an activated and fibrogenic phenotype.Citation26 However, the signaling pathways and central mediators linking autophagy to myofibroblast differentiation and fibrosis remain largely undefined. Whether autophagy leads to fibrosis or prevents the onset of fibrosis is probably, at least in part, related to the cell compartments that are engaging the autophagic response and the downstream signaling pathways that may be triggered by the autophagic program.
Here, we sought to characterize the impact of autophagy on myofibroblast differentiation. We report that, in fibroblasts, prolonged autophagy is associated with inhibition of MTORC1 activation and, unexpectedly, enhanced MTORC2 activation, which in turn triggers CTGF-dependent myofibroblast differentiation.
Results
Autophagy is central to myofibroblast differentiation induced by prolonged starvation
To evaluate the functional importance of growth factor deprivation in the simultaneous activation of autophagy and myofibroblast differentiation, human embryonic lung fibroblasts were exposed to serum-free (starvation) medium (SS). LC3-II/-I ratios increased rapidly in starved fibroblasts () and were further increased in the presence of bafilomycin A1, an inhibitor of vacuolar-type H+-ATPases essential for the acidification of autophagic vacuoles (). Infection with a baculovirus vector expressing GFP-LC3B revealed enhanced accumulation of LC3+ puncta in starved fibroblasts, which was further increased by bafilomycin A1 (). Protein levels of SQSTM1, an autophagic substrate, decreased after 4 h of starvation and remained low thereafter (). Markers of autophagy in starved cells were increased compared with cells maintained in normal culture conditions for up to 7 d (Fig. S1A, S1B). Collectively, these results suggest a sustained enhanced autophagic flux in serum-starved fibroblasts.Citation27
Figure 1. (See previous page). Starvation induces autophagy and myofibroblast differentiation. (A) Upper panel: Western blot showing LC3B-I and -II protein levels in WI-38 fibroblasts exposed to serum-free (starvation) medium (SS). Lower panel: Densitometric analysis of LC3B-II relative to LC3B-I normalized to time 0 (representative of 4 independent experiments, *P < 0.05 t = 0 vs 1 h). (B) Western blot showing LC3B-I and -II protein levels in WI-38 fibroblasts at baseline, starved for 4 h or 1 d and exposed to DMSO (V) or bafilomycin A1 (20 nM; Baf). Representative of 3 independent experiments. (C) Evaluation of LC3B puncta by confocal microscopy in WI-38 fibroblasts infected with a baculovirus vector expressing GFP-LC3B and exposed to normal conditions (medium with 10% FBS; N), serum-free medium with DMSO (V) or serum-free medium with bafilomycin A1 (20 nM) for 1 d. Representative of 3 independent experiments. (D) Upper panel: Western blot showing SQSTM1 and tubulin (TUBA) protein levels in starved WI-38 fibroblasts. Lower panel: Densitometric analysis of SQSTM1 protein levels relative to tubulin. Data are presented as mean ± s.e.m. (representative of 4 independent experiments, *p = 0.02 4 h vs 2 d and 4 h vs 4 d). (E) Upper panel: Western blot showing ACTA2 protein levels in WI-38 fibroblasts exposed to SS medium or grown under normal conditions (N). Tubulin was used as a loading control. Lower panel: Densitometric analysis of ACTA2 protein levels relative to tubulin normalized to time 0 (representative of 4 independent experiments; *p = 0.0170 SS vs N at 4 d). (F) Evaluation of the myofibroblast markers ACTA2 (red) and stress fiber (green) by immunofluorescence microscopy in cells grown in normal medium (N) or maintained without serum (SS) for 4 d. Representative of 3 independent experiments. (G) Real-time qPCR evaluation of mRNA levels of COL1A1 and COL3A1 after 4 d in N or SS. GAPDH was used as the reference gene (***P < 0.001 N vs SS, representative of 2 independent experiments performed in triplicate).
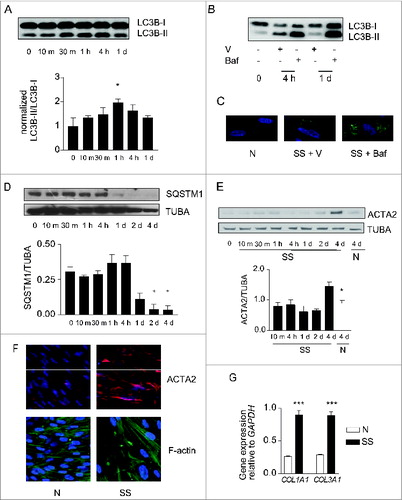
We then evaluated whether markers of myofibroblast differentiationCitation3 were modulated in association with autophagy. Protein levels of ACTA2 increased significantly after 4 d of serum starvation (). After 4 d, serum-starved fibroblasts also showed enhanced ACTA2 protein levels and the presence of organized stress fibers by immunofluorescence microscopy (). COL1A1 and COL3A1 mRNA levels () and proCOL1A1 protein levels (Fig. S1C) also increased in starved fibroblasts. Similarly, in mouse embryonic fibroblasts and adult human lung fibroblasts, we found an association between increased autophagy upon long-term serum starvation and evidence of myofibroblast differentiation (Fig. S1D). Fibroblasts maintained in normal culture conditions for up to 7 d did not show evidence of myofibroblast differentiation (Fig. S1B).
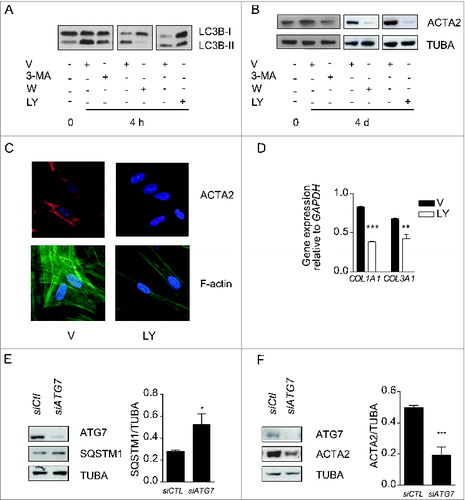
To analyze the functional role of autophagy in myofibroblast differentiation, we inhibited the autophagic response in starved fibroblasts with 3-methyladenine (3-MA), wortmanmin (W) or LY294002 (LY).Citation28 In starved cells these chemicals inhibit PtdIns3K.Citation28-30 All 3 inhibitors prevented enhanced LC3-II/-I ratios upon starvation () and also prevented upregulation of ACTA2 ( and S2A, S2B) and pro-COL1A1 (Fig. S2C). Autophagy inhibition also prevented the formation of stress fibers and reduced collagen mRNA synthesis (). Inhibiting autophagy through silencing of the key autophagic gene ATG7Citation31 prevented myofibroblast differentiation () further supporting the central role of autophagy in triggering pathways leading to myofibroblast differentiation. We also considered the potential role of cell death in our system. In previous work, we showed that WI-38 fibroblasts serum starved for up to 7 d maintained low levels of apoptosis and no sign of necrosis.Citation32,33 Also, PARP cleavage, another read-out of apoptotic cell death, is not enhanced in fibroblasts serum starved for 4 or 7 d (Fig. S2D). Collectively, these results suggest that cell death-dependent pathways are unlikely contributors to the association between autophagy and myofibroblast differentiation.
Figure 2. Autophagy induces myofibroblast differentiation in starved fibroblasts. (A) Western blot showing LC3B-I and -II protein levels in WI-38 fibroblasts at baseline or starved in the presence of 3-methyladenine (1 mM; 3-MA), wortmannin (100 nM; W), LY294002 (5 μM; LY) or vehicle (V) for 4 h. Representative of 4 independent experiments. (B) Western blot showing ACTA2 protein levels in WI-38 fibroblasts at baseline or starved and incubated with the same inhibitors as in A for 4 d. Representative of 4 independent experiments. (C) Evaluation of the myofibroblast markers ACTA2 (red) and stress fiber formation (green) by immunofluorescence microscopy in fibroblasts exposed to SS in the presence of LY or V for 4 d. Cell nuclei are visualized in blue. ACTA2 and stress fiber staining of fibroblasts grown in normal medium or starved for 4 d from the same experiment are shown in . Representative of 3 independent experiments. (D) COL1A1 and COL3A1 mRNA levels evaluated by real time qPCR in WI-38 fibroblasts serum starved for 4 d in the presence of the PtdIns3K inhibitor LY or vehicle. GAPDH was used as the reference gene (***P < 0.001 V vs LY for COL1A1 and **P < 0.01 V vs LY for COL3A1). Collagen mRNA levels of fibroblasts grown in normal medium or starved for 4 d from the same experiment are shown in . Representative of 2 independent experiments performed in triplicate. (E) Left panel: Western blot showing ATG7, SQSTM1 and tubulin (TUBA) protein levels in WI-38 fibroblasts starved for 2 d post-nucleofection with control siRNA (siCTL) or ATG7 siRNA (siATG7). Representative of 3 independent experiments. Right panel: Densitometric analysis of SQSTM1 protein level relative to tubulin (representative of 3 independent experiments, *p = 0.0318) in WI-38 fibroblasts silenced for ATG7 expression (ATG7 silencing is effective at 80.6% ± 6.0%, representative of 3 independent experiments, ***P < 0.0001). (F) Left panel: Western blot showing ATG7, ACTA2, and tubulin (TUBA) protein levels in WI-38 fibroblasts starved for 4 d post-nucleofection with control siRNA (siCTL) or ATG7 siRNA (siATG7). Representative of 4 independent experiments. Right panel: Densitometric analysis of ACTA2 level relative to tubulin (***p = 0.0005 representative of 4 independent experiments) in WI-38 fibroblasts silenced for ATG7 expression (ATG7 silencing is effective at 87.4% ± 4.4%, from 4 independent experiments, ***P < 0.0001).
TGFB-independent and CTGF-dependent pathways control autophagy-induced myofibroblast differentiation
We then sought to characterize the mediators implicated in autophagy-induced myofibroblast differentiation. TGFB is a classical inducer of myofibroblast differentiation,Citation6 and fibrogenic signaling downstream of TGFB involves the SMAD family of transcriptional activators.Citation34 To determine if TGFB signaling is implicated in autophagy-induced myofibroblast differentiation, SMAD2 phosphorylation was evaluated by immunoblotting in serum-starved fibroblasts. Serum starvation failed to induce SMAD2 phosphorylation, whereas exposure to recombinant TGFB1 induced strong SMAD2 phosphorylation ( and S3A). Since TGFB can trigger fibrogenic signals through noncanonical SMAD-independent pathways,Citation6 we also evaluated ACTA2 protein levels in serum-starved fibroblasts in the presence of antibodies neutralizing all TGFB1, 2 and 3 isoforms or isotype-matched control. Recombinant TGFB1 was used as a positive control for the neutralizing capacity of the anti-TGFB antibody. Anti-TGFB neutralization failed to reduce myofibroblast differentiation in starved fibroblasts ( lane 2) but effectively dampened ACTA2 overexpression induced by recombinant TGFB1 ( lane 5). Collectively, these results suggest that autophagy elicits myofibroblast differentiation largely through TGFB-independent pathways.
Figure 3. (See previous page). Myofibroblast differentiation induced by starvation is dependent on CTGF upregulation. (A) Western blot showing phosphorylated SMAD2 and total SMAD2/3 in WI-38 fibroblasts cultured under normal conditions (N), serum starved (SS) or incubated with human recombinant TGFB1 (2 ng/ml) in SS for 1 or 3 d. Incubation with TGFB1 was used as a positive control for SMAD signaling. Representative of 3 independent experiments. (B) Upper panel: Western blot showing ACTA2 protein levels in WI-38 fibroblasts exposed to SS for 4 d in the presence of a neutralizing antibody (NAb) against pan-TGFB, or isotype-matched control (iso), both at 10 ug/ml. Recombinant human TGFB1 (0.1 ng/ml) was used as a positive control for the neutralizing activity of the pan-TGFB antibody. Representative of 4 independent experiments. Lower panel: Densitometric analysis of ACTA2 relative to tubulin (TUBA) protein levels (representative of 4 independent experiments, *p = 0.03 neutralizing antibody vs iso in the presence of TGFB1, *p = 0.03 SS vs TGFB1 in SS). (C) Evaluation of CTGF expression by real time qPCR in WI-38 fibroblasts exposed to serum-free medium (SS) or grown in normal condition (N) for 4 d (**p = 0.002). Representative of 2 independent experiments performed in triplicate. (D) Upper panel: Western blot showing intracellular CTGF protein levels in WI-38 fibroblasts at baseline, starved for up to 4 d or maintained in normal medium for 4 d. Representative of 8 independent experiments. Lower panel: Densitometric analysis of intracellular CTGF relative to tubulin protein levels normalized to time 0 (representative of 8 independent experiments, *p = 0.01 1d vs 4 d and 2 d vs 4 d in SS). (E) Upper panel: Evaluation of extracellular CTGF by WB in media conditioned by WI-38 fibroblasts exposed to SS for 0, 2 or 4 d. Representative of 8 independent experiments. Lower panel: Densitometric analysis of extracellular CTGF (representative of 8 independent experiments, *p = 0.01 2 d vs 4 d). (F) Upper panel: Western blot showing intracellular CTGF and ACTA2 protein levels in WI-38 fibroblasts exposed to SS for 5 d post-transfection with control siRNA (siCTL) or siRNA specific to CTGF (siCTGF). Representative of 5 independent experiments. Lower panel: Densitometric analysis of ACTA2 level relative to tubulin (representative of 5 independent experiments, **p = 0.004) in WI-38 fibroblasts silenced for CTGF expression (CTGF silencing is effective at 77.3% ± 4.8%, representative of 5 independent experiments, ***p = 0.0002).
CTGF is increasingly recognized as a downstream integrator of various fibrogenic stimuli and a specific marker of fibrotic tissues.Citation35,36 Hence, we evaluated if starvation modulates CTGF mRNA and protein levels. Prolonged starvation led to a significant increase in CTGF mRNA level (). There was an initial decrease in cellular CTGF protein levels upon initiation of starvation. This was followed, after 2 and 4 d of starvation, with a progressive increase in CTGF levels ( and S3B). Also, extracellular release of CTGF rose over time in serum-starved fibroblasts (). We then investigated the functional importance of CTGF in starvation-induced myofibroblast differentiation. Blocking CTGF upregulation with siRNAs significantly lowered ACTA2 protein levels in autophagic fibroblasts (), establishing a central role for CTGF in myofibroblast-differentiation triggered by starvation.
To test whether autophagy is an upstream regulator of CTGF expression in starved cells, we inhibited autophagy with PtdIns3K inhibitors and evaluated intracellular and extracellular CTGF protein levels. LY294002 (), 3-MA and wortmannin (Fig. S4) all prevented upregulation of intracellular CTGF protein levels in fibroblasts serum starved for 4 d. CTGF secretion () and CTGF mRNA levels () were also significantly reduced in fibroblasts serum starved in the presence of LY294002. To further characterize the importance of the autophagic process in regulating CTGF levels, we inhibited autophagy through ATG7 silencing. Again, inhibition of autophagy prevented CTGF upregulation (). Collectively, these results confirm that autophagy is an upstream regulator of CTGF expression.
Figure 4. Autophagy is central for CTGF upregulation in starved fibroblasts. (A) Upper panel: Western blot showing intracellular CTGF protein levels in serum-starved WI-38 fibroblasts incubated with the autophagy inhibitor LY294002 5 uM (LY) or vehicle (V) for 4 d. Representative of 4 independent experiments. Lower panel: Densitometric analysis of intracellular CTGF protein levels relative to tubulin (representative of 4 independent experiments, *p = 0.0286). (B) Upper panel: Western blot of extracellular CTGF protein levels in media conditioned by starved WI-38 fibroblasts in the presence of the inhibitor LY294002 5 uM (LY) or vehicle (V) for 4 d. Representative of 4 independent experiments. Lower panel: Densitometric analysis of extracellular CTGF protein levels (representative of 4 independent experiments, *p = 0.03 V vs LY at 4 d). (C) Evaluation of CTGF expression by qPCR in WI-38 fibroblasts exposed to serum-free medium (SS) in the presence of LY294002 5 uM (LY) or vehicle (V) for 4 d (**p = 0.0036). CTGF expression was normalized to GAPDH. CTGF mRNA levels of fibroblasts grown in normal medium or starved for 4 d from the same experiment are shown in . Representative of 2 independent experiments performed in triplicate. (D) Left panel: Western blot showing ATG7, CTGF and tubulin (TUBA) protein levels in WI-38 fibroblasts exposed to SS for 4 d post-nucleofection with control siRNA (siCTL) or siRNA specific to ATG7 (siATG7). Representative of 4 independent experiments. Right panel: Densitometric analysis of CTGF level relative to tubulin (**p = 0.0087 representative of 4 independent experiments) in WI-38 fibroblasts silenced for ATG7 expression (ATG7 silencing is effective at 87.4% ± 4.4%, representative of 4 independent experiments, *** P < 0.0001).
Implication of the MTORC1 and MTORC2 pathways in autophagy-induced myofibroblast differentiation
Inhibition of MTOR signaling prevents myofibroblast differentiation in other systems.Citation37 We therefore considered the possibility that MTOR-dependent pathways could be implicated in autophagy-induced myofibroblast differentiation. Phosphorylation of the MTORC1 downstream target RPS6KB1Citation38 was rapidly and durably decreased in serum-starved fibroblasts ( and S5A). Phorphorylation of the MTORC2 target AKT at Ser473Citation39 initially decreased upon initiation of serum starvation (). However, after 2 d of serum starvation, AKT was progressively rephosphorylated at Ser473 (), suggesting the reactivation of MTORC2 with prolonged starvation.
Figure 5. Activation of MTORC2 signaling in starved fibroblasts. (A) Upper panel: Western blot showing phosphorylation of AKT Ser473 (AKT p) and total AKT (AKT t) in WI-38 fibroblasts at baseline and exposed to serum-free medium (SS) for up to 4 d. Representative of 5 independent experiments. Lower panel: Densitometric analysis of AKT p relative to AKT t normalized to time 0 (representative of 5 independent experiments, *p = 0.0189 2 d vs 4 d and *p = 0.0238 1d vs 4 d). (B) Upper panel: Western blot showing phosphorylation of RPS6KB1 (MTORC1 downstream target) and phosphorylation of AKT Ser473 (MTORC2 target) in WI-38 fibroblasts at baseline and starved (SS) for up to 4 d in the presence of rapamycin (10 nM; R) or vehicle (V). Total AKT level was also evaluated by WB. Ponceau Red staining was used as loading control. Representative of 4 independent experiments. Middle panel: Densitometric analysis of phosphorylated RPS6KB1 relative to tubulin (representative of 4 independent experiments, *p = 0.0286 V vs R at 10 min). Data were normalized to baseline. Lower panel: Densitometric analysis of AKT p relative to AKT t (representative of 4 independent experiments, *p = 0.0237 V vs R at d 4). Data were normalized to baseline. (C) Upper panel: Western blot showing LC3B-I and -II protein levels in WI-38 fibroblasts at baseline or exposed to SS for 4 h, 2 d or 4 d in the presence of rapamycin (10 nM; R) or vehicle (V). Representative of 5 independent experiments. Lower panel: Densitometric analysis of LC3B-II relative to LC3B-I (representative of 5 independent experiments; *p = 0.0456 V vs R at 4 h, *p = 0.0444 V vs R at 2 d, *p = 0.0266 V vs R at 4 d).
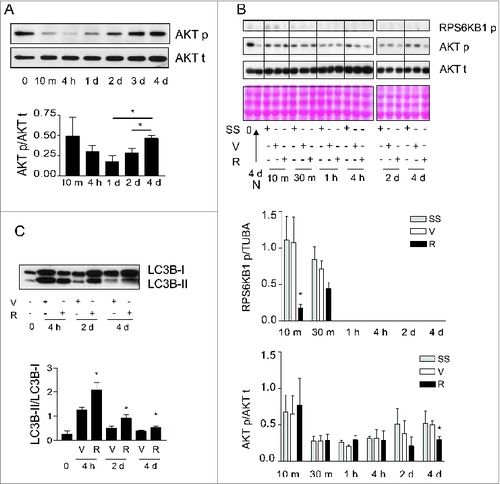
We then evaluated the impact of rapamycin on phosphorylation of MTORC1 and MTORC2 targets, autophagy, and myofibroblast differentiation. Rapamycin induces autophagy by interacting with FKBP12 leading to MTORC1 inhibitionCitation38 whereas long-term exposures to rapamycin can, in certain circumstances, inhibit MTORC2 by preventing formation of new MTORC2 complexes.Citation39,40 In starved and unstarved fibroblasts, rapamycin decreased RPS6KB1 phosphorylation confirming its MTORC1 inhibitory activity ( and S5B) and enhanced autophagy with increased LC3-II/-I ratios or decreased SQSTM1 protein levels ( and S5B). Rapamycin also significantly decreased AKT rephosphorylation at Ser473 in fibroblasts that were serum starved for longer than 2 d () whereas, in unstarved fibroblasts, rapamycin did not reduce and rather enhanced MTORC2 activity, as demonstrated with increased AKT phosphorylation (Fig. S5B). This translated into enhanced myofibroblast differentiation with increased expression of CTGF and ACTA2 (Fig. S5B). This result is consistent with previous reports showing that rapamycin preferentially inhibits MTORC1 vs MTORC2 and that MTORC1 blockade can release MTORC1-dependent inhibition of MTORC2.Citation39,41 However, in starved cells, rapamycin decreased MTORC2 activity leading to inhibition of myofibroblast differentiation. Rapamycin prevented the upregulation of both ACTA2 and intracellular CTGF protein levels in serum-starved fibroblasts () and also significantly reduced CTGF secretion (). Serum-starved fibroblasts exposed to rapamycin also showed reduced COL1A1 mRNA level () and proCOL1A1 protein level (Fig. S6A). We also exposed starved cells to Torin 1, a dual inhibitor of the MTOR complexes. Torin 1 inhibited MTORC1 and MTORC2 activities, reduced CTGF secretion and ACTA2 and proCOL1A1 synthesis (Fig. S6B, S6C, S6D). Collectively, these results suggest that MTORC2 activity is likely central for autophagy-induced myofibroblast differentiation.
Figure 6. Blockade of autophagy-induced myofibroblast differentiation by rapamycin. (A) Upper panel: Western blot showing ACTA2 and intracellular CTGF protein levels in serum-starved WI-38 fibroblasts incubated with the MTOR inhibitor rapamycin (10 nM; R) or vehicle (V) for 4 d. Representative of 5 independent experiments. Middle panel: Densitometric analysis of ACTA2 protein levels relative to tubulin (representative of 5 independent experiments; *p = 0.0189). Lower panel: Densitometric analysis of intracellular CTGF protein levels relative to tubulin (representative of 5 independent experiments, *p = 0.0485). (B) Upper panel: Western blot showing extracellular CTGF protein levels in media conditioned by WI-38 fibroblasts starved in the presence of rapamycin (R) or vehicle (V) for 4 d. Representative of 5 independent experiments. Lower panel: Densitometric analysis of extracellular CTGF, representative of 5 independent experiments, ***P < 0.0001 V vs R. (C) Evaluation of the expression of the myofibroblast marker COL1A1 by real-time qPCR in WI-38 fibroblasts serum starved for 4 d in the presence of rapamycin (10 nM; R) or vehicle (V) (**p = 0.005 V vs R). Collagen mRNA levels of fibroblasts grown in normal medium or starved for 4 d from the same experiment are shown in . Representative of 2 independent experiments performed in triplicate. (D) Effects of MTORC2 inhibition by RICTOR silencing on levels of downstream target AKT phosphorylation, myofibroblast marker ACTA2, and intracellular CTGF. Left panel: Cells were incubated in SS for 4 d after electroporation with control siRNA (siCTL) or siRICTOR. Cell lysates were analyzed by WB. Inhibition of RICTOR expression (82.3 +/- 17.3%, representative of 4 independent experiments, ***P < 0.0001) was achieved over siCTL. Right upper panel: Densitometric analysis of AKT p relative to total AKT (representative of 4 independent experiments; ***p = 0.0002). Right middle panel: Densitometric analysis of ACTA2 relative to tubulin (representative of 4 independent experiments; ***p = 0.0003). Right lower panel: Densitometric analysis of intracellular CTGF relative to tubulin (representative of 4 independent experiments; *p = 0.0286). (E) Upper panel: Evaluation of extracellular CTGF by WB in conditioned media from the experiment described in (C). Lower panel: Densitometric analysis of extracellular CTGF (representative of 4 independent experiments; *p = 0.0286).
To explore further the importance of MTORC2 activation in autophagy-induced myofibroblast differentiation, RICTOR, an integral component of the MTORC2 complex, was silenced. RICTOR silencing in serum-starved fibroblasts prevented AKT phosphorylation at Ser473 (). RICTOR silencing also blocked ACTA2 upregulation (). This was associated with reduced intracellular CTGF protein levels and reduced secretion of CTGF (). Silencing RPTOR, a constituent of the MTORC1 complex, in starved fibroblasts did not modulate ACTA2 and CTGF levels (Fig. S6E). Collectively, these results identify MTORC2 activation as a central regulator of CTGF upregulation and myofibroblast differentiation in serum-starved fibroblasts.
Autophagy is a novel activator of MTORC2-signaling
We then sought to evaluate whether autophagy per se was central to MTORC2 activation in our system. Blocking autophagy in starved fibroblasts with 3-MA, wortmannin or LY294002 significantly reduced phosphorylation of AKT at Ser473 (), but did not modulate MTORC1 activity (Fig. S7A, S7B). To rule out the possibility that these autophagy inhibitors could directly alter MTORC2 activity independently of autophagy, we also evaluated the impact of ATG7 silencing on Ser473 AKT phosphorylation. ATG7 silencing reduced AKT phosphorylation in starved fibroblasts (), demonstrating the importance of the autophagic response in triggering MTORC2 activation. Also, in starved fibroblasts silenced for ATG7, transduction with a constitutively active AKT construct enhanced myofibroblast differentiation, with increased protein levels of CTGF and ACTA2 (Fig. S7C). Collectively, these results identify sustained autophagy as a novel activator of MTORC2-dependent signaling leading to enhanced CTGF expression and secretion which in turn fosters myofibroblast differentiation ().
Figure 7. Autophagy is essential for MTORC2 activity induced by serum starvation. (A) Upper panel: Evaluation of AKT Ser473 phosphorylation (AKT p) and total AKT (AKT t) by WB in WI-38 fibroblasts at baseline or exposed to SS plus vehicle for 2 d or maintained in SS with the autophagy inhibitors 3-methyladenine (1 mM; 3-MA), wortmannin (100 nM; W), or LY294002 (5 μM; LY). Representative of 4 independent experiments. Lower left panel: Densitometric analysis of AKT p relative to AKT t in cells exposed to DMSO or 3-MA (representative of 4 independent experiments, *p = 0.0286). Lower right panel: Densitometric analysis of AKT p relative to AKT t in cells exposed to DMSO or LY (representative of 4 independent experiments, *p = 0.0114 V vs LY at d 2). (B) Upper panel: Evaluation of AKT Ser473 phosphorylation (AKT p) and total AKT (AKT t) by WB in WI-38 fibroblasts exposed to SS for 2 d post-transfection with control siRNA (siCTL) or siRNA specific to ATG7 (siATG7). Representative of 3 independent experiments. Lower panel: Densitometric analysis of AKT p protein level relative to AKT t (representative of 3 independent experiments, ***P < 0.0001) in WI-38 fibroblasts silenced for ATG7 expression (ATG7 silencing is effective at 80.6% ± 6.0%, representative of 3 independent experiments, ***P < 0.0001).
Figure 8. Long-term autophagy favors MTORC2 activation leading to enhanced CTGF production and myofibroblast differentiation. Short-term serum starvation inactivates MTORC1 and MTORC2 signaling leading to dephosphorylation of RPS6KB1 (Thr389) and AKT (Ser473). MTORC1 inhibition induces autophagy, demonstrated by a higher LC3B-II/-I ratio and lower SQSTM1 level. Rapamycin increases autophagy by further inhibiting MTORC1. A sustained autophagic response is responsible for the MTORC2 reactivation when fibroblasts are starved for 2 d or more (long term), as measured by rephosphorylation of AKT at Ser473. In turn, MTORC2 activity drives the production and secretion of the pro-fibrotic cytokine CTGF leading to myofibroblast differentiation. Long-term exposure to rapamycin inactivates MTORC1 leading to an increased autophagic response, but prevents MTORC2 activation and downstream CTGF induction and myofibroblast differentiation.
Discussion
Mounting evidence suggests that dysregulated autophagy plays a central role in abnormal repair processes. Fibrosis, a maladaptive form of tissue remodeling, is characterized by the sustained presence of myofibroblasts defined by an enhanced capacity to produce ECM components and to exert a tensile force on the ECM. This leads to ECM thickening and contraction, loss of the normal tissue architecture, and loss of function. Fibrosis characterizes most forms of chronic organ failure including liver cirrhosis,Citation42 renal failure,Citation43 and pulmonary fibrosis.Citation44 Both enhanced and decreased autophagy have been linked to fibrosis, suggesting that the timing of the autophagic process, the cell types at play and the downstream pathways triggered by autophagy weave a complex interplay of responses that may be either beneficial or detrimental to tissue repair. In murine models of liver injury, genetic invalidation of the central autophagic gene ATG7 specifically in hepatic stellate cells prevents their myofibroblast differentiation and significantly decreases liver fibrosis.Citation26 An association between the activation of autophagy and acquisition of myofibroblast markers has also been documented in renal mesangial cells and pulmonary fibroblasts.Citation25,26 However, the use of the MTOR inhibitor rapamycin, a classical inducer of autophagy, in models of renal, pulmonary, and skin fibrosis prevents or decreases fibrotic indices including myofibroblast differentiation.Citation37,45,46 Here, we sought to characterize the pathways linking autophagy with myofibroblast differentiation in stromal cells and to define the various levels of crosstalk between autophagy and MTOR-dependent signaling regulating myofibroblast differentiation. Using starvation as a classical inducer of autophagy in fibroblasts, we demonstrate not only temporal relations between sustained autophagy and myofibroblast differentiation but a central role for autophagy in triggering myofibroblast differentiation. Preventing development of autophagy through inhibition of PtdIns3K with LY294002, wortmannin or 3-MA blocked myofibroblast differentiation. Inhibiting autophagy through ATG7 silencing also prevented myofibroblast differentiation.
Our results demonstrate that in a pure fibroblast system, autophagy enhances myofibroblast differentiation through TGFB-independent pathways. Indeed, we observed no evidence of SMAD signaling in our system. Also, neutralizing antibodies against all active isoforms of TGFB failed to prevent autophagy-induced myofibroblast differentiation while effectively blocking TGFB-induced differentiation. These results do not, however, rule out a potential contribution of TGFB in vivo where the draw of immune cells to the sites of tissue remodeling could accentuate myofibroblast differentiation via TGFB-dependent pathways. Nonetheless, our results demonstrate that in fibroblasts, autophagy triggers an intrinsic program of myofibroblast differentiation largely dependent on the upregulation of CTGF expression and secretion. Several lines of evidence support the central role of CTGF in inducing autophagy-dependent myofibroblast differentiation. Starvation initially decreased CTGF levels but prolonged starvation favored CTGF re-expression. Inhibiting autophagy in starved fibroblasts, either through PtdIns3K inhibition or ATG7 silencing, prevented re-expression of CTGF. Finally, silencing CTGF in starved fibroblasts blocked myofibroblast differentiation.
CTGF is a cysteine-rich 38-kDa member of the CCN early-response gene family that was first described as an important downstream effector of TGFBCitation47 and a potentiator of TGFB's fibrogenic actions.Citation12 Mounting evidence gathered over the past decade has demonstrated that CTGF can initiate fibrogenic responses independently of TGFB.Citation35,36 CTGF is increasingly recognized as a central fibrogenic mediator upregulated in a variety of fibrotic disorders and is overexpressed prior to and in association with fibrosis development.Citation35,36 CTGF acts as a matricellular protein rather than a conventional growth factor, interacting with multidomain structures in association with various cell surface receptors (integrins, proteoglycans, low-density lipoprotein receptor-related protein). CTGF-neutralizing antibodies prevent renal and pulmonary fibrosisCitation48-50 and reduction of CTGF expression by antisense treatment ameliorates renal tubulo-interstitial fibrosisCitation51 and prevents myofibroblast differentiation of hepatic stellate cells.Citation52 In humans, CTGF is upregulated in various chronic fibrotic disorders, including liver fibrosis, systemic sclerosis, diabetic nephropathy, and chronic allograft nephropathy.Citation17,53-58
Our results also highlight the central importance of MTORC2 in autophagy-induced myofibroblast differentiation. In our system, phosphorylation of the MTORC1 downstream target RPS6KB1 was low in starved fibroblasts and exposure to rapamycin or Torin 1 further reduced RPS6KB1 phosphorylation. The pattern of MTORC2 activation in starved fibroblasts, monitored by AKT phosphorylation at serine 473, was quite distinct. As expected, AKT phosphorylation rapidly decreased upon starvation but was followed by spontaneous rephosphorylation after 2 d. In starved cells, blocking MTORC2 activity, with rapamycin, Torin 1 or RICTOR silencing, prevented myofibroblast differentiation. In unstarved cells, however, rapamycin inhibited MTORC1 and triggered autophagy, but failed to reduce AKT phosphorylation. In this context, rapamycin treatment enhanced MTORC2 activity and enhanced myofibroblast differentiation. These results are consistent with previous reports showing that rapamycin preferentially inhibits MTORC1 vs MTORC2 and that MTORC1 blockade can release MTORC1-dependent inhibition of MTORC2.Citation39,41 However, in a situation where MTORC1 activity is absent, such as starvation, prolonged rapamycin treatment can display inhibitory activity toward MTORC2.
To further define the importance of autophagy in MTORC2 activation, we inhibited autophagy in starved fibroblasts with inhibitors of PtdIns3K or by silencing ATG7. Both methods concurred in demonstrating a central role for autophagy in MTORC2 activation. Also, when ATG7 silenced starved cells were transduced with a constitutively active AKT construct, myofibroblast differentiation was enhanced. These results demonstrated that MTORC2 is active downstream of autophagy and drives myofibroblast differentiation.
The conventional dogma proposes that MTORC1 regulates mRNA translation and cellular proliferation while MTORC2 activation regulates reorganization of the actin cytoskeleton.Citation40 Our results demonstrate that long-term MTORC2 activation leads to important changes in gene and protein expression patterns in fibroblasts, favoring the development of a fibrogenic microenvironment. These results are in line with recent reports demonstrating that MTORC2 can regulate expression of stress and hypoxia-induced proteins of potential importance in controlling cellular adaptation to external stress.Citation59 Our results further support the notion that MTORC2 can act as an upstream regulator of stress-induced proteins and identify CTGF as a novel downstream product of MTORC2 signaling.
Our results are consistent with the work of Hernandez-Gea V et al., showing that autophagy of hepatic stellate cells enhances liver fibrosis.Citation25,26 Our results may, however, be seen as contradictory to work published by Araya and colleagues demonstrating an inhibitory function for autophagy in myofibroblast differentiation of pulmonary fibroblasts.Citation60 A number of reasons could explain this discrepancy, including differences in duration of autophagy and autophagy inducers. Both studies, however, highlight the importance of MTOR-dependent pathways in controlling myofibroblast differentiation. Also, our work highlights the importance of duration of autophagy on myofibroblast differentiation. In our system, short-term autophagy (up to 24 h) did not activate MTORC2, and failed to increase CTGF secretion and myofibroblast differentiation. Prolonged autophagy, however, induced MTORC2 activation, which in turn promoted CTGF secretion and myofibroblast differentiation ().
In summary, the present results lend further support for a key role for sustained autophagy as a central regulator of myofibroblast differentiation. Long-term starvation, while repressing MTORC1 activation, triggers activation of the MTORC2 complex, culminating in enhanced synthesis and secretion of the fibrogenic mediator CTGF, which in turn initiates a program of myofibroblast differentiation. These results provide novel insights into the fibrogenic molecular pathways triggered by the autophagic program and highlight new potential targets of intervention for preventing maladaptive myofibroblast differentiation.
Materials and Methods
Cell culture
WI-38 human fibroblasts from normal embryonic lung tissue were purchased from the American Type Culture Collection (CCL-75), grown in fibroblast basal medium (Lonza, CC-3131) supplemented with 10% inactivated fetal bovine serum (FBS; Wisent, 090150) (normal medium [N]) and used between passages 6 and 8. Normal human lung fibroblasts (Lonza, CC-2512) and mouse embryonic fibroblasts (ATCC, CRL-2214) were grown in DMEM (Wisent, 319-005-CL) with 10% FBS. For growth factor deprivation, the fibroblasts were washed twice with phosphate-buffered saline (PBS; Wisent, 311-425-CL) before being exposed to serum-free medium. The media were replaced every other day. Conditioned cell culture media were centrifuged at 1,200 g for 15 min at 4°C and kept at −20°C for further analysis. The cells were plated at a density of 20,000 cells/cm2 in 6-well plates and exposed to experimental conditions or vehicle when they reached 80–90% confluency.
Immunoblotting
Cellular proteins were extracted, separated by electrophoresis, transferred to nitrocellulose membranes and probed, as described previously.Citation19,32,61 To compare levels of secreted proteins, 3 ml of conditioned medium were concentrated by centrifugation in a 5,000 molecular weight cut-off Vivaspin 500 system (Sartorius Stedim Biotech, VS0112) at 15,000 g, followed by electrophoresis and protein gel blotting (WB). The antibodies used for WB were anti-ACTA2/αSMA (Sigma-Aldrich, A2547), anti-CTGF (Santa Cruz Biotechnology, sc-14939), anti-LC3B (Novus, NB600-1384), anti-mouse SQSTM1/p62 (MBL, PM045B), anti-human SQSTM1/p62 (Cell Signaling Technology, 8025), anti-phospho-RPS6KB1/p70S6K (Thr389; Cell Signaling Technology, 9205), anti-phospho-AKT (Ser473; Cell Signaling Technology, 9271) and anti-AKT (Cell Signaling Technology, 9272), anti-RICTOR (Cell Signaling Technology, 2114), anti-RPTOR (Cell Signaling Technology, 2280), anti-PARP (Cell Signaling Technology, 9542), anti-phospho-SMAD2 (Millipore, AB3849) and anti-SMAD2/3 (Millipore, 07-408), anti-proCOL1A1/collagen type I (Meridian, T59103R), anti-ATG7 (R&D Systems, MAB6608), and anti-HA (Roche Applied Science, 11 666 606 001). Membranes were stained with Ponceau S Red (Sigma, P-3504) as loading control, or, alternatively, after initial probing, they were stripped and re-probed with anti-α-tubulin (Calbiochem, CP06). Densitometric analyses were conducted with AlphaImager, version 3.2 (Alpha Innotech Corporation, San Leandro, CA, USA). Data are expressed in arbitrary units.
Immunofluorescence microscopy
Cells were grown in 8-well glass slides (Nalge Nunc, Lab-Tek II 154534), rinsed twice with PBS and fixed with 4% paraformaldehyde. The slides were washed 3 times with PBS before permeabilization and after each subsequent step. Permeabilization was done with 0.1% Triton X-100 (Sigma, T9284) in PBS for 15 min. Chamber slides were blocked with PBS/10% donkey serum (Sigma, D9663)/1% BSA (Sigma, A9647)/0.1% Tween 20 (Sigma, P1379) for 15 min. For ACTA2 staining, cells were incubated with mouse monoclonal antibody (Sigma-Aldrich, A2547) and Alexa 594-labeled anti-mouse Ab (Molecular Probes, A21203), each for 60 min at room temperature in blocking buffer. For stress fiber characterization, the slides were incubated with phalloidin-FITC (Sigma-Aldrich, P5282) for 60 min at room temperature in blocking buffer. Nuclei were stained with TO-PRO 3 (Molecular Probes, T3605). The cells were then visualized under a Leica SP5 confocal microscope and analyzed with Leica LAS AF software (Leica Microsystems, Concord, ON, Canada).
GFP-LC3B expression
We used the Premo Autophagy Sensor GFP-LC3B BacMam 2.0 Expression vector Kit from Invitrogen (P36235) and followed instructions provided by the manufacturer. In brief, WI-38 fibroblasts were plated in 8-well glass slides (Nalge Nunc, Lab-Tek II 154534). When they reached 40,000 cells/well, they were infected with GFP-LC3B-containing baculovirus at a multiplicity of infection of 30 in normal medium. After overnight incubation, the slides were washed twice with PBS and exposed to experimental conditions for 24 h. The cells were then fixed with paraformaldehyde (4%) and nuclei were stained with 0.5 ug/ml DAPI (Invitrogen, D3571). Cells were observed using a Olympus multiphoton FV-1000 MER confocal microscope.
Small interfering RNAs (siRNAs)
For silencing of CTGF, WI-38 fibroblasts were plated in 6-well plates at 20,000 cells per cm2. When the cells were near confluency, they were transfected with oligofectamine (6 μl/well; Invitrogen, 12252-011) and siRNAs at a final concentration of 200 nM annealed oligonucleotides in cell culture medium without serum. Two d post-transfection, the medium was changed and the cells were maintained under experimental conditions (without serum) for 5 d, with medium changed every 2 d, followed by evaluation of myofibroblast differentiation. Pre-designed oligonucleotides for human CTGF (ON-TARGETplus SMARTpool L-012633-01) and control siRNA (ON-TARGETplus non-targeting siRNA D-001810-01) were obtained from Dharmacon Research and Thermo Fisher Scientific.
For ATG7, RICTOR, and RPTOR silencing, fibroblasts grown in normal conditions were harvested by trypsinization and separated in aliquots of 1.5 million cells. Separate aliquots were transfected with siRICTOR (Dharmacon, L-016984-00), siATG7 (Dharmacon, L-020112-00), siRPTOR (Dharmacon, L-004107-00), or siControl (Dharmacon, D-001810-03). We used the Amaxa Nucleofector electroporator (Amaxa, Gaithersburg, MD, USA) and the Nucleofector electroporation kit for WI-38 (Lonza, VCA-1001) according to the manufacturer's guidelines. The final concentration of siRNA was 150 pmol of siRNA/reaction. After electroporation, each cellular aliquot was plated in 2 wells of a 6-well plate in normal medium for 24 h. The media were then changed for experimental condition (medium without serum) after 2 washes with PBS. The cells were harvested at different time points for western blot analysis. For 4 d in SS, the media were changed at d 2.
Adenoviral vector system for overexpression of constitutively active AKT
For activation of AKT, WI-38 fibroblasts were infected with an adenovirus vector encoding a constitutively active AKT construct (Ad-CA-AKT [Myr], Vector Biolabs, 1020). A commercially available adenovirus vector (Ad-CMV-null, Vector Biolabs, 1300) was used as control. Cells were infected at a multiplicity of infection of 2 in normal medium for 6 h, followed by electroporation with siATG7 or control, as described above.
RNA preparation and quantitative polymerase chain reaction (qPCR)
Total RNA from WI-38 fibroblasts was prepared with the RNeasy kit from Qiagen Inc. (74134). cDNA synthesis was completed according to the M-MLV-RT First-Strand Synthesis protocol (Invitrogen, 28025-013) with a starting amount of 1 μg RNA and reverse transcription with random hexamers (Invitrogen, 48190-011). PCR was performed with a Rotor-gene 3000 Real-Time Centrifugal DNA Amplification System (Corbett Tumor Tissues Research, Sydney, Australia). Quantitect™ SYBR Green PCR (Qiagen, 204143) reaction mixture was employed according to the manufacturer's instructions. Serial dilutions generated a standard curve for each gene tested, to define the efficiency of real time qPCR. All experiments, including positive and negative controls, were run in triplicate. The primer sequences were: CTGF fw 5′- TTGGCCCAGACCCAACTATG, rev 5′-CAGGAGGCGTTGTCATTGGT; COL1A1 fw 5′- CCTCAAGGGCTCCAACGAG, rev 5′ TCAATCACTGTCTTGCCCCA; COL3A1 fw 5′- AACACGCAAGGCTGTGAGACT, rev 5′- GCCAACGTCCACACCAAATT; GAPDH fw 5′- TGCACCACCAACTGCTTAGC, rev 5′- GGCATGGACTGTGGTCATGAG.
Reagents
Recombinant human TGFB1 (100-B), pan-TGFB1/2/3-blocking antibody (AB-100-NA) and isotype controls (AB-105-C) were obtained from R&D Systems. LY294002 (440202) and 3-methyladenine (189490) were purchased from Calbiochem, and rapamycin (R0395), wortmannin (W3144) and bafilomycin A1 (B1793) from Sigma. Torin 1 (4247) was obtained from TOCRIS bioscience. All other reagents were from Sigma Chemicals.
Statistical analysis
The results, expressed as means ± SEM, were analyzed by unpaired Student t test or the Mann-Whitney test as appropriate. P < 0.05 was considered significant for all tests.
Disclosure of Potential Conflicts of Interest
No potential conflicts of interest were disclosed.
Supplemental Material
Supplemental data for this article can be accessed on the publisher's website.
Supplementary_Figures_and_Legends.zip
Download Zip (4.9 MB)Funding
This work was supported by research grants from the Canadian Institutes of Health Research (CIHR, MOP-123436) to MJH, holder of the Shire Chair in Nephrology, Transplantation and Renal Regeneration of the Université de Montréal. MJH is supported by the Canadian Transplant Research Program (CNTRP). MB is the recipient of a fellowship from Fonds de la recherche en santé du Québec (FRQS). The authors thank the J.-L. Lévesque Foundation for renewed support.
References
- Hinz B. Formation and function of the myofibroblast during tissue repair. J Invest Dermatol 2007; 127:526-37; PMID:17299435; http://dx.doi.org/10.1038/sj.jid.5700613
- Wynn TA. Common and unique mechanisms regulate fibrosis in various fibroproliferative diseases. J Clin Invest 2007; 117:524-9; PMID:17332879; http://dx.doi.org/10.1172/JCI31487
- Tomasek JJ, Gabbiani G, Hinz B, Chaponnier C, Brown RA. Myofibroblasts and mechano-regulation of connective tissue remodelling. Nat Rev Mol Cell Bio 2002; 3:349-63; http://dx.doi.org/10.1038/nrm809
- Hinz B, Gabbiani G. Fibrosis: recent advances in myofibroblast biology and new therapeutic perspectives. F1000 Biol Rep 2010; 2:78; PMID:21170369; http://dx.doi.org/10.3410/B2-78
- Desmouliere A, Darby IA, Gabbiani G. Normal and pathologic soft tissue remodeling: role of the myofibroblast, with special emphasis on liver and kidney fibrosis. Lab Invest 2003; 83:1689-707; PMID:14691287; http://dx.doi.org/10.1097/01.LAB.0000101911.53973.90
- Biernacka A, Dobaczewski M, Frangogiannis NG. TGF-beta signaling in fibrosis. Growth Factors 2011; 29:196-202; PMID: ; http://dx.doi.org/10.3109/08977194.2011.595714
- Kulozik M, Hogg A, Lankat-Buttgereit B, Krieg T. Co-localization of transforming growth factor beta 2 with alpha 1(I) procollagen mRNA in tissue sections of patients with systemic sclerosis. J Clin Invest 1990; 86:917-22; PMID:1697606; http://dx.doi.org/10.1172/JCI114793
- Boor P, Floege J. Chronic kidney disease growth factors in renal fibrosis. Clin Exp Pharmacol Physiol 2011; 38:441-50; PMID:21276040; http://dx.doi.org/10.1111/j.1440-1681.2011.05487.x
- Sime PJ, O’Reilly KM. Fibrosis of the lung and other tissues: new concepts in pathogenesis and treatment. Clin Immunol 2001; 99:308-19; PMID:11358425; http://dx.doi.org/10.1006/clim.2001.5008
- Gressner AM, Weiskirchen R, Breitkopf K, Dooley S. Roles of TGF-beta in hepatic fibrosis. Front Biosci 2002; 7:d793-807; PMID:11897555; http://dx.doi.org/10.2741/gressner
- Mori T, Kawara S, Shinozaki M, Hayashi N, Kakinuma T, Igarashi A, Takigawa M, Nakanishi T, Takehara K. Role and interaction of connective tissue growth factor with transforming growth factor-beta in persistent fibrosis: A mouse fibrosis model. J Cell Physiol 1999; 181:153-9; PMID:10457363; http://dx.doi.org/10.1002/(SICI)1097-4652(199910)181:1%3c153::AID-JCP16%3e3.0.CO;2-K
- Abreu JG, Ketpura NI, Reversade B, De Robertis EM. Connective-tissue growth factor (CTGF) modulates cell signalling by BMP and TGF-beta. Nat Cell Biol 2002; 4:599-604; PMID:12134160
- Frazier K, Williams S, Kothapalli D, Klapper H, Grotendorst GR. Stimulation of fibroblast cell growth, matrix production, and granulation tissue formation by connective tissue growth factor. J Invest Dermatol 1996; 107:404-11; PMID:8751978; http://dx.doi.org/10.1111/1523-1747.ep12363389
- Leask A, Parapuram SK, Shi-Wen X, Abraham DJ. Connective tissue growth factor (CTGF, CCN2) gene regulation: a potent clinical bio-marker of fibroproliferative disease? J Cell Commun Signal 2009; 3:89-94; PMID:19156539; http://dx.doi.org/10.1007/s12079-009-0037-7
- Liu S, Shi-wen X, Abraham DJ, Leask A. CCN2 is required for bleomycin-induced skin fibrosis in mice. Arthritis Rheum 2011; 63:239-46; PMID:20936632; http://dx.doi.org/10.1002/art.30074
- Phanish MK, Winn SK, Dockrell ME. Connective tissue growth factor-(CTGF, CCN2)–a marker, mediator and therapeutic target for renal fibrosis. Nephron Exp Nephrol 2010; 114:e83-92; PMID:19955828; http://dx.doi.org/10.1159/000262316
- Igarashi A, Nashiro K, Kikuchi K, Sato S, Ihn H, Fujimoto M, Grotendorst GR, Takehara K. Connective tissue growth factor gene expression in tissue sections from localized scleroderma, keloid, and other fibrotic skin disorders. J Invest Dermatol 1996; 106:729-33; PMID:8618012; http://dx.doi.org/10.1111/1523-1747.ep12345771
- Huang G, Brigstock DR. Regulation of hepatic stellate cells by connective tissue growth factor. Front Biosci (Landmark Ed) 2012; 17:2495-507; PMID:22652794; http://dx.doi.org/10.2741/4067
- Laplante P, Sirois I, Raymond MA, Kokta V, Beliveau A, Prat A, Pshezhetsky AV, Hebert MJ. Caspase-3-mediated secretion of connective tissue growth factor by apoptotic endothelial cells promotes fibrosis. Cell Death Differ 2010; 17:291-303; PMID:19730442; http://dx.doi.org/10.1038/cdd.2009.124
- Hong KH, Yoo SA, Kang SS, Choi JJ, Kim WU, Cho CS. Hypoxia induces expression of connective tissue growth factor in scleroderma skin fibroblasts. Clin Exp Immunol 2006; 146:362-70; PMID:17034590; http://dx.doi.org/10.1111/j.1365-2249.2006.03199.x
- Higgins DF, Biju MP, Akai Y, Wutz A, Johnson RS, Haase VH. Hypoxic induction of Ctgf is directly mediated by Hif-1. Am J Physiol Renal Physiol 2004; 287:F1223-32; PMID:15315937; http://dx.doi.org/10.1152/ajprenal.00245.2004
- Braig S, Wallner S, Junglas B, Fuchshofer R, Bosserhoff AK. CTGF is overexpressed in malignant melanoma and promotes cell invasion and migration. Br J Cancer 2011; 105:231-8; PMID:21673687; http://dx.doi.org/10.1038/bjc.2011.226
- Nazio F, Strappazzon F, Antonioli M, Bielli P, Cianfanelli V, Bordi M, Gretzmeier C, Dengjel J, Piacentini M, Fimia GM, et al. mTOR inhibits autophagy by controlling ULK1 ubiquitylation, self-association and function through AMBRA1 and TRAF6. Nat Cell Biol 2013; 15:406-16; PMID:23524951; http://dx.doi.org/10.1038/ncb2708
- Del Principe D, Lista P, Malorni W, Giammarioli AM. Fibroblast autophagy in fibrotic disorders. J Pathol 2013; 229:208-20; PMID:23018629; http://dx.doi.org/10.1002/path.4115
- Hernandez-Gea V, Friedman SL. Autophagy fuels tissue fibrogenesis. Autophagy 2012; 8:849-50; PMID:22617442; http://dx.doi.org/10.4161/auto.19947
- Hernandez-Gea V, Ghiassi-Nejad Z, Rozenfeld R, Gordon R, Fiel MI, Yue Z, Czaja MJ, Friedman SL. Autophagy releases lipid that promotes fibrogenesis by activated hepatic stellate cells in mice and in human tissues. Gastroenterology 2012; 142:938-46; PMID:22240484; http://dx.doi.org/10.1053/j.gastro.2011.12.044
- Klionsky DJ, Abdalla FC, Abeliovich H, Abraham RT, Acevedo-Arozena A, Adeli K, Agholme L, Agnello M, Agostinis P, Aguirre-Ghiso JA, et al. Guidelines for the use and interpretation of assays for monitoring autophagy. Autophagy 2012; 8:445-544; PMID:22966490; http://dx.doi.org/10.4161/auto.19496
- Wu YT, Tan HL, Shui G, Bauvy C, Huang Q, Wenk MR, Ong CN, Codogno P, Shen HM. Dual role of 3-methyladenine in modulation of autophagy via different temporal patterns of inhibition on class I and III phosphoinositide 3-kinase. J Biol Chem 2010; 285:10850-61; PMID:20123989; http://dx.doi.org/10.1074/jbc.M109.080796
- Blommaart EF, Krause U, Schellens JP, Vreeling-Sindelarova H, Meijer AJ. The phosphatidylinositol 3-kinase inhibitors wortmannin and LY294002 inhibit autophagy in isolated rat hepatocytes. Eur J Biochem 1997; 243:240-6; PMID:9030745; http://dx.doi.org/10.1111/j.1432-1033.1997.0240a.x
- Petiot A, Ogier-Denis E, Blommaart EF, Meijer AJ, Codogno P. Distinct classes of phosphatidylinositol 3′-kinases are involved in signaling pathways that control macroautophagy in HT-29 cells. J Biol Chem 2000; 275:992-8; PMID:10625637; http://dx.doi.org/10.1074/jbc.275.2.992
- Komatsu M, Waguri S, Ueno T, Iwata J, Murata S, Tanida I, Ezaki J, Mizushima N, Ohsumi Y, Uchiyama Y, et al. Impairment of starvation-induced and constitutive autophagy in Atg7-deficient mice. J Cell Biol 2005; 169:425-34; PMID:15866887; http://dx.doi.org/10.1083/jcb.200412022
- Laplante P, Raymond MA, Gagnon G, Vigneault N, Sasseville AMJ, Langelier Y, Bernard M, Raymond Y, Hebert MJ. Novel fibrogenic pathways are activated in response to endothelial apoptosis: Implications in the pathophysiology of systemic sclerosis. J Immunol 2005; 174:5740-9; PMID:15843576; http://dx.doi.org/10.4049/jimmunol.174.9.5740
- Laplante P, Raymond MA, Labelle A, Abe J, Iozzo RV, Hebert MJ. Perlecan proteolysis induces an alpha2beta1 integrin- and Src family kinase-dependent anti-apoptotic pathway in fibroblasts in the absence of focal adhesion kinase activation. J Biol Chem 2006; 281:30383-92; PMID:16882656; http://dx.doi.org/10.1074/jbc.M606412200
- Shi Y, Massague J. Mechanisms of TGF-beta signaling from cell membrane to the nucleus. Cell 2003; 113:685-700; PMID:12809600; http://dx.doi.org/10.1016/S0092-8674(03)00432-X
- Leask A. CCN2: a bona fide target for anti-fibrotic drug intervention. J Cell Commun Signal 2011; 5:131-3; PMID:21484186; http://dx.doi.org/10.1007/s12079-011-0125-3
- Brigstock DR. Connective tissue growth factor (CCN2, CTGF) and organ fibrosis: lessons from transgenic animals. J Cell Commun Signal 2010; 4:1-4; PMID:19798591; http://dx.doi.org/10.1007/s12079-009-0071-5
- Chen G, Chen H, Wang C, Peng Y, Sun L, Liu H, Liu F. Rapamycin ameliorates kidney fibrosis by inhibiting the activation of mTOR signaling in interstitial macrophages and myofibroblasts. PloS One 2012; 7:e33626; PMID:22470459; http://dx.doi.org/10.1371/journal.pone.0033626
- Huang S, Bjornsti MA, Houghton PJ. Rapamycins: mechanism of action and cellular resistance. Cancer Biol Ther 2003; 2:222-32; PMID:12878853; http://dx.doi.org/10.4161/cbt.2.3.360
- Sarbassov DD, Ali SM, Sengupta S, Sheen JH, Hsu PP, Bagley AF, Markhard AL, Sabatini DM. Prolonged rapamycin treatment inhibits mTORC2 assembly and AktPKB. Mol Cell 2006; 22:159-68; PMID:16603397; http://dx.doi.org/10.1016/j.molcel.2006.03.029
- Laplante M, Sabatini DM. mTOR signaling in growth control and disease. Cell 2012; 149:274-93; PMID:22500797; http://dx.doi.org/10.1016/j.cell.2012.03.017
- Julien LA, Carriere A, Moreau J, Roux PP. mTORC1-activated S6K1 phosphorylates Rictor on threonine 1135 and regulates mTORC2 signaling. Mol Cell Biol 2010; 30:908-21; PMID:19995915; http://dx.doi.org/10.1128/MCB.00601-09
- Iredale JP. Models of liver fibrosis: exploring the dynamic nature of inflammation and repair in a solid organ. J Clin Invest 2007; 117:539-48; PMID:17332881; http://dx.doi.org/10.1172/JCI30542
- Zeisberg M, Neilson EG. Mechanisms of tubulointerstitial fibrosis. J Am Soc Nephrol 2010; 21:1819-34; PMID:20864689; http://dx.doi.org/10.1681/ASN.2010080793
- Sivakumar P, Ntolios P, Jenkins G, Laurent G. Into the matrix: targeting fibroblasts in pulmonary fibrosis. Curr Opin Pulm Med 2012; 18:462-9; PMID:22847104; http://dx.doi.org/10.1097/MCP.0b013e328356800f
- Patel AS, Lin L, Geyer A, Haspel JA, An CH, Cao J, Rosas IO, Morse D. Autophagy in idiopathic pulmonary fibrosis. PloS one 2012; 7:e41394; PMID:22815997; http://dx.doi.org/10.1371/journal.pone.0041394
- Yoshizaki A, Yanaba K, Yoshizaki A, Iwata Y, Komura K, Ogawa F, Takenaka M, Shimizu K, Asano Y, Hasegawa M, et al. Treatment with rapamycin prevents fibrosis in tight-skin and bleomycin-induced mouse models of systemic sclerosis. Arthritis Rheum 2010; 62:2476-87; PMID:20506342; http://dx.doi.org/10.1002/art.27498
- Grotendorst GR, Okochi H, Hayashi N. A novel transforming growth factor beta response element controls the expression of the connective tissue growth factor gene. Cell Growth Differ 1996; 7:469-80; PMID:9052988
- Ponticos M, Holmes AM, Shi-wen X, Leoni P, Khan K, Rajkumar VS, Hoyles RK, Bou-Gharios G, Black CM, Denton CP, et al. Pivotal role of connective tissue growth factor in lung fibrosis: MAPK-dependent transcriptional activation of type I collagen. Arthritis Rheum 2009; 60:2142-55; PMID:19565505; http://dx.doi.org/10.1002/art.24620
- Lipson KE, Wong C, Teng Y, Spong S. CTGF is a central mediator of tissue remodeling and fibrosis and its inhibition can reverse the process of fibrosis. Fibrogenesis Tissue Repair 2012; 5 Suppl 1:S24; PMID:23259531; http://dx.doi.org/10.1186/1755-1536-5-S1-S24
- Wang Q, Usinger W, Nichols B, Gray J, Xu L, Seeley TW, Brenner M, Guo G, Zhang W, Oliver N, et al. Cooperative interaction of CTGF and TGF-beta in animal models of fibrotic disease. Fibrogenesis Tissue Repair 2011; 4:4; PMID:21284856; http://dx.doi.org/10.1186/1755-1536-4-4
- Yokoi H, Mukoyama M, Nagae T, Mori K, Suganami T, Sawai K, Yoshioka T, Koshikawa M, Nishida T, Takigawa M, et al. Reduction in connective tissue growth factor by antisense treatment ameliorates renal tubulointerstitial fibrosis. J Am Soc Nephrol 2004; 15:1430-40; PMID:15153554; http://dx.doi.org/10.1097/01.ASN.0000130565.69170.85
- Li G, Xie Q, Shi Y, Li D, Zhang M, Jiang S, Zhou H, Lu H, Jin Y. Inhibition of connective tissue growth factor by siRNA prevents liver fibrosis in rats. J Gene Med 2006; 8:889-900; PMID:16652398; http://dx.doi.org/10.1002/jgm.894
- Allen JT, Knight RA, Bloor CA, Spiteri MA. Enhanced insulin-like growth factor binding protein-related protein 2 (Connective tissue growth factor) expression in patients with idiopathic pulmonary fibrosis and pulmonary sarcoidosis. Am J Respir Cell Mol Biol 1999; 21:693-700; PMID:10572066; http://dx.doi.org/10.1165/ajrcmb.21.6.3719
- Paradis V, Dargere D, Vidaud M, De Gouville AC, Huet S, Martinez V, Gauthier JM, Ba N, Sobesky R, Ratziu V, et al. Expression of connective tissue growth factor in experimental rat and human liver fibrosis. Hepatology 1999; 30:968-76; PMID:10498649; http://dx.doi.org/10.1002/hep.510300425
- Sato S, Nagaoka T, Hasegawa M, Tamatani T, Nakanishi T, Takigawa M, Takehara K. Serum levels of connective tissue growth factor are elevated in patients with systemic sclerosis: association with extent of skin sclerosis and severity of pulmonary fibrosis. J Rheumatol 2000; 27:149-54; PMID:10648031
- Metalidis C, van Vuuren SH, Broekhuizen R, Lerut E, Naesens M, Bakker SJ, Wetzels JF, Goldschmeding R, Kuypers DR. Urinary connective tissue growth factor is associated with human renal allograft fibrogenesis. Transplantation 2013; 96:494-500; PMID:23803600; http://dx.doi.org/10.1097/TP.0b013e31829b07e1
- Cheng O, Thuillier R, Sampson E, Schultz G, Ruiz P, Zhang X, Yuen PS, Mannon RB. Connective tissue growth factor is a biomarker and mediator of kidney allograft fibrosis. Am J Transplant 2006; 6:2292-306; PMID:16889607; http://dx.doi.org/10.1111/j.1600-6143.2006.01493.x
- Nguyen TQ, Tarnow L, Andersen S, Hovind P, Parving HH, Goldschmeding R, van Nieuwenhoven FA. Urinary connective tissue growth factor excretion correlates with clinical markers of renal disease in a large population of type 1 diabetic patients with diabetic nephropathy. Diabetes Care 2006; 29:83-8; PMID:16373901; http://dx.doi.org/10.2337/diacare.29.01.06.dc05-1670
- Nayak BK, Feliers D, Sudarshan S, Friedrichs WE, Day RT, New DD, Fitzgerald JP, Eid A, Denapoli T, Parekh DJ, et al. Stabilization of HIF-2alpha through redox regulation of mTORC2 activation and initiation of mRNA translation. Oncogene 2013; 32:3147-55; PMID:22869144; http://dx.doi.org/10.1038/onc.2012.333
- Araya J, Kojima J, Takasaka N, Ito S, Fujii S, Hara H, Yanagisawa H, Kobayashi K, Tsurushige C, Kawaishi M, et al. Insufficient autophagy in idiopathic pulmonary fibrosis. Am J Physiol Lung Cell Mol Physiol 2013; 304:L56-69; PMID:23087019; http://dx.doi.org/10.1152/ajplung.00213.2012
- Cailhier JF, Sirois I, Laplante P, Lepage S, Raymond MA, Brassard N, Prat A, Iozzo RV, Pshezhetsky AV, Hebert MJ. Caspase-3 activation triggers extracellular cathepsin L release and endorepellin proteolysis. J Biol Chem 2008; 283:27220-9; PMID:18658137; http://dx.doi.org/10.1074/jbc.M801164200