
Abstract
The triple-negative breast cancer (TN BC) subtype is the most aggressive form of invasive BC. Despite intensive efforts to improve BC treatments, patients with TN BC continue to exhibit poor survival, with half developing resistance to chemotherapy. Here we identify autophagy as a key mechanism in the progression and chemoresistance of a subset of TN tumors. We demonstrate that LC3B, a protein involved in autophagosome formation, is a reliable marker of poor prognosis in TN BC, validating this prognostic value at both the mRNA and protein levels in several independent cohorts. We also show that LC3B has no prognostic value for other BC subtypes (Luminal or HER2 BC), thus revealing a specific impact of autophagy on TN tumors. Autophagy is essential for the proliferative and invasive properties in 3D of TN BC cells characterized by high LC3B levels. Interestingly, the activity of the transcriptional co-activator YAP1 (Yes-associated protein 1) is regulated by the autophagy process and we identify YAP1 as a new actor in the autophagy-dependent proliferative and invasive properties of high-LC3B TN BC. Finally, inhibiting autophagy by silencing ATG5 or ATG7 significantly impaired high-LC3B TN tumor growth in vivo. Moreover, using a patient-derived TN tumor transplanted into mice, we show that an autophagy inhibitor, chloroquine, potentiates the effects of chemotherapeutic agents. Overall, our data identify LC3B as a new prognostic marker for TN BC and the inhibition of autophagy as a promising therapeutic strategy for TN BC patients.
Abbreviations:
- three-MA, 3-methyladenine
- 3D, 3-dimensions
- ACTB, actin, β
- AP2A1/adaptin, adaptor-related protein complex 2, α 1 subunit
- AC, adriamycin and cyclophosphamide
- ATG, autophagy-related
- BafA1, bafilomycin A1
- BC, breast cancer
- BECN1, Beclin 1, autophagy related
- Ctrl, control
- DFS, disease-free survival
- EBSS, Earle's balanced salt solution
- ERBB2/HER2, v-erb-b2 avian erythroblastic leukemia viral oncogene homolog 2
- GAPDH, glyceraldehyde-3-phosphate dehydrogenase
- HScore, histological scoring
- i.p., intra-peritoneal
- IHC, immunohistochemistry
- Lum, Luminal
- MAP1LC3B/LC3B, microtubule-associated protein one light chain 3 β
- OS, overall survival
- PDX, patient-derived xenografted tumor
- sem, standard error of mean
- TCGA, The Cancer Genome Atlas
- TGI, tumor growth inhibition
- TN BC, triple-negative breast cancer
- YAP1, Yes-associated protein 1
Introduction
Breast cancer (BC) is the most frequent cancer in women, and remains the main cause of cancer-related death despite intensive attempts to develop effective therapies.Citation1,2 Even though the mortality rate for BC is overall slowly declining with the improvement of both early detection and therapies, the latter continue to achieve only limited success, especially in the case of advanced cancers. Endocrine (tamoxifen or aromatase inhibitors) and targeted (trastuzumab) therapies have produced significant improvements for treating estrogen receptor- (including the Luminal A and B subtypes) and ERBB2-positive (HER2) tumors, respectively. However, no major advances were made in treatment of triple-negative (TN) BC, an invasive and aggressive BC subtype that is characterized by a lack of expression of hormone receptors (estrogen and/or progesterone receptor) and the absence of amplification of the ERBB2 oncogene. The main therapeutic option for the TN BC subtype remains the administration of combined cytotoxic chemotherapies, which yield generally poor outcomes regardless of whether an adjuvant or neoadjuvant approach is undertaken.Citation3-5 Thus, defining new treatments for TN tumors remains a challenge and better therapeutic tools are urgently required.Citation6
Even if its role in cancer development remains controversial, autophagy recently became a potentially interesting anticancer target.Citation7 Autophagy was first identified as an evolutionarily conserved catabolic process whereby cells regulate protein turnover and remove misfolded proteins and damaged organelles.Citation8,9 Autophagy is an adaptive response to several stresses, including metabolic and oxidative stress, and occurs in both normal and cancer cells.Citation10 The main role of autophagy is to maintain energy homeostasis by recycling cellular components.Citation11 Although this process has a positive effect on the survival of normal cells, its impact on tumorigenesis and on the chemosensitivity of cancer remains elusive, including in BC. Indeed, a major regulator of autophagy, BECN1, has been identified as a tumor suppressor gene, based on its mono-allelic deletion in a large number of ovarian cancers and BCs.Citation12-14 Moreover, mice heterozygous for Becn1 or mutated for Atg4c display a high rate of spontaneous tumors.Citation15-17 These data suggest that impaired autophagy may contribute to cancer development. Conversely, another body of evidence indicates that autophagy promotes cancer-cell survival and is pro-tumorigenic.Citation10,18,19,20 These findings have led to the hypothesis that autophagy may enable cancer cells to evade treatments, and possibly induce chemotherapeutic resistance.Citation21-23 Finally, the expression of autophagy-related genes (i.e. BECN1, SQSTM1, LC3A, and LC3B) is elevated in several cancers, including lung,Citation24,25 colorectal,Citation26 digestive,Citation27,28 and BCs.Citation29-32 However, no definitive conclusions could be drawn about the use of any of these autophagy-related proteins as a prognostic marker in BC. Most importantly, none of the above-mentioned studies proved that autophagy contributes to cancer progression and that it is predictive of poor prognosis.
Here we address these 2 issues by extensively analyzing several independent cohorts of BC patients, by establishing effects of autophagy on numerous BC cell lines, and by defining the role of autophagy in mouse models of human TN BC displaying a high level of LC3B. We show that LC3B expression, at both mRNA and protein levels, is a reliable independent marker of poor prognosis for TN BC patients. LC3B prognosis value is restricted to TN BC and is not observed in other BC subtypes, indicating autophagy is a crucial process only in TN BC. Consistent with these findings, we demonstrate that autophagy, in a subset of TN cancer cells displaying a high level of LC3B-II, is required for TN cancer cells to proliferate and invade matrix. Importantly, we also highlight the role of YAP1 (Yes-associated protein 1), a potent co-activator of the TEAD (TEA domain) transcription factors, in the autophagy-mediated regulation of TN BC proliferation and invasion. These observations link, for the first time, YAP1 activity to the autophagy process. Finally, we find that inhibiting autophagy by silencing ATG5 or ATG7 in high-LC3B TN BC cells significantly reduces the growth of tumors in nude mice. Moreover, using patient-derived xenografted tumors (PDX) characterized by high LC3B, we show that chloroquine, an autophagy inhibitor, significantly improves the in vivo response to existing chemotherapies, suggesting autophagy inhibition is a promising clinical strategy in the treatment of high-LC3B TN BC patients.
Results
High levels of the MAP1LC3B mRNA in TN BCs correlate with poor prognosis
The LC3B protein is present throughout autophagy, from the formation of autophagic vacuoles to their fusion with lysosomes. LC3B is thus a persistent marker of autophagosomes and autophagy.Citation33,34 We examined the role of autophagy among distinct subtypes of invasive BC by analyzing expression of the LC3B-encoding gene, MAP1LC3B, in a first gene expression data set named as the Curie cohort (see the Materials and Methods section and Table S1 for clinical features of the cohort). MAP1LC3B mRNA levels were significantly higher in the aggressive TN subtype than in Luminal A (LumA; , left). Analysis of available BC samples from the Curie cohort by qRT-PCR confirmed that the MAP1LC3B mRNA significantly accumulated in TN tumors compared to LumA tumors (, right). These results were validated by high MAP1LC3B expression in TN tumors in another independent cohort of BC patients, treated at MarseilleCitation35 ( and Table S1 for clinical features of this cohort). Furthermore, we combined the Curie cohort dataset with another independent data set, named the Stockholm cohortCitation36 (henceforth the combined set is referred to as Curie/Stockholm cohorts), to increase the statistical power of the study, in particular with respect to the TN BC patients (see the Materials and Methods section for details on normalization and procedure). We confirmed the accumulation of MAP1LC3B mRNA in the TN subtype in this new combined dataset (). We next evaluated if MAP1LC3B mRNA could be a prognostic factor for BC. To do so, we performed analyses based on log-rank test. Iterative analyses were performed to find optimal thresholds that maximally discriminate low- and high-MAP1LC3B subgroups (see Materials and Methods). As shown by Kaplan-Meier survival curves based on data from the Curie/Stockholm cohorts, BC patients with high MAP1LC3B expression exhibited significantly lower overall survival (OS) (, left) and a higher risk of developing metastases, as evaluated by disease-free survival (DFS) (, right) than BC patients with low levels of the MAP1LC3B mRNA. Univariate and multivariate analyses using the Cox regression model were also carried out to test autophagy-related genes and BC tumor subtypes as potential predictors of survival for BC patients (). MAP1LC3B was the only autophagy-related gene among those tested that had a significant impact on OS and DFS, independently of the tumor subtype ().
Table 1. LC3B is an independent prognostic factor for overall and disease-free survival of BC patients
Figure 1. For figure legend, see page 2124. Figure 1 (See previous page). High levels of the MAP1LC3B mRNA are associated with poor prognosis in triple-negative BC. (A) Scatter plots of MAP1LC3B mRNA levels in Luminal A (LumA), Luminal B (LumB), HER2-enriched (HER2) and triple-negative (TN) BC subtypes from the Curie cohort. MAP1LC3B mRNA level was evaluated from Affymetrix U133 plus2.0 arrays (left panel, values are in log2 of probeset intensity) and by qRT-PCR (right panel, MAP1LC3B mRNA values are normalized relative to 3 housekeeping genes, TBP, RPLP0 and PPIA, see Materials and Methods). (B) Scatter plots of MAP1LC3B mRNA levels (expressed in log2 of probeset intensity) in LumA, LumB, HER2 and TN BC subtypes from the tumor micro-array dataset of Marseille cohort. (C) Scatter plots of MAP1LC3B mRNA levels in LumA, LumB, HER2 and TN BC subtypes in the combined Curie/Stockholm cohorts. Probeset intensities have been standardized (centered and reduced) to avoid batch effect (see Materials and Methods). (D,E) Kaplan-Meier curves of overall survival (OS) (left panel) and disease-free survival (right panel) for Curie/Stockholm cohorts, with respect to MAP1LC3B mRNA level, in (D) all subtypes of BC (N = 116 for low expression and N = 116 for high expression; cut-off value = 0.16, scatter plot shown in C), and (E) TN BC (N = 33 for low expression and n = 33 for high expression; cut-off value = 0.51, scatter plot shown in C). (F) Kaplan-Meier curves of OS for TCGA cohort, with respect to MAP1LC3B mRNA level, in TN BC (N = 37 for low expression and n = 37 for high expression; cut-off value = -0.22, scatter plot shown in Fig. S1). (G) Kaplan-Meier curves of DFS for Marseille cohort, with respect to MAP1LC3B mRNA level, in TN BC (N = 42 for low expression and N = 19 for high expression; cut-off value =8.34, scatter plot shown in B). p-values are based on the Student t test adjusted for multiple comparisons using Benjamini & Hochberg correction (A,C) or Log-rank test (D–G).
Further assessment of the prognostic value of MAP1LC3B in each BC subtype showed that high MAP1LC3B expression was indicative of both OS and DFS in the case of TN (), but not in LumA, LumB, and HER2 BC subtypes (Fig. S1). We validated that MAP1LC3B correlated with the survival of TN BC patients in 2 other independent cohorts, from The Cancer Genome Atlas (TCGA) cohort () and Marseille () (expression data from Marseille and TCGA cohorts are described in ref. 35 and https://tcga-data.nci.nih.gov/tcga/, respectively; see also Table S1 for clinical features of the cohorts). These observations also revealed that the prognostic value of MAP1LC3B in TN patients was independent of the transcriptomic platform used (Affymetrix for Curie, Stockholm and Marseille cohorts, and Agilent for TCGA cohort). Taken together, our results from 3 independent cohorts of patients demonstrate that the expression of a key gene of autophagy, MAP1LC3B, is significantly upregulated in a subpopulation of TN patients, and serves as a marker of poor prognosis for this particular subgroup of patients.
LC3B protein is a marker of poor prognosis for TN BC patients
Given the potential interest of MAP1LC3B mRNA as a prognostic indicator for TN patients, we investigated whether LC3B protein expression might have a similar property. Using paraffin-embedded control and LC3B-depleted cells, coupled with the use of an isotype control, we first ensured that the LC3B antibody staining by immunohistochemistry (IHC) was specific (Fig. S2). We analyzed LC3B protein levels by IHC, using tissue micro-arrays from 137 BC patients of the Curie cohortCitation37 (). LC3B protein levels, as established by histological scoring (Hscore, see the Materials and Methods section), were significantly higher in the epithelia of TN versus HER2, LumB, and LumA subtypes (). LC3B protein, which was detected mainly in the cytoplasm of epithelial cancer cells, was observed in both a diffuse and punctate pattern, with the latter representative of an accumulation of LC3B-associated autophagosomes (, black arrows in high-magnification insert). We next validated the number of autophagosomes, i.e., LC3B-positive dots, using an automated quantification method (, See also the Materials and Methods section for details). Using EBSS and bafilomycin A1 (BafA1) treatments that induce autophagosome formation and accumulation, respectively, we first assessed that the automated quantification of the staining was specific for autophagic vacuoles (Fig. S3A and B). As expected, we did see an increase in the number of autophagosomes upon EBSS and BafA1 treatments, as compared to control conditions (Fig. S3A and B), results that were highly significantly correlated with autophagosome quantification using ImageJ software (r = 0.996, P-value = 0.003 by Pearson's test). In tumors, as observed with the manual histological scoring, LC3B staining quantified by the automated method was mainly restricted to the epithelial compartment, with a negligible signal in stroma (Fig. S3C–E and Fig. S4A and B). Moreover, using this method, we confirmed that LC3B-positive autophagic vacuoles (blue dots) accumulated more readily in cancer cells of TN patients than in other BC subtypes ( and and Fig. S4C). Importantly, the number of autophagosomes in cancer cells, quantified by this automated method, significantly correlated with the manual LC3B histological scoring, the 2 methods having been applied blindly (rho = 0.76, P-value = 10−8 by Spearman correlation test; see the corresponding graph in ). Finally, although the human BECN1 gene is located in a region with well-known genomic losses,Citation13,14 we observed higher BECN1 protein levels in TN tumors as compared to LumA tumors (Fig. S5A and B). Moreover, although this effect does not reach significance, we also detected a slight reduction in SQSTM1 levels in TN BC (Fig. S5A and B). Taken as a whole, these observations are compatible with a significantly elevated autophagy in a subset of TN BCs.
Figure 2. For figure legend, see page 2127. Figure 2 (See previous page). LC3B protein is a marker of poor prognosis in TN BC patients. (A) Representative views of LC3B immunostaining from Luminal A or B (LumA/LumB), HER2 and TN BC subtypes (Curie cohort). Black arrows point to examples of punctate LC3B immunostaining in TN BC sample. Scale bars = 50 μm (low magnification) and 20 μm (high magnification in inserted sections). (B) LC3B histological scoring (Hscore, see the Materials and Methods) among LumA, LumB, HER2 and TN BC subtypes (Curie cohort). (C) Representative views obtained before (raw data) or after treatment of LC3B IHC images with an automated image segmentation and quantification algorithm (Curie cohort, see the Materials and Methods). After computational analysis, autophagic vesicles are shown as blue dots. Nuclear and plasma membranes are in green and red, respectively. Low and high LC3B IHC are shown, as indicated. Scale bars = 20 μm (low magnification) and 10 μm (high magnification in inserted sections). (D) Scatter plot of average number of autophagosomes per epithelial cell in LumA, LumB, HER2 and TN BCs based on the quantification algorithm (Curie cohort). Horizontal bars represent the median values. (E) Correlation between LC3B histological score (Hscore) and the average number of autophagosomes per epithelial cell quantified by the algorithm. Correlation coefficient and p-value are based on Spearman's test. (F) Kaplan-Meier curve of OS for TN BC cases among Curie cohort, with respect to LC3B HScore (N = 24 for low expression and N = 16 for high expression; cut-off value = 100, scatter plot shown in B). (G) Kaplan-Meier curve of OS for TN BC cases among Saint-Cloud cohort with respect to LC3B HScore (N = 41 for low expression and N = 48 for high expression; cut-off value = 40, scatter plot shown in Fig. S4F). (H) Kaplan-Meier curve of OS of TN BC patients from the Curie cohort, with respect to the average number of autophagosomes per epithelial cell (N = 23 for low number and N = 17 for high number; cut-off value = 4.5, scatter plot shown in D). p-values are based on Mann-Whitney test (B,D) or Log-rank test (E,H).
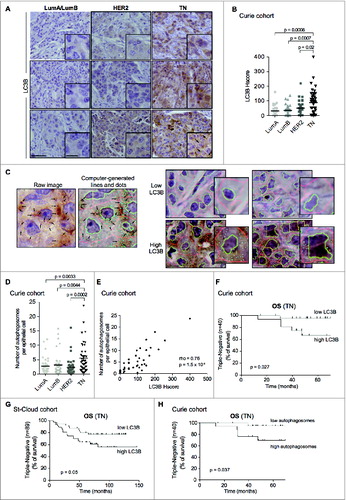
As observed in the case of MAP1LC3B mRNA, a high level of LC3B protein, evaluated by manual histological scoring, was associated with poor prognosis for TN BC patients (). Importantly, the prognosis value of LC3B histological score in TN BC patients had been observed in the Curie cohort () and validated in an independent cohort, referred to as Saint-Cloud (), for which we had also access to tissue sections (see also Table S1 for description of the cohorts). Moreover, based on the automated quantification of autophagosome number per epithelial cell, we distinguished 2 subsets of TN patients with distinct distribution profiles (Fig. S4D). As observed using classic histological scoring (), TN patients characterized by a high proportion of autophagosomes in tumors had a poor survival rate (). Notably, the stratification of TN patients based on LC3B histological score did not correlate with tumor grade or stage, as verified using Fisher's exact test (Fig. S5C). Overall, these data demonstrate that LC3B is a reliable independent marker of poor prognosis for a subset of TN patients.
TN cancer cell lines with high LC3B display high basal autophagy
The high level of LC3B expression observed in a subset of TN BC patients, at either the mRNA or protein level, suggests that these individuals display a high rate of basal autophagy. This could account for the associated poor prognosis. We evaluated the level of LC3B in several human cell lines representing the 3 BC subtypes (i.e., LumA, HER2, and TN). First, consistent with our observations from patients, MAP1LC3B mRNA levels, evaluated either by transcriptomic analysis () or by qRT-PCR on a subset of available cell lines (Fig. S6A), were significantly higher in TN cell lines than in HER2 or LumA BC subtypes (see also Table S2). Moreover, the protein levels of the phosphatidylethanolamine-conjugated form of LC3B, LC3B-II, were globally higher in TN cells than in the others (). Three out of 5 TN cell lines displayed a high level of LC3B-II (). Interestingly, the levels of ATG5 and BECN1 were nearly equivalent in all of the tested cell lines ( and Fig. S6B). Given that LC3B-II is a component of the autophagosome membrane, its protein level can be directly proportional to the number of autophagosomes. Accordingly, the number of autophagosomes, evaluated by immunofluorescence (and quantified either by ImageJ or automated quantification, Fig. S4E), was significantly higher in the tested TN BC cell lines than in HER2 cell lines ().
Figure 3. For figure legend, see page 2129. Figure 3 (See previous page). TN cancer cell lines display high autophagy. (A) MAP1LC3B mRNA levels in LumA, HER2 and TN BC cell lines from the Affymetrix microarray. Horizontal bars represent the median values (N ≥ 10 cell lines in each BC subtype). p-values are based on the Student t test. (B) Representative protein gel blots showing LC3B-I/-II, BECN1, and ATG5 protein levels in LumA (MCF7, T47D, CAMA-one), HER2 (BT474, MDA361, SKBr3, MDA453, HCC1569) and TN (MDA231, MDA436, MDA468, HCC70, BT549) BC cell lines. AP2A1 is used as an internal control for protein loading. Bar graph (right panel) shows the ratio of LC3B-II/AP2A1 protein levels, as assessed by densitometric analysis of western blots. Data are shown as means +/− sem (N = 3 independent experiments). p-values are based on the Student t test. (C) Representative immunofluorescence staining from the indicated HER2 and TN BC cell lines, stained for LC3B (green) and DAPI (blue). Scale bar = 10 μm. (D) Bar graph represents the number of LC3B-positive dots per cell type (HER2 and TN cell lines are shown). Data are shown as means +/− sem (N ≥ 50 cells per condition). p-values are based on Student's t-test. (E–H) The indicated BC cells lines were treated either with (E,F) DMSO (−) and bafilomycin A1 (BafA1 [+], 200 nM for 4 h) or with (G,H) PBS [−] and chloroquine (Chloro [+], 50 μM, overnight). N = 3 independent experiments. (E,G) Representative protein gel blots for LC3B-I/-II protein levels and AP2A1 (used as internal control) are shown. Bar graphs (below each western blot) show the corresponding quantification of LC3B-II/AP2A1 protein level ratio, as assessed by densitometric analysis of protein gel blots, for each cell line, before and after treatment (white and black bars, respectively). (F,H) Bar graphs (left panels) show the ratio of LC3B-II/AP2A1 protein levels per BC subtype, considering LumA (T47D, CAMA-one), HER2 (BT474, MDA361, SKBr3, MDA453, HCC1569) and TN (MDA231, MDA436, MDA468, HCC70, BT549) BC cell lines and (right panels) the autophagy flux as the ratio of LC3B-II protein level after/before treatment (BafA1- or Chloro-treated/Untreated, NT). Data are shown as means +/− sem (N = 3 independent experiments). p-values are based on the Student t test.
![Figure 3. For figure legend, see page 2129. Figure 3 (See previous page). TN cancer cell lines display high autophagy. (A) MAP1LC3B mRNA levels in LumA, HER2 and TN BC cell lines from the Affymetrix microarray. Horizontal bars represent the median values (N ≥ 10 cell lines in each BC subtype). p-values are based on the Student t test. (B) Representative protein gel blots showing LC3B-I/-II, BECN1, and ATG5 protein levels in LumA (MCF7, T47D, CAMA-one), HER2 (BT474, MDA361, SKBr3, MDA453, HCC1569) and TN (MDA231, MDA436, MDA468, HCC70, BT549) BC cell lines. AP2A1 is used as an internal control for protein loading. Bar graph (right panel) shows the ratio of LC3B-II/AP2A1 protein levels, as assessed by densitometric analysis of western blots. Data are shown as means +/− sem (N = 3 independent experiments). p-values are based on the Student t test. (C) Representative immunofluorescence staining from the indicated HER2 and TN BC cell lines, stained for LC3B (green) and DAPI (blue). Scale bar = 10 μm. (D) Bar graph represents the number of LC3B-positive dots per cell type (HER2 and TN cell lines are shown). Data are shown as means +/− sem (N ≥ 50 cells per condition). p-values are based on Student's t-test. (E–H) The indicated BC cells lines were treated either with (E,F) DMSO (−) and bafilomycin A1 (BafA1 [+], 200 nM for 4 h) or with (G,H) PBS [−] and chloroquine (Chloro [+], 50 μM, overnight). N = 3 independent experiments. (E,G) Representative protein gel blots for LC3B-I/-II protein levels and AP2A1 (used as internal control) are shown. Bar graphs (below each western blot) show the corresponding quantification of LC3B-II/AP2A1 protein level ratio, as assessed by densitometric analysis of protein gel blots, for each cell line, before and after treatment (white and black bars, respectively). (F,H) Bar graphs (left panels) show the ratio of LC3B-II/AP2A1 protein levels per BC subtype, considering LumA (T47D, CAMA-one), HER2 (BT474, MDA361, SKBr3, MDA453, HCC1569) and TN (MDA231, MDA436, MDA468, HCC70, BT549) BC cell lines and (right panels) the autophagy flux as the ratio of LC3B-II protein level after/before treatment (BafA1- or Chloro-treated/Untreated, NT). Data are shown as means +/− sem (N = 3 independent experiments). p-values are based on the Student t test.](/cms/asset/e5713255-fea1-446c-bada-ae96ea5226a9/kaup_a_981788_f0003_c.jpg)
Inhibition of the autophagic maturation step (i.e., the last step during which autophagosomes fuse with lysosomes) could also lead to an accumulation of LC3B and autophagosomes. To establish whether the observed autophagosomes accumulation in TN cell lines reflected an active autophagy rather than a defect in autophagosome-lysosome fusion, LumA, HER2, and TN BC cell lines were treated with either BafA1 () or chloroquine (), 2 established inhibitors of this process. Upon treatment with these drugs, all tested LumA, HER2, and TN cell lines displayed an increase in LC3B-II protein levels (), confirming that autophagy flux is not impaired in the studied BC cell lines. Importantly, following treatment, we still observed significantly higher LC3B-II protein levels in TN BC cell lines, when compared to HER2 or LumA BC cell lines ( and ). Indeed, the highest LC3B-II level following these treatments was detected in the 3 TN BC cell lines (MDA436, MDA231 and BT549) harboring the highest basal LC3B-II levels, without any treatment ( and ). Moreover, in MDA231 cells expressing a GFP-RFP-LC3B construct, there was an increase in the formation of autolysosomes (red puncta), when cultured in poor nutrient conditions (EBSS medium; Fig. S6C and D), showing that LC3B-II accumulation was not due to impaired flux in these cells. Functional autophagic flux was also confirmed in high LC3B TN cell lines treated with EBSS in the presence or not of BafA1 (Fig. S6E). Finally, following treatment of LumA, HER2 and TN BC cell lines by BafA1 or chloroquine, the “treated/basal” ratio of LC3B-II protein levels also showed an active autophagy flux ( and ). Thus, these results indicate that the high number of autophagosomes observed in some TN BC cell lines does not result from a block of autophagic flux. Taken together, these data demonstrate that a subset of TN cell lines exhibits elevated LC3-II and autophagosome numbers in the presence of maintained autophagic flux. These results are consistent with our observations on TN BC patients; half of which exhibit high LC3B-II protein levels and poor prognosis, and the other half being characterized by low LC3B-II and longer survival. Thus, observations made on both TN cell lines and TN patient tumors suggest that high LC3B-II protein levels in a subset of TN samples is associated with functional autophagy and predicts poor survival.
High basal autophagy supports TN tumor cell proliferation and matrix invasion
Several of the TN cancer cell lines that were assessed are highly invasive and have the capacity to grow in 3-dimensional (3D) culture to form “stellate” structures.Citation38 In contrast, LumA or HER2 cell lines cultured in such conditions do not form stellate, but rather “mass” or “grape-like” structures. This phenotype is indicative of their poor capacity to grow and invade the matrix.Citation38 As shown above, the level of LC3B-II protein was higher in a subset of TN cells compared to other BC subtypes (). Notably, the level of LC3B-II in each cell line was related to the stellate phenotype (). Specifically, the HCC70 cell line had the lowest LC3B-II protein level among the 5 TN cell lines analyzed and formed only “mass” structures (); the MDA468 cell line, characterized by an intermediate LC3B-II protein level, produced a “grape-like” phenotype; MDA231, MDA436, and BT549 cell lines exhibited the highest LC3B-II protein levels and produced “stellate” structures in 3D-conditions (), suggesting a potential link between autophagy and the capacity of TN cells to form invasive structures in 3D culture.
Figure 4. For figure legend, see page 2131. Figure 4 (See previous page). High basal levels of autophagy support TN tumor-cell proliferation and invasion. (A) Representative bright field images from the indicated TN cell lines following 3 d of 3D culture. Scale bars = 100μm. (B-D) Results are from MDA231 TN cells transiently transfected with control- (Ctrl), BECN1- or ATG5-targeted siRNA. 48 h post-transfection, the cells were grown in 3D culture during 3 d, and maintained in 3D conditions for 3 d. (B) Western blots showing BECN1, ATG5 and LC3B-I/-II protein levels in MDA231 TN cells. AP2A1 is used as an internal control for protein loading. (C) Representative bright field images from MDA231 TN cells +/− siRNAs, as indicated. Scale bars = 100 μm (low magnification) and 50 μm (high magnification). (D) Bar graphs represent the total area covered by the stellate structures per field (left panel) (a total area of 0.85 mm2 has been evaluated; arbitrary unit, a.u) and the area per clone (right panel), as determined using Metamorph software. Data are from MDA231 TN cells +/− siRNAs, as indicated. Data show means +/− sem (N = 3 independent experiments). (E,F) Results shown are from a Transwell invasion assay using MDA231 TN cells transiently transfected with control- (Ctrl), BECN1-, ATG5- or ATG7-targeted siRNA for 72 h prior to the assay. (E) Western blots showing BECN1, ATG5, and ATG7 protein levels in MDA231 TN cells after transfection by the respective siRNA, prior to the Transwell assay. AP2A1 is used as an internal control for protein loading. (F) Invasion assay using a BioCoatTM MatrigelTM Invasion Chamber from autophagy-proficient (siCtl) or -deficient (siBECN1, siATG5, siATG7) MDA231 TN BC cells. Left histogram: Numbers of invading cells, which passed through the Transwell over 6 h of incubation. Right panel: Percentage of cells, relative to siCtrl (100%), which passed through the Transwell over 6 h of incubation. Data are shown as means +/− sem (N = 3 independent experiments). p-values are based on the Student t test. (G-K) Results are from MDA231 or BT549 cell lines stably expressing shRNA (referred to as shCtrl, shATG5 or shATG7) and cultured in 3D conditions. (G) Western blots show ATG7, ATG5, and LC3B protein levels in stable cell lines following 3D culture. AP2A1 is used as an internal control for protein loading. (H) Representative bright field images from MDA231 and BT549 TN cell lines stably expressing shRNAs, as indicated, following 3D culture. Scale bars = 100 μm (low magnification) and 50 μm (high magnification). (I) Bar graphs show the total number of cells extracted after 3 d of 3D culture. Results are from MDA231 and BT549 cell lines stably expressing shRNA (referred to as shCtrl, shATG5 or shATG7). Data are shown as means +/− sem (N = 3 independent experiments). (J,K) Bar graphs represent the total area of the stellate structures per field (left panel) or the area per clone (right panel). Data are shown as means +/− sem (N = 3 independent experiments) from stably silenced cell lines derived from MDA231 (H) or BT549 (I) cells. p-values are based on the Student t test.
We postulated that autophagy may play a key role in proliferation and invasion of TN cells harboring high LC3B-II protein levels. Indeed, these TN cells could be reminiscent of high-LC3B TN patients with poor prognosis, for whom autophagy could give a selective growth advantage. To test this hypothesis, we investigated the consequences of short-term ( and Fig. S7) and long-term ( and Fig. S8) silencing of key autophagy proteins. We verified that efficient depletion could be achieved using different siRNA targeting ATG5 or BECN1 ( and Fig. S7A and D). As expected, the levels of LC3B-II were reduced in cell lines depleted for ATG5 or BECN1 ( and Fig. S7A). The capacity of these autophagy-deficient cells to form “stellate” structures was also dramatically impaired ( and Fig. S7B and E). Although the number of clones was not different between control and siRNA-transfected cells (number of clones: 62.9 ± 2.7; 71.7 ± 13.8; 63 ± 4.4 for siCtrl, siBECN1 and siATG5 transfected cells, respectively, N ≥ 3 independent experiments, p = NS by Student's test), the total surface covered by these structures was significantly smaller than in control cells (, left and Fig. S7C and F, left). Moreover, the average area of each clone was also significantly smaller (, right and Fig. S7C and F, right). Finally, the involvement of autophagy in tumor-cell invasion through the surrounding matrix was demonstrated by a matrigel-coated Transwell assay, with a time of experiment (6 h) less than the doubling time of the cells (+/− 28 h) ( and and Fig. S7G). Together, these data indicate that inhibition of autophagy reduces the ability of high-LC3B-II TN BC cells to proliferate and to invade into the 3D matrix.
The requirements for autophagy in stellate body areas and TN cell proliferation were confirmed by stable shRNA inactivation of key autophagy proteins, ATG5 and ATG7 (). Each protein was efficiently silenced by different shRNAs and we confirmed that their depletion efficiently blocked the conversion of LC3B-I into LC3B-II (Fig. S8A). As expected, LC3B-II protein levels were reduced in the different autophagy-deficient established cell lines ( and Fig. S8B and D). The capacity of such cells to form “stellate” structures in 3D culture was significantly impaired in autophagy-deficient cells ( and Fig. S8C and E). The number of cells was significantly reduced in ATG5- and ATG7-silenced cells compared to control cells, indicating that autophagy regulates cell proliferation in 3D ( and Fig. S8C and E, right). Moreover, although the number of clones was equivalent between the different cell lines (shCtrl: 86.3 ± 5.7; shATG5: 111.2 ± 9.4; shATG7: 90.3 ± 9.5; N ≥ 4 independent experiments; p = NS by the Student t test), both total area and average area per “stellate” body were significantly decreased in autophagy-deficient cells ( and and Fig. S8C and E, left). Overall, our data from transient and stable inhibition demonstrate that autophagy is required for the growth of high-LC3B TN BC cells.
The transcription co-activator YAP1 is involved in autophagy-dependent proliferation and invasion of TN BC cells
While autophagy regulated the growth of high-LC3B TN cells in 3D conditions (), we repeatedly observed that TN BC cell proliferation was much less perturbed by impaired autophagy in 2D culture (Fig. S9A). We thus next wondered if the transcription co-activator YAP1, one of the core targets of the Hippo-kinase cascade and a well-known actor in physical interaction with surrounding matrix,Citation39 could be a link between autophagy and the observed phenotype. We first observed that the rate of the phosphorylated form of YAP1, corresponding to its inactive state, was significantly increased when autophagy was impaired, showing that YAP1 accumulated preferentially in its inactive form in autophagy-deficient cells ( and S9B and C). Consistently, the expression of several YAP1/TEAD-target genes was significantly reduced by inactivation of either ATG5 or ATG7 ( and S9D). The inhibition of YAP1 activity, evaluated by the ratio of phosphorylated YAP1 (P-YAP1)/YAP1, in ATG5- and ATG7-depleted cells, was related to the efficiency of YAP1-target gene inhibition, with a higher efficiency of ATG7-inhibition compared to ATG5 (). As YAP1 could be regulated by ATG7, through an autophagy-independent mechanism, we sought to validate the impact of autophagy on YAP1 phosphorylation by using 3-MA (an autophagy inhibitor at short-term use) ( and ) or rapamycin (an autophagy inducer) ( and ) in 3D conditions. We confirmed that autophagy inhibition increased the phosphorylation rate of YAP1 and subsequently reduced its transcriptional activity ( and ). Conversely, induction of autophagy reduced YAP1 phosphorylation, further upregulating YAP1-target genes ( and ). Taken as a whole, these observations show that modulating autophagy, either chemically or by gene silencing, has a significant impact on YAP1 activity. We thus analyzed if YAP1 silencing was sufficient to mimic autophagy inhibition. Inactivation of YAP1 by siRNA in autophagy-proficient cells phenocopied ATG5 and ATG7 silencing (). Indeed, YAP1 depletion in high-LC3B TN BC cells reduced the number of cells (20%, p = 0.02), the formation of “stellate” structures in 3D culture (), and the invasion of surrounding matrix, as assessed by Transwell experiment (), indicating that YAP1 depletion mimicked the effects of autophagy inhibition on TN BC cells. Importantly, expression of a nonphosphorylable and constitutively active mutant form of YAP1, YAP1-S127A, in autophagy-deficient cells was sufficient to rescue the proliferative and invasive properties of TN BC cells ( and and S9E), demonstrating that YAP1 inactivation was essential for the phenotype observed in autophagy-deficient cells. These data thus indicated that 3D autophagy-dependent growth of TN BC cells are, at least in part, mediated through YAP1.
Figure 5. For figure legend, see page 2133. Figure 5 (See previous page). The transcription co-activator YAP1 is a key player in the autophagy-dependent proliferation and invasion of TN BC cells. (A) Western blots showing phosphorylated-YAP1 (P-YAP1), YAP1, and AP2A1 proteins in stable cell lines following 3D culture. AP2A1 is used as internal control for protein loading. The bar graph (right panel) shows the corresponding quantification of P-YAP1/YAP1 protein level ratios. (B) mRNA levels of YAP1-target genes were monitored by RT-qPCR following 3D culture. GAPDH is used as an internal control for total mRNA expression. (C) Western blots (left) and corresponding quantification (bar graph, right) showing phosphorylated-YAP1 (P-YAP1), YAP1 and AP2A1 proteins in MDA231 cells cultured during 3 d in 3D and then either untreated (-) or treated with 3-methyladenine (3-MA; 20 mM) for 3 h. (D) mRNA levels of YAP1-target genes were monitored by RT-qPCR following 3-MA treatment. GAPDH is used as an internal control for total mRNA expression. (E) Western blots (left) and corresponding quantification (bar graph, right) showing phosphorylated-YAP1 (P-YAP1), YAP1 and AP2A1 proteins in MDA231 cells cultured during 3 d in 3D and then either untreated (-) or treated with rapamycin (2 μM) for 3 h. (F) mRNA levels of YAP1-target genes were monitored by RT-qPCR following rapamycin treatment. GAPDH is used as an internal control for total mRNA expression. (G) Left, western blots showing YAP1 protein levels in MDA231 cells after transfection with control- (siCtrl) or YAP1-targeted (siYAP1) siRNA. AP2A1 is used as an internal control for protein loading. Middle, representative bright field images from Control- or YAP1-depleted cells cultured in 3D, as indicated. Scale bars = 100 μm (low magnification) and 50 μm (high magnification). Right, the bar graphs represent the total area covered by the stellate structures per field (left panel) and the area per clone (right panel). Data are shown as means +/− sem (N = 3 independent experiments). p-values are based on the Student t test. (H) Invasion assay using a BioCoatTM MatrigelTM Invasion Chamber from MDA231 cells transiently transfected with control- (siCtrl) or YAP1-targeted (siYAP1) siRNA. for 72 h prior to the assay. Left histogram: Numbers of invading cells, which passed through a Transwell over 6 h of incubation. Right panel: Percentage of cells, relative to siCtrl (100%), which passed through a Transwell over 6 h of incubation. Data are shown as means +/− sem (N = 3 independent experiments). p-values are based on the Student t test. (I) Invasion assay using a BioCoatTM MatrigelTM Invasion Chamber from autophagy-deficient MDA231 cells (36 h of transfection with siATG7 or siATG5, as indicated), transfected again (36 h) with an empty vector or a vector expressing YAP1-S127A, a nonphosphorylable mutant form of YAP1. Numbers of invading cells, which passed through a Transwell over 6 h of incubation, are shown. Data are shown as means +/− sem (N = 3 independent experiments). p-values are based on the Student t test. (J) Results are from autophagy-proficient (shCtrl) or autophagy-deficient (shATG5) MDA231 cells, transfected with an empty vector or a vector expressing YAP1-S127A, after 3 d of 3D culture. Representative bright field images from ATG5-depleted cells expressing or not YAP1-S127A, as indicated. Scale bars = 100 μm (low magnification) and 50 μm (high magnification). Bar graphs represent the total area covered by the stellate structures per field (left panel) and the area per clone (right panel). Data are shown as means +/− sem (N = 5 independent experiments). P-values are based on the Student t test.
High basal autophagy supports the tumorigenesis of human TN cells engrafted into mice
Due to this high impact of autophagy in 3D culture, we next investigated the role of autophagy in tumorigenesis. We subcutaneously grafted autophagy-competent or -deficient TN cells into nude mice. Fifty-seven d post-grafting, the tumors that formed were removed and analyzed to confirm the persistence of ATG5 and ATG7 protein silencing ( and ). Tumors derived from ATG5- or ATG7-deficient cells exhibited lower LC3B-II protein levels than control tumors ( and ), consistent with the block of autophagy being efficient. Although tumors that developed from control cells first became palpable between 15–20 d post-grafting, those arising from autophagy-deficient cells exhibited a longer latency (22–33 d post-grafting). In the case of ATG7-deficient TN cells, no tumor developed in 40% of the cases (). Furthermore, cells deficient for ATG5 or ATG7 were significantly slower to develop into tumors, and the associated endpoint tumor volumes were significantly smaller (67% and 78% reductions for ATG5- and ATG7-depleted tumors, respectively, relative to the volumes of control tumors; ). An analysis of tumor weight corroborated the data for tumor volume, confirming that inhibiting autophagy significantly impaired TN tumor growth in vivo ().
Figure 6. High basal levels of autophagy support TN tumorigenesis in mouse models. (A) Western blots showing LC3B-I/-II, ATG5 and ATG7 protein levels extracted from tumors of MDA231 cell lines stably expressing shCtrl, shATG5 or shATG7 and xenografted into mice. Each lane corresponds to an individual tumor (n ≥ 10 tumors analyzed per group. Note that 4 tumors did not develop at all in the ATG7-deficient condition). ACTB/β actin was used as an internal control for protein loading. (B) Corresponding quantification of the ratio of ATG5/ACTB, ATG7/ACTB or LC3B-II/ACTB protein levels in controls and ATG5- or ATG7-deficient tumors. Data are means +/− sem (N ≥ 10 per group). p-values are from the Student t test. (C) Tumor growth curves over time from xenografted MDA231 cell lines stably expressing shCtrl, shATG5 or shATG7, as indicated. Data presented are means +/− sem (N ≥ 10 per group). p-values are based on 2-way analysis of variance. (D) Graph shows the final weight of each tumor in each group. p-values are based on the Student t test.
Chloroquine potentiates chemotherapy in a mouse model of human primary TN BC
We next investigated the ability of chloroquine, a well-known inhibitor of autophagy, to influence tumorigenesis of TN BC. Chloroquine, which blocks fusion between autophagosomes and lysosomes, is a clinical drug commonly used to treat malaria.Citation40 We first confirmed that the use of chloroquine in high-LC3B TN BC cells, at 2 distinct doses led to an increase in LC3B-II protein levels (). Moreover, consistent with our data from interfering with genes essential for autophagy, chloroquine application led to severe impairment of the proliferation and invasive capacities of TN cell lines (as assessed by stellate formation in 3D and matrigel-coated Transwell experiments; ). Of note, the strong effect of chloroquine on cell number () was mainly due to proliferation inhibition since chloroquine treatment did not induce massive cell death ().
Figure 7. For figure legend, see page 2136. Figure 7 (See previous page). Chloroquine potentiates chemotherapy in a PDX model of high-LC3B TN BC. (A) Western blots showing LC3B-I/-II protein levels in MDA231 TN BC cell line untreated (Ctrl) or treated for 3 d with 2 doses of chloroquine (Chloro; 7.5 or 15 μM), as indicated. AP2A1 and GAPDH are used as internal controls for protein loading. (B) Representative bright field images of MDA231 TN BC cells cultured in 3D conditions. Cells are either treated with PBS (Ctrl) or treated with 2 doses of chloroquine, as indicated. Scale bars = 100 μm, (low magnification) and 50 μm (high magnification). (C) The bar graph represents the total area per clone upon chloroquine treatment, as determined using Metamorph software. Data are shown as means +/− sem (N = 3 independent experiments). p-values are based on the Student t test. (D,E) Bar graphs show the total number of cells (D) and the percentage of live cells, as assessed by trypan blue-negative cells, (E) after 3 d of 3D culture. Results are from MDA231 cells either treated with PBS (Ctrl) or treated with 2 doses of chloroquine, as indicated. Data are shown as means +/− sem (N = 3 independent experiments). p-values are based on Student t test. (F) Invasion assay using a BioCoatTM MatrigelTM Invasion Chamber from MDA231 cells, either untreated (Ctl) or treated with (50 μM) of chloroquine overnight. Left histogram: Numbers of invading cells, which passed through a Transwell over 6 h of incubation. Right panel: Percentage of cells, relative to siCtrl (100%), which passed through a Transwell over 6 h of incubation. (G) Tumor growth curves over time of a high-LC3B PDX model. When tumors reached 50 mm3, mice were treated either with PBS (Ctrl), AC (adriamycin and cyclophosphamide), chloroquine, or a combination of AC and chloroquine, for 31 d. Relative tumor volumes are presented as means ± sem (N ≥ 10 mice per group). p-values are based on 2-way ANOVA test. (H) Graph shows the final weight of each tumor in each group (n ≥ 10 per group). p-values are based on the Student t test. (I) The bar graph shows the number of mice without (white) or with (black) lung metastases, as assessed by the detection of human-specific Alu sequences in RNA extracted from mouse lung. N ≥ 10 animals per condition. p-value is based on Fisher's exact test. (J) Upper Panel, tumor growth inhibition (defined as % of tumor volume before treatment) is shown for each mouse following AC treatment, administration of chloroquine alone or a combination of AC + chloroquine, as indicated. Lower Panel, quantification in each mouse of lung colonization by tumor cells. Lung colonization was quantified by the detection of human-specific Alu sequences. Lung metastases are quantified after 31 d of treatment with AC, chloroquine or AC + chloroquine, as indicated. N ≥ 10 tumors for each condition. Numbers below each graph represents the tag number of each mouse.
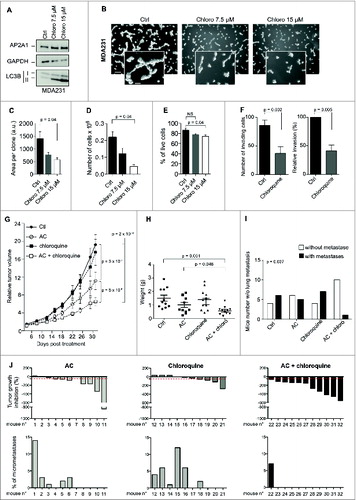
In most cases, the TN BC patients of the cohorts analyzed in this study had been treated with both adriamycin and cyclophosphamide (AC treatment). As shown in and , those with low basal levels of LC3B protein and autophagosomes exhibited a better survival rate than patients with high autophagy, suggesting that inhibiting autophagy may increase chemosensitivity. We thus investigated the effect of combining chloroquine with AC treatment in a model of TN PDX. Among different models, the HBCx-12 was selected based on its high LC3B histological score, a model previously described in ref. 41. Whereas AC treatment led to a tumor growth inhibition (TGI) of 42% and chloroquine itself had no significant impact on tumor growth in vivo, the combination of chloroquine treatment with AC treatment significantly improved the TGI, up to 66%. This represents an additive inhibition of 41% compared to AC treatment alone (). Consistent with these findings, tumor weight was lower in the AC + chloroquine group than in the other groups (). In addition, the number of mice with lung-metastases was significantly reduced by the combined treatment of AC + chloroquine (), with the TGI being negatively associated with the number of lung micrometastases (). Taken together, these results identify chloroquine as a promising therapeutic option for improving existing AC treatments for TN BC patients.
Discussion
By combining analyses of independent cohorts of BC patients, 3D culture experiments and mouse models, our study reveals autophagy as a new prognostic factor and a promising chemotherapeutic target in treating TN BC patients with high LC3B protein levels. Given the emerging recognition that autophagy is central to cell homeostasis, studies carried out in recent years have investigated the expression levels of autophagy-related proteins in a variety of cancers. In breast carcinomas, it has remained a matter of intense debate whether autophagy suppresses or promotes tumor growth.
Our study is the first to provide compelling evidence that high levels of LC3B and autophagy play roles in tumorigenesis in, and the chemosensitivity of, a subset of TN BC patients. To our knowledge, no other study has exhaustively investigated the mRNA levels of major autophagy-related genes in breast tumors and their impact on the survival of BC patients. Notably, MAP1LC3B, which encodes LC3B, is the only autophagy-related gene to show a significant impact on the survival of BC patients, especially in the TN subtype. Moreover, LC3B was identified as a reliable indicator of poor prognosis in several cohorts of BC patients, at both mRNA and protein levels. Furthermore, LC3B was indicative of functional autophagy in TN patients, with LC3B protein levels correlating positively with the number of autophagosomes. Consistent with this finding, the proportion of autophagosomes was associated with a poor survival rate in TN patients. Even though previous studies showed that LC3B protein is highly expressed in TN BC,Citation31,32 they provided only preliminary observations on the extent to which autophagy influences the survival of these patients. Here we provide several lines of evidence in support of the accuracy of LC3B as a prognostic marker for BC patients, in particular for the TN subtype. The strength of our work relies on 2 important points: first, our study is based on several independent cohorts in which LC3B expression levels significantly correlate with TN patient survival; second, we demonstrate that LC3B accumulation in TN cells is indicative of functional autophagy, in a context of maintained flux. Therefore, our work reveals that high LC3B protein levels and autophagy play key roles in BC tumorigenesis, especially in a subset of TN patients.
Consistent with the fact that LC3B is upregulated in a significant subgroup of TN tumor samples, we demonstrate that autophagy plays a key role in the transformation of high-LC3B TN cell lines, acting both on proliferation and invasion. Whereas previous reports indicated that high autophagy supports tumor growth and survival in several human cancers or human cancer cell lines,Citation42,43 this was not carefully addressed in BC. Although basal levels of autophagy are high in several TN tumor cells cultured in both 2D and 3D conditions, they confer a selective advantage for cell growth in the 3D environment. Indeed, when any of 3 essential autophagy-related genes (ATG5, ATG7, or BECN1) is silenced, the impact on cell proliferation is much bigger in 3D culture than in 2D. Similarly, the prosurvival autophagic pathway predominates in cells cultured as spheroids vs. monolayers.Citation42,44 As we also show that autophagy is important for the ability of high-LC3B TN cancer cells to invade the surrounding matrix, these data underscore the reciprocal crosstalk between autophagy and the tumor microenvironment. These observations argue that the physical and architectural features of the surrounding environment are important for the autophagy-related phenotype in BC. In agreement, the transcription co-activator YAP1 is modulated by autophagy in TN BC cell lines. Autophagy inhibition reduces its activity and the expression of several downstream target genes; conversely induction of autophagy decreases YAP1 phosphorylation and subsequently increases its activity. Analyzing BC samples from 12 LumA and 11 TN tumors, we did not find any significant differences among P-YAP1 levels (data not shown). Nevertheless, autophagy is not the only regulator of YAP1 phosphorylation. Indeed, mutations and/or epigenetic silencing of several Hippo pathway proteins have been found in several human cancers,Citation45,46 and could explain why we do not observe difference between BC samples. Moreover, the forced expression of a constitutively active YAP1 mutant form is sufficient to rescue autophagy inhibition. These observations strongly suggest that induction of autophagy promotes YAP1 activity, further stimulating proliferation and invasion of high-LC3B TN BC cells. Consistent with this idea, the activity of the transcriptional co-activator YAP1 is known to be confined to cells exposed to mechanical tension.Citation47,48 This regulation was shown to require the Rho GTPases and tensions of the actin cytoskeleton,Citation39 suggesting mechanical tension and the surrounding matrix may have a key role in autophagy-mediated YAP1 activity. Accordingly, autophagy-inhibition has an impact on high-LC3B TN BC cells only in 3D cultured-conditions. Moreover, YAP1-target genes misregulated upon autophagy inhibition are involved in matrix remodeling, cell migration and invasion, further reflecting tumor progression in vivo. Yet, we have not identified the mechanism by which autophagy inhibition reduces YAP1 activity. One possibility could be that autophagosomes trap and subsequently degrade YAP1 regulators and/or activators. Alternatively, the link between autophagy and YAP1 could be mediated by a dual function partner, such as BAG3. Indeed, the chaperone BAG3, which is implicated in chaperone-assisted selective autophagy and is essential for the adhesion and migration of BC cells, can interact with YAP1 inhibitors and promote YAP1 release.Citation49,50 Thus, YAP1 and autophagy emerge as crucial determinants of the oncogenic properties in the context of TN BC, but future research will be needed to dissect how autophagy regulates YAP1.
The deleterious effects of autophagy on high-LC3B TN patient survival may be linked to the chemotherapeutic agents administered to these patients. A combination of AC is used to treat TN BC patients, with taxanes recently included in the first-line treatments. With-in the cohorts considered in our IHC study, TN BC patients with low LC3B expression responded better to AC treatment than counterparts characterized by high LC3B expression. A study by Lazova et al. found that, although LC3B accumulates in estrogen- and progesterone-negative BC patients, this feature was not indicative of their survival.Citation30 This could be due to the fact that this cohort of patients has been treated (between 1962 and 1980) with surgery and/or local radiation, but not by chemotherapy. This suggests that the use of AC could be important to unraveling the impact of LC3B levels on the survival of TN patients. In that sense, most of the chemotherapeutic agents could contribute to activation of the autophagic process in tumor cells,Citation51-53 facilitating their evasion of treatment. The molecular mechanisms that support drug resistance in the context of elevated autophagy remain elusive. One hypothesis is based on the antistress effect of autophagy.Citation10,54,25 Indeed, autophagy may help tumor cells to clear the drug-induced damage, thereby decreasing the impact of chemotherapy.Citation55 As autophagy is elevated and required for the maintenance of cancer stem cells,Citation44 we can also postulate that the high level of LC3B in a subset of TN BC could be due to the presence of a large number of such cells. Indeed, a body of evidence suggests that cancer stem cells enhance drug resistance.Citation56,57 Consistent with this idea, YAP1 that we identified here as a key actor of the autophagy-mediated effect on TN BC cells exerts key roles in cancer stem cell maintenance.Citation58,59 Finally, autophagy promotes immunogenic cell death, a mechanism that promotes elimination of cancer cells by the immune system.Citation64,65 In mouse models of fibrosarcomas and colon carcinomas, autophagy-proficient tumor cells respond to chemotherapy only in immuno-competent mice.Citation66 Conversely, in the context of BC, autophagy impairs cell susceptibility to T-cell-mediated lysis during the epithelial-to-mesenchymal transition.Citation67 Accordingly, we observed that autophagy, as assessed by LC3B or autophagosome number, has either no association with (Lum and HER2 subtypes) or a negative impact on (TN subtype) the survival of BC patients. Moreover, the fact that our transcriptomic analysis did not reveal a significant correlation between known immune signatures and low or high MAP1LC3B expression (data not shown) supports the notion that Th1-mediated immunity does not have an impact on overall survival in the TN subtype.Citation68
Given the role of autophagy in chemoresistance, chloroquine or any other more specific inhibitor of autophagy could potentiate AC treatment and be considered as an interesting additional therapy for TN BC patients. In contrast to ATG5- and ATG7-silenced cells, chloroquine alone was not sufficient to decrease TN tumor growth, possibly because it blocks the fusion between autophagosomes and lysosomes, while shATG5 and shATG7 block the initial steps of autophagosome formation. Moreover, while chloroquine is given when the tumor is already palpable, autophagy inhibition occurs as soon as a tumor is initiated in TN cells stably expressing shATG5 or shATG7. Similarly, chloroquine alone neither has an affect on tumor growth nor improves the radiosensitization of a mouse model of breast 4T1 cell-derived tumors.Citation60 Even if chloroquine could still impair tumor growth in vivo through additional mechanisms than autophagy, such as through cellular acidification, our data confirm that autophagy inhibitors can increase the efficiency of anticancer drugs, as has been shown in cancers other than BC.Citation23,52,61-63
In conclusion, we have identified a population of TN BC patients, in which LC3B and autophagosome levels are high in the context of maintained autophagic flux, and we have shown that this feature is indicative of poor survival. These observations will be of particular importance in the treatment of those patients who do not respond well to common chemotherapies; this population could potentially benefit from the inclusion of inhibitors of autophagy in current treatments.
Materials and Methods
Cohorts of breast cancer patients
Analyses based on the Curie cohort were approved by the Institutional Review Board and Ethics committee. Before inclusion in the study, patients were informed that their biological samples could be used for research purposes and that they had the right to refuse if they so wished. Analysis of tumor samples was performed according to the relevant national law on the protection of people taking part in biomedical research. HER2-amplified carcinomas have been defined according to ERBB2 immunostaining using ASCO's guideline. LumA tumors were defined by positive immunostaining for ESR (estrogen receptor) and/or PGR (progesterone receptor). The cut-off used to define hormone receptor positivity was 10% of stained cells. Among invasive ductal carcinomas, the TN immunophenotype was defined as follows: ER− PR− HER2− with the expression of at least one of the following markers: KRT5+ or KRT72/KRT6+, EGFR+, KIT+. The Curie cohort was composed of 130 BC patients, including 29 LumA, 30 LumB, 30 HER2, and 41 TN BC patients. Tumor grade was evaluated using Elston-Ellis grading.
Patient characteristics and clinical features of the cohorts referred to as Stockholm, Marseille, and TCGA have been previously described in refs. 35, 36, and https://tcga-data.nci.nih.gov/tcga/. For these cohorts, the subtypes have been defined according to the same classification as described above, namely: LumA (ER+ and/or PR+, HER2−), LumB (ER+ and/or PR+, HER2−), HER2 (ER−, PR−, HER2+), TN (ER−, PR−, HER2−). The 5 BC cohorts were examined for information on tumor size (pT), mean age at diagnosis, number of retrieved and metastatic axillary lymph nodes (pN), number of distant metastases (pM), hormonal receptor status, the site and date of relapse, the date and cause of death, and the type of therapy used (hormono-, chemo-, radio-therapies). Patient characteristics and clinical features of the different cohorts analyzed in our study are listed in Table S1, helping in their comparison.
Breast microarray data sets and gene expression profiling
In a first step, we combined breast tumor micro-array data sets from the Institut Curie (Curie) and the Karolinska Institute Stockholm (Stockholm), in order to increase the number of TN BC patients, and further enhance the power of analysis. The Curie microarray dataset is freely accessible in the Gene Expression Omnibus (http://www.ncbi.nlm.nih.gov/geo), under accession number GSE45827. Samples were hybridized on Affymetrix U133 plus 2.0 arrays. Data were first normalized using the GC-RMA algorithm (R version 2.14.1; http://cran.r-project.org). A linear mixed model was then applied using the nlme package to estimate fixed effects related to array batches and hybridization series. Following GC-RMA normalization, only genes with a log2 intensity greater than 4 in at least 5% of all samples were considered for the analysis. This filter reduced the number of probesets from 54,673 to 29,873. The Stockholm data set was retrieved from the Gene Expression Omnibus under accession number GSE1456. These 2 datasets, Curie and Stockholm, were combined using 27,482 probesets in common and the intensity levels were standardized (mean equal to 0 and standard deviation equal to 1) in order to avoid batch effect. Each sample was classified into a 'high' or 'low' sub-group according to MAP1LC3B mRNA levels in every tumor subtype.
The Marseille data set was retrieved from Gene Expression Omnibus under accession number GSE21653.
The TCGA transcriptome dataset is publicly available from The Cancer Genome Atlas website (https://tcga-data.nci.nih.gov/tcga/).
The gene expression data set for BC cell lines (Affymetrix Human Genome U133 Plus 2.0 Array) comes from the Gene Expression Omnibus under accession number GSE36133.
qRT-PCR
Human RNAs were analyzed for MAP1LC3B expression using real-time reverse transcription-PCR (RT-PCR). The RT-PCR protocol using the SYBR Green Master Mix kit (Applied Biosystems, 4367659) on the ABI Prism 7900 Sequence Detection System (Perkin-Elmer Applied Biosystems, Foster City, CA) is described in detail in ref. 69. The primer pairs for the MAP1LC3B gene were selected to be unique when compared with the sequences of the other MAP1LC3 family genes. Two different sets of primers were used for real-time RT-PCR amplification of MAP1LC3B (forward and reverse primers): (1) 5′-CCGCACCTTCGAACAAAGAGTA- 3′ and 5′-TGCTTCTCACCCTTGTATCGTTCTA-3′; (2) 5′-CGCGTCGCGAGTCACCTGA-3′ and 5′-TGGCGATAGCCACTTCCCTTGT-3′. MAP1LC3B mRNA levels were determined as the mean of the Ct values obtained from the 2 independent pairs of primers. We also quantified TBP (TATA box binding protein), RPLP0 (ribosomal protein, large, P0) and PPIA [peptidylprolyl isomerase A (cyclophilin A)] mRNA levels, as endogenous RNA controls for the total amount of RNA in each tumor sample or cell line. We normalized MAP1LC3B mRNA levels on the basis of the mean expression rates of the 3 control genes. Primers used for quantitative RT-PCR amplification were: TBP, 5′-TGCACAGGAGCCAAGAGTGAA-3′ and 5′- CACATCACAGCTCCCCACCA-3′; RPLP0, 5′- GGCGACCTGGAAGTCCAACT-3′ and 5′- CCATCAGCACCACAGCCTTC-3′; PPIA, 5′- GTCAACCCCACCGTGTTCTT-3′ and 5′ CTGCTGTCTTTGGGACCTTGT-3′. Total RNA extraction, cDNA Synthesis and PCR reaction conditions have been described previously.Citation69 Results, expressed as relative MAP1LC3B gene expression were determined as Relative MAP1LC3B = 2−Ct MAP1LC3B/(mean (2−Ct TBP; 2−Ct RPLP0; 2−Ct PPIA), where the Ct value of the sample was determined by the average Ct value of the Ct from 2 sets of primers for MAP1LC3B. For measuring mRNA levels of YAP1-target genes, we used the following primers: ARHGAP29 5′-TTGGAATTCAGGAGTTCATGC-3′ and 5′-TCCAAGTAGAGGCTGCACA-3′; CTGF 5′-AGGAGTGGGTGTGTGACGA-3′ and 5′-CCAGGCAGTTGGCTCTAATC-3′; CYR61 5′-GAGTGGGTCTGTGACGAGGAT-3′ and 5′-GGTTGTATAGGATGCGAGGCT-3′; GAS6 5′-TGCTGTCATGAAAATCGCG-3′ and 5′-CATGTAGTCCAGGCTGTAG-3′.
For lung metastasis detection in PDX tumors, the real-time PCR makes it possible to detect human RNA from mouse tissues. The presence of human cells within the host organ was quantified by means of the transcript of human genes highly and exclusively represented in the human genome (Alu sequences). This method applied to the xenograft models greatly enhances the sensitivity of detection of invading human cells within lung tissues. Alu transcripts were considered to be detectable and quantifiable when the Ct value was below 35, and not detectable when the Ct value was above 35. The primers used for detection of Alu sequence were the following: 5′-TCACACCTGTAATCCCAGCACTTT-3′ and 5′-GCCCAGGCTGGAGTGCAGT-3′;
Immunohistochemical stainings
Sections of paraffin-embedded tissue (3 μm) were stained using a streptavidin-peroxidase protocol (Vectastain ABC kit; Vector Labs, PK-6101) and the Benchmark immunostainer (Ventana, Illkirch, France) with specific antibodies recognizing LC3B (1:200; NanoTools, 0231–100/LC3–5F10).Citation70 For the Curie cohort, tissue micro-array from 27 LumA, 37 LumB, 33 HER2 and 40 TN tumors were composed using 3 cores of tumor tissue per case, and 1 core of normal tissue (1-mm diameter each), and hybridized simultaneously. For the Saint-Cloud cohort of patients, total sections from 89 TN tumors were analyzed by IHC using LC3B antibody. For quantification, histological scores (Hscores) were provided as a function of the percentage of positive cells multiplied by the staining intensity (ranging from 0 to 4). Two different investigators blindly evaluated 3 sections from distinct areas of each tumor.
Automated quantification of LC3B IHC was performed independently and blindly by FluoFarma® (www.fluofarma.com). Twenty-seven LumA, 37 LumB, 33 HER2 and 40 TN tumors were analyzed. The image analysis was performed using the following procedure:
Foreground/Background segmentation: Foreground/Background segmentation was achieved from the original image. The image was transformed into gray scales only containing luminance after RGB to HSL (hue/saturation/luminance) transformation (Fig. S2D). To identify the foreground and the background inside the images, the standard Otsu's method for image binarization has been used. A global threshold was chosen to minimize the intraclass variance of the thresholded black and white pixels. The foreground/background mask defines the region area for the rest of the analysis.
Color deconvolution for IHC analysis: The color deconvolution allows transforming natural RGB images into channels containing only 1 marker. In this study, the color deconvolution gives 1 hematoxylin channel (blue) and 1 DAB channel (brown). The algorithm used is the ImageJ module “Color deconvolution 1.5” with “H DAB” parameters.
Nuclear segmentation: Nuclear segmentation was performed using the blue channel of IF images and using the blue channel after color deconvolution for IHC. The foreground/background mask was also used since the foreground area identifies nuclei clusters. The separation into individual nuclei was done by the following procedure: (i) Computation of distance map inside nuclei clusters. (ii) A Gaussian filtering on the distance map (sigma = 3 pixels). (iii) Watershed of the map after filtering (all maxima are used as seeds). Finally, segmented structures having a pixel count lower than 100 were removed.
Cell segmentation: Once nuclei were segmented, a distance map was computed between each nucleus and its neighboring nuclei. This map was defined only for the foreground area of the foreground/background mask. Cell segmentation was then obtained using a watershed algorithm initiated from nuclei and growing in the constructed distance map. The cytoplasm mask was calculated as the difference between the cell and the nuclei masks.
Measurement of cell parameters: For all cells inside an image, different measures have been extracted. Measures describe morphological features of the cells (size, width, and height), intensities in different channels as well as the number of autophagosomes. For IF, autophagosomes were identified in the green channel. In IHC, the number of autophagosomes was calculated in the brown channel. Since the intensity of DAB staining is inversely correlated to the intensity of pixels in the gray scale generated after color deconvolution, local minima in the cytoplasmic mask are detected automatically and are considered autophagosomes if the pixel value is below an intensity value of 160. The mean of intensity values is equal to 138.6 +/− 17.9 sem (N = 137 BC samples). The minimum and maximum values are 15 and 159, respectively.
Images of low- and high-magnification, before and after computation of autophagosomes (blue dots) and cellular delimitations (cytoplasmic and nuclear membranes, shown in red and green, respectively) are presented in Fig. S2E. Stromal cells have been separated from epithelial cells according to the mean of brown intensity in the cytoplasm, as the stromal compartment is almost negative for DAB staining whereas epithelial cells generally present a positive DAB staining, independently of the presence of autophagosome dots. The mask applied is shown on pictures in Fig. S2C and D. The images demonstrate that the delimitations of stroma versus epithelium, defined by the algorithm, correspond to the limits of the compartments drawn by pathologists, according to the distinct shapes of mesenchymal vs. epithelial tissues.
Cell culture
The human BC cell lines BT-474, CAMA-1, MCF-7, MDA-MB-231, MDA-MB-361, MDA-MB-436, MDA-MB-453, MDA-MB-468, SK-BR-3, were propagated in DMEM (Gibco, 41966–029) with 10% fetal bovine serum; cell lines BT-549, HCC70, HCC1569, T47D, were propagated in RPMI 1640 (Gibco, 61870–010) with 10% fetal bovine serum. MDA-MB-231-RFP-GFP-LC3B were cultured in DMEM with 10% fetal bovine serum supplemented with 800 μg/ml of G418 (Gibco, 1013–019). MDA-MB-231-RFP-GFP-LC3 cells were generated from MDA-MB-231 cells transfected with the plasmid RFP-GFP-LC3B (21074) from Addgene and selected using 800 μg/ml of G418 treatment.
3D culture
Three-dimensional laminin-rich extracellular matrix on-top cultures were generated as described previously.Citation71 Cells were trypsinized and single cells were seeded on a thin gel of Engelbreth-Holm-Swarm tumor extract (Matrigel: BD Biosciences, 354230), in the presence of medium containing 4% Engelbreth-Holm-Swarm tumor extract. In 6-well plates, MDA-MB-231 and BT-549 were seeded at 1 × 10⁵ and 1.1 × 10Citation5 cells per well, respectively. The surface covered by these 3D structures was measured using Metamorph software. Total area represents the average quantification of at least 3 independent experiments, in which at least 5 bright field images (0.85 mm2 per field) per condition were evaluated. Area per clone was calculated by dividing total area with the average number of clones per field. Data are represented in arbitrary units (a.u.). The number of living cells was determined after extraction from Matrigel. The Matrigel was dissolved in phosphate-buffered saline (PBS; Life technologies, Gibco® 10010–015) + 5 mM EDTA + protease inhibitors (Roche, 14044500) for 30 min at 4°C. The cells were centrifuged in PBS + 0.5% BSA (Euromedex, 4-100–811-C)-coated tubes and washed twice. The pellet fraction was resuspended in Trypsin-EDTA (GE healthcare, L11-4) and trypan blue-negative cells were considered as alive and counted using a Vi-cell apparatus (Millipore). For siRNA transfection experiments, the cells were transfected prior to 3D plating. Briefly, 2 × 10Citation5 cells per well were transfected, the day after plating, with 10 nM of the siRNA complex and DharmaFECT one transfection reagent (Dharmacon, T-2001) following the supplier's protocol recommendations. Forty 8 h post-transfection, the cells were grown in 3D for 3 d. siRNAs used for transfection were: siBECN1(1) (Qiagen, SI00055573), siBECN1(2) (Qiagen, SI00055587), siATG5(1) (Thermo scientific, M-004374-4), siATG5(2) (Qiagen, SI02655310), siYAP1(1) (Qiagen, SI02662954), siYAP1(2) (Qiagen, SI04438637), siATG7(1) (Qiagen, SI04231360), siATG7(2) (Qiagen, SI04344830) and siControl (Thermo scientific, D-001810-1). For DNA transfection, 2 × 10Citation5 cells were transfected with one μg of plasmid overexpressing an active mutant form of YAP1 (YAP-S127A) or with the empty vector as control, using jetPEI reagent (Polyplus transfection, 101–10) according to the supplier's protocol. The cells were recovered 48 h post-transfection for further analysis.
Reagents
The following antibodies were used for western blotting: anti-AP2A1/adaptin (1:1,000; BD Biosciences, 610502), anti-ACTB/β actin (1:20,000; Sigma-Aldrich, A5441), anti-LC3B (1:1,000; Cell Signaling Technology, 2775), anti-ATG7 (1:1,000; Cell Signaling Technology, 8558), anti-BECN1 (1:1,000; Cell Signaling Technology, 3738), anti-GAPDH (1:1,000; Millipore, MAB374), anti-ATG5 (1:1000; Cosmo Bio, TMD-PH-AT5), anti-YAP1 (1:1,000; Cell Signaling Technology, 4912) and anti-phospho-YAP1 (1:1,000; Cell Signaling Technology, 4911). For immunofluorescence studies, the anti-LC3 was from NanoTools (1:50; NanoTools 0231–100/LC3–5F10). Bafilomycin A1 (200 nM, 2 h treatment; B1793), chloroquine (7.5 to 15 μM, 3 d treatment or 50 μM 16 h treatment; C6628) and 3-MA (20 mM, 3 h treatment; M9281) were purchased from Sigma-Aldrich. Rapamycin was from Tocris (2 μM, 3 h treatment; 1292). Adriamycin and cyclophosphamide were purchased from the Curie Hospital pharmacy. For in vivo experiments, adriamycin and cyclophosphamide were used at 2 mg/kg, diluted in NaCl, chloroquine was used at 10 mg/kg diluted in PBS, and all were administered by intra-peritoneal injection (i.p.).
Transwell invasion assay
Twenty-four-well Transwell BioCoatTM growth factor reduced MatrigelTM invasion chambers (8-μM pore size; BD Biosciences, 35443) were used for invasion assays. Prior to seeding, MDA231 cells were transfected with 10 nM of siRNA using Lipofectamine RNAiMax reagent (Invitrogen, 13778–150) for 72 h. For the rescue experiment, 3 × 10Citation6 MDA231 cells were submitted to 2 successive transfections: the first 1 with siRNA (same conditions as before for 36 h), followed by a second transfection with 10 μg of control- or YAP1-expressing vector using jetPrime reagent (Polyplus Transfection, 712–60) for 24 h. After overnight serum starvation, 100,000 cells were plated on the upper side of the Transwell device, at least in duplicates, in 0.2% fetal bovine serum medium, while the lower well contained regular 10% fetal bovine serum culture medium in order to create a fetal bovine serum gradient. For investigating the chloroquine effect on invasion, MDA231 cells were treated with 50 μM of chloroquine during 16 h before seeding. After 6 h, the remaining cells on the upper side of the Transwell device were removed. Invading cells at the bottom side of the Transwell device were fixed in paraformaldehyde 4% (Electron Miscroscopy Sciences, 15710) for 20 min, permeabilized with 0.5% IGEPAL CA-630 (Sigma, I-3021), 0.5%, for 5 min and stained with 1 μg/ml DAPI for 30 min. Invaded cells were then counted under a microscope with a UV camera (x10 magnification, Zeiss Axioplan microscope, cool SNAP HQCitation2). Each condition was done in duplicate per experiment and the results are the sum of the number of cells counted in 8 different fields per condition. Data are from means +/− sem of at least 3 independent experiments.
Production of lentiviral vector and generation of stable cell lines
PLKO.1-derived vectors with an shRNA targeting human ATG5 or ATG7, or expressing a scrambled shRNA, were purchased from Sigma-Aldrich (TRCN0000151963 and TRCN0000007584 for ATG5 and ATG7, respectively), as mentioned in ref. 43. Viruses were produced by cotransfection (with Lipofectamine 2000; Invitrogen, 11668–019) of 293T cells with the vector plasmid, a vesicular stomatitis virus envelope expression plasmid (Vsvg) (Addgene, 12.259) and a second-generation packaging plasmid (pPax2) (Addgene, 12.260). Supernatant fractions were used to infect MDA231 cells or BT549 cells for 24 h. Infected cells were selected with puromycin (1 μg/mL; Invitrogen, ant-pr-1) for 72 h, prior to experimental use.
Western blot and densitometry analysis
After the required treatment, cells were washed with cold PBS and incubated for 15 min at 4°C with RIPA lysis buffer (30 mM Tris-HCl, pH 7.5, 150 mM NaCl, 10% glycerol, 1% Triton X-100 (Euromedex, 2000-C) supplemented with a protease inhibitor cocktail tablet (Roche, 11873580001). Cells extracts were centrifuged at 13,000 x g for 10 min at 4°C. The protein concentration of the supernatant fraction was determined using the Bio-Rad Dc Protein Assay Kit (Bio-Rad Laboratories, 500-6) according to the manufacturer's instructions. For each sample, an equal amount of total protein was diluted in sample buffer (Invitrogen, NP0007) and boiled for 5 min. Samples were loaded onto precast (4-15% gradient polyacrylamide gels; Bio-Rad, 456–1086) or onto freshly cast 15% polyacrylamide gels. After electrophoresis, the proteins were transferred to a 0.2-μM nitrocellulose transfer membrane (Whatman,10 401 396). Membranes were then blotted overnight at 4°C with the appropriate primary antibodies. Specific binding of antibodies was detected using appropriate conjugated secondary antibodies, and was visualized by enhanced chemiluminescence detection (Western Lightning® Plus-ECL, PerkinElmer, NEL-105001EA). Densitometric analyses of immunoblots were performed using the Multi Gauge software (FujiFilm).
Immunofluorescence and confocal microscopy analysis
Cells were grown on glass coverslips, washed in PBS, fixed in 4% paraformaldehyde for 10 min, and subjected to cold-methanol treatment for 5 min (−20°C). Aldehydes were quenched with 50 mM NH4Cl in PBS for 5 min. After being washed in PBS, the fixed cells were permeabilized in 0.1% Triton X-100 in PBS/3% BSA (Euromedex, 4-100–811-C) for 10 min, and then incubated for 30 min with the anti-LC3B antibody. Cells were washed and incubated with an anti-mouse Alexa 488-coupled secondary antibody (Invitrogen, A11029) for 30 min. Cells were washed twice with PBS and once with water, and then mounted in DAPI-containing mounting medium (Invitrogen, P36935). Images were acquired using a confocal microscope (A1R, Nikon). For image quantification, fields were chosen arbitrarily based on DAPI staining. Quantifications of the number of LC3 dots per cell were performed on at least 50 cells with a minimum of 8 cells per picture using ImageJ software. Particle number was quantified with the “analyze particle” function on thresholded sections.
To evaluate the number of autophagosomes and autolysosomes and to analyze the autophagic flux, MDA231 cells stably expressing the tandem probe RFP-GFP-LC3B were used. RFP-GFP-positive puncta (yellow puncta) are autophagosomes before lysosomal fusion, and RFP-only positive puncta (red puncta) are autolysosomes; GFP fluorescence is quenched at low pH.Citation72
Xenograft experiments
Orthotopic grafting experiments were performed by subcutaneous injection of 1.8 × 10Citation6 exponentially growing MDA-MB-231 cells into each flank of 6-wk-old female Swiss nude mice (at least 5 mice per group). The HBCx-12 PDX model established at the Institut Curie (Paris, France) has been described previously.Citation41 For this model, at least 10 mice per group were treated. When tumors reached 50 mm3 (2-3 weeks after transplantation), mice were treated either with PBS (Ctl), AC treatment (a combination of adriamycin [2 mg/kg, i.p. every 3 wk] and cyclophosphamide [100 mg/kg, i.p. every 3 wk]), chloroquine alone (10 mg/kg, i.p. Five days each wk), or a combination of AC and chloroquine. Briefly, tumor growth was evaluated by measuring 2 perpendicular diameters of tumors with a caliper twice to thrice per week. Individual tumor volumes were calculated as (V) = a × b2/2, with a being the major diameter, and b the minor diameter. For each tumor, V was reported to the initial volume as relative tumor volume (RTV). Means (and sem) of RTV in the same treatment group were calculated, and growth curves were established as a function of time. The Institut Curie ethical committee approved all experiments.
Statistical analysis
To evaluate the prognostic value of the LC3B mRNA and protein levels, we used the Kaplan-Meier method and the log-rank test to estimate the probabilities of overall survival (OS) and disease-free survival (DFS). For all analyses presented in that paper (based on MAP1LC3B mRNA levels, LC3B protein levels or the number of autophagosomes), Kaplan-Meier analyses were performed using successive iterations to find the optimal sample size thresholds that maximally discriminate the “low” and the “high” subgroups of patients. The cut-off value is thus defined as the one that maximally discriminates the 2 patient subsets. When these cut-off values include the median value, the median value was used. The analysis of the risk of death and the risk of developing metastases for the BC samples was conducted using Cox proportional-hazards regression modeling. Only significant variables in the univariate analysis were included in the multivariate analysis. For each gene involved in the Cox regression, the low and high group was defined using the median of the probeset. Differences were considered to be statistically significant at values of p ≤ 0.05. Graphs generally represent mean ± sem obtained from at least 3 independent experiments, using an adapted statistical test, as mentioned. The horizontal dark line on the scatter plots represents the median and the error bars the sem. When needed, p-values based on the Student t test were adjusted for multiple comparisons using Benjamini & Hochberg correction.
Disclosure of Potential Conflicts of Interest
No potential conflicts of interest were disclosed.
Supplemental_Data.pdf
Download PDF (8.5 MB)Acknowledgments
We are grateful to P. Codogno for critical reading of the manuscript, as well as to M. Cardon and Maria-Carla Parrini for advices on several aspects of this work, namely image analysis and invasion assay, respectively. We also thank Lisa Maranghoni, F. Assayag, and A. Thuleau from the Preclinical investigation laboratory at the Institut Curie for expert technical assistance in establishing mouse models, E. Martel, M. Richardson and A. Nicolas from the experimental pathology platform at the Institut Curie for help and advice, L. Sengmanivong and the Nikon Imaging Center at the Institut Curie for technical assistance with microscopy and L. Cerf and V. Racine from FluoFarma®. We acknowledge O. Mariani from CRB Institut Curie for her help in preparing the mRNA and protein samples from patient tumors and D. Lallemand for the kind gift of the plasmid expressing the mutant form of YAP1. We are grateful to all members of the animal facilities of Institute Curie for their helpful expertise.
Funding
This work was supported by grants from the Institut National de la Santé et de la Recherche Médicale (Inserm), the Institut Curie, the Ligue Nationale Contre le Cancer (Labelized team), the Institut National du Cancer (INCa) and the Fondation ARC.
References
- Jemal A, Siegel R, Xu J, Ward E. Cancer statistics, 2010. CA Cancer J Clin 2010; 60:277-300; PMID:20610543; http://dx.doi.org/10.3322/caac.20073
- Ferlay J, Steliarova-Foucher E, Lortet-Tieulent J, Rosso S, Coebergh JWW, Comber H, Forman D, Bray F. Cancer incidence and mortality patterns in Europe: estimates for 40 countries in 2012. Eur J Cancer Oxf Engl 1990 2013; 49:1374-403
- Carey LA, Dees EC, Sawyer L, Gatti L, Moore DT, Collichio F, Ollila DW, Sartor CI, Graham ML, Perou CM. The triple negative paradox: primary tumor chemosensitivity of breast cancer subtypes. Clin Cancer Res Off J Am Assoc Cancer Res 2007; 13:2329-34; http://dx.doi.org/10.1158/1078-0432.CCR-06-1109
- Foulkes WD, Smith IE, Reis-Filho JS. Triple-negative breast cancer. N Engl J Med 2010; 363:1938-48; PMID:21067385; http://dx.doi.org/10.1056/NEJMra1001389
- Kennecke H, Yerushalmi R, Woods R, Cheang MCU, Voduc D, Speers CH, Nielsen TO, Gelmon K. Metastatic behavior of breast cancer subtypes. J Clin Oncol Off J Am Soc Clin Oncol 2010; 28:3271-7; http://dx.doi.org/10.1200/JCO.2009.25.9820
- Lehmann BD, Bauer JA, Chen X, Sanders ME, Chakravarthy AB, Shyr Y, Pietenpol JA. Identification of human triple-negative breast cancer subtypes and preclinical models for selection of targeted therapies. J Clin Invest 2011; 121:2750-67; PMID:21633166; http://dx.doi.org/10.1172/JCI45014
- Amaravadi RK, Lippincott-Schwartz J, Yin X-M, Weiss WA, Takebe N, Timmer W, DiPaola RS, Lotze MT, White E. Principles and current strategies for targeting autophagy for cancer treatment. Clin Cancer Res Off J Am Assoc Cancer Res 2011; 17:654-66; http://dx.doi.org/10.1158/1078-0432.CCR-10-2634
- Klionsky DJ, Emr SD. Autophagy as a regulated pathway of cellular degradation. Science 2000; 290:1717-21; PMID:11099404; http://dx.doi.org/10.1126/science.290.5497.1717
- Mizushima N, Levine B, Cuervo AM, Klionsky DJ. Autophagy fights disease through cellular self-digestion. Nature 2008; 451:1069-75; PMID:18305538; http://dx.doi.org/10.1038/nature06639
- Degenhardt K, Mathew R, Beaudoin B, Bray K, Anderson D, Chen G, Mukherjee C, Shi Y, Gélinas C, Fan Y, et al. Autophagy promotes tumor cell survival and restricts necrosis, inflammation, and tumorigenesis. Cancer Cell 2006; 10:51-64; PMID:16843265; http://dx.doi.org/10.1016/j.ccr.2006.06.001
- Jin S, White E. Tumor suppression by autophagy through the management of metabolic stress. Autophagy 2008; 4:563-6; http://dx.doi.org/10.4161/auto.5830
- Saito H, Inazawa J, Saito S, Kasumi F, Koi S, Sagae S, Kudo R, Saito J, Noda K, Nakamura Y. Detailed deletion mapping of chromosome 17q in ovarian and breast cancers: two-cM region on 17q21.3 often and commonly deleted in tumors. Cancer Res 1993; 53:3382-5; PMID:8100738
- Aita VM, Liang XH, Murty VV, Pincus DL, Yu W, Cayanis E, Kalachikov S, Gilliam TC, Levine B. Cloning and genomic organization of beclin 1, a candidate tumor suppressor gene on chromosome 17q21. Genomics 1999; 59:59-65; PMID:10395800; http://dx.doi.org/10.1006/geno.1999.5851
- Liang XH, Jackson S, Seaman M, Brown K, Kempkes B, Hibshoosh H, Levine B. Induction of autophagy and inhibition of tumorigenesis by beclin 1. Nature 1999; 402:672-6; PMID:10604474; http://dx.doi.org/10.1038/45257
- Qu X, Yu J, Bhagat G, Furuya N, Hibshoosh H, Troxel A, Rosen J, Eskelinen E-L, Mizushima N, Ohsumi Y, et al. Promotion of tumorigenesis by heterozygous disruption of the beclin one autophagy gene. J Clin Invest 2003; 112:1809-20; PMID:14638851; http://dx.doi.org/10.1172/JCI20039
- Yue Z, Jin S, Yang C, Levine AJ, Heintz N. Beclin 1, an autophagy gene essential for early embryonic development, is a haploinsufficient tumor suppressor. Proc Natl Acad Sci U S A 2003; 100:15077-82; PMID:14657337; http://dx.doi.org/10.1073/pnas.2436255100
- Mariño G, Salvador-Montoliu N, Fueyo A, Knecht E, Mizushima N, López-Otín C. Tissue-specific autophagy alterations and increased tumorigenesis in mice deficient in Atg4C/autophagin-3. J Biol Chem 2007; 282:18573-83; http://dx.doi.org/10.1074/jbc.M701194200
- Karantza-Wadsworth V, Patel S, Kravchuk O, Chen G, Mathew R, Jin S, White E. Autophagy mitigates metabolic stress and genome damage in mammary tumorigenesis. Genes Dev 2007; 21:1621-35; PMID:17606641; http://dx.doi.org/10.1101/gad.1565707
- White E. Deconvoluting the context-dependent role for autophagy in cancer. Nat Rev Cancer 2012; 12:401-10; PMID:22534666; http://dx.doi.org/10.1038/nrc3262
- Strohecker AM, White E. Autophagy promotes Braf(V600E)-driven lung tumorigenesis by preserving mitochondrial metabolism. Autophagy 2013; 10:384-5; PMID:24362353
- Guo JY, Xia B, White E. Autophagy-mediated tumor promotion. Cell 2013; 155:1216-9; PMID:24315093; http://dx.doi.org/10.1016/j.cell.2013.11.019
- Mathew R, Karantza-Wadsworth V, White E. Role of autophagy in cancer. Nat Rev Cancer 2007; 7:961-7; PMID:17972889; http://dx.doi.org/10.1038/nrc2254
- Amaravadi RK, Yu D, Lum JJ, Bui T, Christophorou MA, Evan GI, Thomas-Tikhonenko A, Thompson CB. Autophagy inhibition enhances therapy-induced apoptosis in a Myc-induced model of lymphoma. J Clin Invest 2007; 117:326-36; PMID:17235397; http://dx.doi.org/10.1172/JCI28833
- Karpathiou G, Sivridis E, Koukourakis MI, Mikroulis D, Bouros D, Froudarakis ME, Giatromanolaki A. Light-chain 3A autophagic activity and prognostic significance in non-small cell lung carcinomas. Chest 2011; 140:127-34; PMID:21148243; http://dx.doi.org/10.1378/chest.10-1831
- Guo JY, Karsli-Uzunbas G, Mathew R, Aisner SC, Kamphorst JJ, Strohecker AM, Chen G, Price S, Lu W, Teng X, et al. Autophagy suppresses progression of K-ras-induced lung tumors to oncocytomas and maintains lipid homeostasis. Genes Dev 2013; 27:1447-61; PMID:23824538; http://dx.doi.org/10.1101/gad.219642.113
- Miao Y, Zhang Y, Chen Y, Chen L, Wang F. GABARAP is overexpressed in colorectal carcinoma and correlates with shortened patient survival. Hepatogastroenterology 2010; 57:257-61; PMID:20583424
- Fujii S, Mitsunaga S, Yamazaki M, Hasebe T, Ishii G, Kojima M, Kinoshita T, Ueno T, Esumi H, Ochiai A. Autophagy is activated in pancreatic cancer cells and correlates with poor patient outcome. Cancer Sci 2008; 99:1813-9; PMID:18616529; http://dx.doi.org/10.1111/j.1349-7006.2008.00743.x
- Yoshioka A, Miyata H, Doki Y, Yamasaki M, Sohma I, Gotoh K, Takiguchi S, Fujiwara Y, Uchiyama Y, Monden M. LC3, an autophagosome marker, is highly expressed in gastrointestinal cancers. Int J Oncol 2008; 33:461-8; PMID:18695874
- Sivridis E, Koukourakis MI, Zois CE, Ledaki I, Ferguson DJP, Harris AL, Gatter KC, Giatromanolaki A. LC3A-positive light microscopy detected patterns of autophagy and prognosis in operable breast carcinomas. Am J Pathol 2010; 176:2477-89; PMID:20382705; http://dx.doi.org/10.2353/ajpath.2010.090049
- Lazova R, Camp RL, Klump V, Siddiqui SF, Amaravadi RK, Pawelek JM. Punctate LC3B expression is a common feature of solid tumors and associated with proliferation, metastasis, and poor outcome. Clin Cancer Res Off J Am Assoc Cancer Res 2012; 18:370-9; http://dx.doi.org/10.1158/1078-0432.CCR-11-1282
- Choi J, Jung W, Koo JS. Expression of autophagy-related markers beclin-1, light chain 3A, light chain 3B and p62 according to the molecular subtype of breast cancer. Histopathology 2013; 62:275-86; PMID:23134379; http://dx.doi.org/10.1111/his.12002
- Zhao H, Yang M, Zhao J, Wang J, Zhang Y, Zhang Q. High expression of LC3B is associated with progression and poor outcome in triple-negative breast cancer. Med Oncol Northwood Lond Engl 2013; 30:475; http://dx.doi.org/10.1007/s12032-013-0475-1
- Kabeya Y, Mizushima N, Ueno T, Yamamoto A, Kirisako T, Noda T, Kominami E, Ohsumi Y, Yoshimori T. LC3, a mammalian homologue of yeast Apg8p, is localized in autophagosome membranes after processing. EMBO J 2000; 19:5720-8; PMID:11060023; http://dx.doi.org/10.1093/emboj/19.21.5720
- Mizushima N. Methods for monitoring autophagy. Int J Biochem Cell Biol 2004; 36:2491-502; PMID:15325587; http://dx.doi.org/10.1016/j.biocel.2004.02.005
- Sabatier R, Finetti P, Cervera N, Lambaudie E, Esterni B, Mamessier E, Tallet A, Chabannon C, Extra J-M, Jacquemier J, et al. A gene expression signature identifies two prognostic subgroups of basal breast cancer. Breast Cancer Res Treat 2011; 126:407-20; PMID:20490655; http://dx.doi.org/10.1007/s10549-010-0897-9
- Pawitan Y, Bjöhle J, Amler L, Borg A-L, Egyhazi S, Hall P, Han X, Holmberg L, Huang F, Klaar S, et al. Gene expression profiling spares early breast cancer patients from adjuvant therapy: derived and validated in two population-based cohorts. Breast Cancer Res BCR 2005; 7:R953-964; http://dx.doi.org/10.1186/bcr1325
- Toullec A, Gerald D, Despouy G, Bourachot B, Cardon M, Lefort S, Richardson M, Rigaill G, Parrini M-C, Lucchesi C, et al. Oxidative stress promotes myofibroblast differentiation and tumour spreading. EMBO Mol Med 2010; two:211-30; PMID:20535745; http://dx.doi.org/10.1002/emmm.201000073
- Kenny PA, Lee GY, Myers CA, Neve RM, Semeiks JR, Spellman PT, Lorenz K, Lee EH, Barcellos-Hoff MH, Petersen OW, et al. The morphologies of breast cancer cell lines in three-dimensional assays correlate with their profiles of gene expression. Mol Oncol 2007; 1:84-96; http://dx.doi.org/10.1016/j.molonc.2007.02.004
- Dupont S, Morsut L, Aragona M, Enzo E, Giulitti S, Cordenonsi M, Zanconato F, Le Digabel J, Forcato M, Bicciato S, et al. Role of YAP/TAZ in mechanotransduction. Nature 2011; 474:179-83; PMID:21654799; http://dx.doi.org/10.1038/nature10137
- Rubinsztein DC, Gestwicki JE, Murphy LO, Klionsky DJ. Potential therapeutic applications of autophagy. Nat Rev Drug Discov 2007; 6:304-12; http://dx.doi.org/10.1038/nrd2272
- Marangoni E, Vincent-Salomon A, Auger N, Degeorges A, Assayag F, de Cremoux P, de Plater L, Guyader C, De Pinieux G, Judde J-G, et al. A new model of patient tumor-derived breast cancer xenografts for preclinical assays. Clin Cancer Res Off J Am Assoc Cancer Res 2007; 13:3989-98; http://dx.doi.org/10.1158/1078-0432.CCR-07-0078
- Ma X-H, Piao S, Wang D, McAfee QW, Nathanson KL, Lum JJ, Li LZ, Amaravadi RK. Measurements of tumor cell autophagy predict invasiveness, resistance to chemotherapy, and survival in melanoma. Clin Cancer Res Off J Am Assoc Cancer Res 2011; 17:3478-89; http://dx.doi.org/10.1158/1078-0432.CCR-10-2372
- Guo JY, Chen H-Y, Mathew R, Fan J, Strohecker AM, Karsli-Uzunbas G, Kamphorst JJ, Chen G, Lemons JMS, Karantza V, et al. Activated Ras requires autophagy to maintain oxidative metabolism and tumorigenesis. Genes Dev 2011; 25:460-70; PMID:21317241; http://dx.doi.org/10.1101/gad.2016311
- Gong C, Bauvy C, Tonelli G, Yue W, Deloménie C, Nicolas V, Zhu Y, Domergue V, Marin-Esteban V, Tharinger H, et al. Beclin one and autophagy are required for the tumorigenicity of breast cancer stem-like/progenitor cells. Oncogene 2013; 32:2261-72; PMID:22733132; http://dx.doi.org/10.1038/onc.2012.252
- Agathanggelou A, Honorio S, Macartney DP, Martinez A, Dallol A, Rader J, Fullwood P, Chauhan A, Walker R, Shaw JA, et al. Methylation associated inactivation of RASSF1A from region 3p21.3 in lung, breast and ovarian tumours. Oncogene 2001; 20:1509-18; PMID:11313894; http://dx.doi.org/10.1038/sj.onc.1204175
- Takahashi Y, Miyoshi Y, Takahata C, Irahara N, Taguchi T, Tamaki Y, Noguchi S. Down-regulation of LATS1 and LATS2 mRNA expression by promoter hypermethylation and its association with biologically aggressive phenotype in human breast cancers. Clin Cancer Res Off J Am Assoc Cancer Res 2005; 11:1380-5; http://dx.doi.org/10.1158/1078-0432.CCR-04-1773
- Overholtzer M, Zhang J, Smolen GA, Muir B, Li W, Sgroi DC, Deng C-X, Brugge JS, Haber DA. Transforming properties of YAP, a candidate oncogene on the chromosome 11q22 amplicon. Proc Natl Acad Sci U S A 2006; 103:12405-10; PMID:16894141; http://dx.doi.org/10.1073/pnas.0605579103
- Zhi X, Zhao D, Zhou Z, Liu R, Chen C. YAP Promotes Breast Cell Proliferation and Survival Partially through Stabilizing the KLF5 Transcription Factor. Am J Pathol 2012; 180:2452-61; PMID:22632819; http://dx.doi.org/10.1016/j.ajpath.2012.02.025
- Iwasaki M, Homma S, Hishiya A, Dolezal SJ, Reed JC, Takayama S. BAG3 regulates motility and adhesion of epithelial cancer cells. Cancer Res 2007; 67:10252-9; PMID:17974966; http://dx.doi.org/10.1158/0008-5472.CAN-07-0618
- Ulbricht A, Eppler FJ, Tapia VE, van der Ven PFM, Hampe N, Hersch N, Vakeel P, Stadel D, Haas A, Saftig P, et al. Cellular mechanotransduction relies on tension-induced and chaperone-assisted autophagy. Curr Biol CB 2013; 23:430-5; http://dx.doi.org/10.1016/j.cub.2013.01.064
- Li J, Hou N, Faried A, Tsutsumi S, Kuwano H. Inhibition of autophagy augments five-fluorouracil chemotherapy in human colon cancer in vitro and in vivo model. Eur J Cancer Oxf Engl 1990 2010; 46:1900-9; http://dx.doi.org/10.1016/j.ejca.2010.02.021
- Pan Y, Gao Y, Chen L, Gao G, Dong H, Yang Y, Dong B, Chen X. Targeting autophagy augments in vitro and in vivo antimyeloma activity of DNA-damaging chemotherapy. Clin Cancer Res Off J Am Assoc Cancer Res 2011; 17:3248-58; http://dx.doi.org/10.1158/1078-0432.CCR-10-0890
- Guo X-L, Li D, Hu F, Song J-R, Zhang S-S, Deng W-J, Sun K, Zhao Q-D, Xie X-Q, Song Y-J, et al. Targeting autophagy potentiates chemotherapy-induced apoptosis and proliferation inhibition in hepatocarcinoma cells. Cancer Lett 2012; 320:171-9; PMID:22406827; http://dx.doi.org/10.1016/j.canlet.2012.03.002
- Rabinowitz JD, White E. Autophagy and metabolism. Science 2010; 330:1344-8; PMID:21127245; http://dx.doi.org/10.1126/science.1193497
- Rubinstein AD, Kimchi A. Life in the balance - a mechanistic view of the crosstalk between autophagy and apoptosis. J Cell Sci 2012; 125:5259-68; PMID:23377657; http://dx.doi.org/10.1242/jcs.115865
- Gangemi R, Paleari L, Orengo AM, Cesario A, Chessa L, Ferrini S, Russo P. Cancer stem cells: a new paradigm for understanding tumor growth and progression and drug resistance. Curr Med Chem 2009; 16:1688-703; PMID:19442140; http://dx.doi.org/10.2174/092986709788186147
- Singh A, Settleman J. EMT, cancer stem cells and drug resistance: an emerging axis of evil in the war on cancer. Oncogene 2010; 29:4741-51; PMID:20531305; http://dx.doi.org/10.1038/onc.2010.215
- Lian I, Kim J, Okazawa H, Zhao J, Zhao B, Yu J, Chinnaiyan A, Israel MA, Goldstein LSB, Abujarour R, et al. The role of YAP transcription coactivator in regulating stem cell self-renewal and differentiation. Genes Dev 2010; 24:1106-18; PMID:20516196; http://dx.doi.org/10.1101/gad.1903310
- Hao J, Zhang Y, Jing D, Li Y, Li J, Zhao Z. Role of Hippo signaling in cancer stem cells. J Cell Physiol 2013
- Bristol ML, Emery SM, Maycotte P, Thorburn A, Chakradeo S, Gewirtz DA. Autophagy inhibition for chemosensitization and radiosensitization in cancer: do the preclinical data support this therapeutic strategy? J Pharmacol Exp Ther 2013; 344:544-52; PMID:23291713; http://dx.doi.org/10.1124/jpet.112.199802
- Han W, Pan H, Chen Y, Sun J, Wang Y, Li J, Ge W, Feng L, Lin X, Wang X, et al. EGFR tyrosine kinase inhibitors activate autophagy as a cytoprotective response in human lung cancer cells. PloS One 2011; 6:e18691
- Shi Y-H, Ding Z-B, Zhou J, Hui B, Shi G-M, Ke A-W, Wang X-Y, Dai Z, Peng Y-F, Gu C-Y, et al. Targeting autophagy enhances sorafenib lethality for hepatocellular carcinoma via ER stress-related apoptosis. Autophagy 2011; 7:1159-72; http://dx.doi.org/10.4161/auto.7.10.16818
- Zinn RL, Gardner EE, Dobromilskaya I, Murphy S, Marchionni L, Hann CL, Rudin CM. Combination treatment with ABT-737 and chloroquine in preclinical models of small cell lung cancer. Mol Cancer 2013; 12:16; PMID:23452820; http://dx.doi.org/10.1186/1476-4598-12-16
- Obeid M, Tesniere A, Ghiringhelli F, Fimia GM, Apetoh L, Perfettini J-L, Castedo M, Mignot G, Panaretakis T, Casares N, et al. Calreticulin exposure dictates the immunogenicity of cancer cell death. Nat Med 2007; 13:54-61; PMID:17187072; http://dx.doi.org/10.1038/nm1523
- Uhl M, Kepp O, Jusforgues-Saklani H, Vicencio J-M, Kroemer G, Albert ML. Autophagy within the antigen donor cell facilitates efficient antigen cross-priming of virus-specific CD8+ T cells. Cell Death Differ 2009; 16:991-1005; PMID:19229247; http://dx.doi.org/10.1038/cdd.2009.8
- Michaud M, Martins I, Sukkurwala AQ, Adjemian S, Ma Y, Pellegatti P, Shen S, Kepp O, Scoazec M, Mignot G, et al. Autophagy-dependent anticancer immune responses induced by chemotherapeutic agents in mice. Science 2011; 334:1573-7; PMID:22174255; http://dx.doi.org/10.1126/science.1208347
- Akalay I, Janji B, Hasmim M, Noman MZ, André F, De Cremoux P, Bertheau P, Badoual C, Vielh P, Larsen AK, et al. Epithelial-to-mesenchymal transition and autophagy induction in breast carcinoma promote escape from T-cell-mediated lysis. Cancer Res 2013; 73:2418-27; PMID:23436798; http://dx.doi.org/10.1158/0008-5472.CAN-12-2432
- Gu-Trantien C, Loi S, Garaud S, Equeter C, Libin M, de Wind A, Ravoet M. CD4+ follicular helper T cell infiltration predicts breast cancer survival. J Clin Invest 2013; 123(7):2873-92.
- Bieche I, Parfait B, Le Doussal V, Olivi M, Rio MC, Lidereau R, Vidaud M. Identification of CGA as a novel estrogen receptor-responsive gene in breast cancer: an outstanding candidate marker to predict the response to endocrine therapy. Cancer Res 2001; 61:1652-8; PMID:11245479
- Ladoire S, Chaba K, Martins I, Sukkurwala AQ, Adjemian S, Michaud M, Poirier-Colame V, Andreiuolo F, Galluzzi L, White E, et al. Immunohistochemical detection of cytoplasmic LC3 puncta in human cancer specimens. Autophagy 2012; 8:1175-84; http://dx.doi.org/10.4161/auto.20353
- Lee GY, Kenny PA, Lee EH, Bissell MJ. Three-dimensional culture models of normal and malignant breast epithelial cells. Nat Methods 2007; 4:359-65; http://dx.doi.org/10.1038/nmeth1015
- Kimura S, Noda T, Yoshimori T. Dissection of the autophagosome maturation process by a novel reporter protein, tandem fluorescent-tagged LC3. Autophagy 2007; three:452-60; http://dx.doi.org/10.4161/auto.4451