
Abstract
This study compares the local conformational dynamics and physical stability of an IgG1 mAb (mAb-A) with its corresponding YTE (M255Y/S257T/T259E) mutant (mAb-E), which was engineered for extended half-life in vivo. Structural dynamics was measured using hydrogen/deuterium (H/D) exchange mass spectrometry while protein stability was measured with differential scanning calorimetry (DSC) and size exclusion chromatography (SEC). The YTE mutation induced differences in H/D exchange kinetics at both pH 6.0 and 7.4. Segments covering the YTE mutation sites and the FcRn binding epitopes showed either subtle or no observable differences in local flexibility. Surprisingly, several adjacent segments in the CH2 and distant segments in the VH, CH1, and VL domains had significantly increased flexibility in the YTE mutant. Most notable among the observed differences is increased flexibility of the 244–254 segment of the CH2 domain, where increased flexibility has been shown previously to correlate with decreased conformational stability and increased aggregation propensity in other IgG1 mAbs (e.g., presence of destabilizing additives as well as upon de-glycosylation or methionine oxidation). DSC analysis showed decreases in both thermal onset (Tonset) and unfolding (Tm1) temperatures of 7°C and 6.7°C, respectively, for the CH2 domain of the YTE mutant. In addition, mAb-E aggregated faster than mAb-A under accelerated stability conditions as measured by SEC analysis. Hence, the relatively lower physical stability of the YTE mutant correlates with increased local flexibility of the 244–254 segment, providing a site-directed mutant example that this segment of the CH2 domain is an aggregation hot spot in IgG1 mAbs.
Abbreviations
| DSC | = | differential scanning calorimetry |
| HX-MS | = | hydrogen/deuterium exchange mass spectrometry |
| Fab | = | antigen binding fragment of a monoclonal antibody |
| Fc | = | crystallizable fragment of a monoclonal antibody |
| HC | = | heavy chain of a monoclonal antibody |
| LC | = | light chain of a monoclonal antibody |
| CH1-CH3 | = | constant domains 1–3, respectively, of the heavy chain of a monoclonal antibody |
| VH/VL | = | variable domain of the heavy/light chain of a monoclonal antibody |
Introduction
The IgG1 framework is the most widely used platform for designing and developing therapeutic monoclonal antibodies (mAbs) for treatment of cancer, autoimmune and infectious diseases.Citation1,Citation2 The Fc region of IgG1 mAbs, whose sequence is primarily dictated by antibody subtype and host, serves a variety of biological functions, the most important of which include binding to specific Fcγ receptors to trigger various immunological events, (e.g., complement activation, antibody-dependent cell-mediated cytotoxicity (ADCC), opsonization),Citation3-Citation5 and determining pharmacokinetic (pK) properties of the mAb through interaction with FcRn receptors.Citation6 Recent work has also implicated the Fc region in reducing mobility of infectious viruses in the mucosa after antibody binding.Citation7 These biological properties are often mediated by the glycosylation profile of the N-linked Asn 297 residue within the CH2 domain of the IgG1-Fc region.Citation8 Thus, engineering specific sequences to improve the therapeutic utility of IgG1 mAbs is not limited to the amino acid residues of the complementarity-determining regions (CDRs) in the Fab to enhance antigen binding specificity and affinity.Citation9 The constant regions in the Fc can also be engineered to improve mAb-based therapeutics, including better engagement of the immune systemCitation10,Citation11 and extension of the circulation half-life. Citation12-Citation14
Increasing the serum half-life of mAbs is an attractive proposition because it potentially results in changes in their pharmacokinetic/pharmacodynamic profiles, as well as decreased dosing frequency leading to higher patient compliance.Citation15 The serum half-life of IgG1 antibodies is known to be regulated by the neonatal Fc receptor (FcRn) located primarily in the acidic endosomes of endothelial and haematopoietic cells.Citation16,Citation17 Free or antigen-bound antibodies enter these cells through pinocytosis or endocytosis, respectively, and are then transported to the endosomes. FcRn interaction then marks the antibodies for either recycling or lysosomal degradation. The recycling mechanism is based on selective binding of IgG to the FcRn receptor in the relatively more acidic (pH <6.5) environment of endosomes, followed by release from the receptor upon exposure to the more basic (pH ∼7.4) milieu of the bloodstream.Citation18 The binding sites of the Fc region of an antibody to the FcRn receptor, as well as the amino acid residues responsible for the pH-dependent recycling, have been identified and are well documented for human IgGs.Citation19-Citation21 The pH-dependence of this binding within acidic endosomes is driven by positively-charged histidine residues in human IgG1 antibodies, specifically His 310 and His 436 at pH 6.5 or below, that form salt bridges with negatively-charged Glu 117 and Asp 137 residues of FcRn.Citation18,Citation19,Citation21 Under physiological conditions (pH ∼7.4) of the bloodstream, however, these histidine residues are no longer charged and hence there is little histidine-mediated binding between the IgG-Fc region and the FcRn receptor.
The recycling machinery has been widely targeted through random and specific mutations of the IgG primary sequence to increase or decrease the affinity for binding to FcRn and thereby extend or reduce the circulation half-life of IgG based therapeutics.Citation14,Citation22-Citation28 For example, the increased FcRn binding at pH 6.0 by a YTE triple-mutant mAb is mediated by the creation of one additional salt bridge between Glu 256 (E) of Fc-YTE and Gln 2 (Q) of the β2-microglobulin chain of FcRn compared to the original IgG1 Fc structure.Citation29 The YTE mutations (M252Y/S254T/T256E) in the CH2 domain of an IgG1 mAb resulted in a nearly four-fold higher in vivo half-life in cynomolgus monkeys, the largest increase in IgG mAb half-life reported to-date for non-human primates.Citation23 The YTE triple mutation also resulted in ten-fold higher FcRn binding, four-fold higher tissue bioavailability, and modulated ADCC in non-human primates.Citation23 In a recent human clinical trial, the YTE mutant of an IgG1 mAb that targeted respiratory syncytial virus (motavizumab) had two- to four-fold longer in vivo half-life compared to the original mAb.Citation15
The X-ray crystal structures of the original human IgG1 Fc (PDB ID 3AVE) and the Fc-YTE (PDB ID 3FJT) mutant reveal no apparent structural differences between the 2 molecules.Citation14,Citation30 A recent study, however, suggested that the YTE mutant has relatively lower physical stability in solution than the same mAb without the mutations.Citation31 One possibility is that these stability differences are mediated by changes in structural dynamics of specific sequences in the mAbs due to the YTE mutations. Although the interrelationships between dynamics and stability of proteins are complex,Citation32 growing evidence suggests that physical destabilization of mAbs can, in at least some cases, be mediated by changes in local dynamics of specific sequences.Citation33,Citation34 Hydrogen/deuterium exchange coupled to mass spectrometry (H/D-MS) is now a well-established technique to explore the local dynamics of the amide backbone of mAbs with peptide-level resolution.Citation35,Citation36 H/D-MS has been used to study changes in mAb conformational dynamics imparted by stabilizing and destabilizing excipientsCitation34 and salts,Citation33 mutation in the IgG1 CH3 domain,Citation37 deglycosylation,Citation35 chemical and post-translational modifications,Citation38,Citation39 thermal and freeze-thaw stress,Citation40 and cytotoxic drug conjugation Citation41 in IgG1 mAbs.
The work reported here investigated the nature of the relative differences in physical stability between an IgG1 mAb (mAb-A) and its corresponding YTE-mutant (mAb-E) by examining effects of the YTE-mutations on amide backbone local dynamics measured by amide H/D exchange, conformational stability measured by differential scanning calorimetry (DSC), and aggregation propensity measured by size exclusion chromatography (SEC). Since solution pH plays a very important role in the interaction of antibodies with FcRn receptors (i.e., binding at pH 6.0 and release at pH 7.4), we explored differences in flexibility and stability between the 2 mAbs at both pH values. We then correlated the observed changes in physical stability to changes observed in the amide backbone dynamics due to the YTE mutations.
Results
YTE mutation decreased the conformational stability of only the CH2 domain
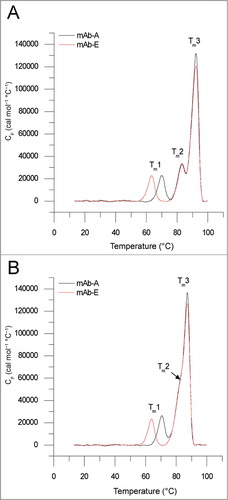
DSC was used to examine the conformational stability of mAb-A and mAb-E (YTE-mutant of mAb-A). Representative DSC thermograms comparing the 2 mAbs are shown in . Both the mAbs display 3 thermal melting (Tm) transitions at both pH 6.0 and 7.4. The Tm1 value () has been shown previously to represent the thermal unfolding of the CH2 domain.Citation42 The Tm2 and Tm3 values () have been shown to represent the unfolding of either the Fab or the CH3 domain depending on the antibody and solution conditions.Citation42,Citation43 In addition, the Tonset values, marking the temperature at which the first structural transition initiates (an important value for formulation stability considerations),Citation44 were also determined. A summary of the 3 Tm and Tonset values are listed in . The YTE mutation decreased Tm1 values by 6.5°C and 6.7°C, at pH 6.0 and 7.4, respectively, and decreased Tonset values by ∼7°C at both pH values. The Tm2 and Tm3 values were not affected by the YTE mutation. Comparing the effect of pH 6.0 to 7.4 on protein conformational stability as measured by DSC, both mAbs had similar values for Tm1 and Tm2 at both pH values. However, both mAb-A and mAb-E had ∼4.7°C higher values for Tm3 and ∼1.4°C lower Tonset values at pH 6.0 compared to 7.4. In summary, the YTE mutation decreased conformational stability in the CH2 domain while the other domains in the 2 mAbs were similar in terms of their thermal stability.
Table 1. Thermal stability of mAb-A and mAb-E at pH 6.0 and pH 7.4 indicated by the melting onset temperature (Tonset) and the melting transitions (Tm1, Tm2, and Tm3) as measured by DSC. Formulations contained 50 mM sodium phosphate, 150 mM sodium chloride with 0.5 mg ml−1 of mAb-A or mAb-E. The mean and standard deviations are based on 3 independent measurements
Figure 1. Representative overlay of DSC thermograms of mAb-A and mAb-E at (A) pH 6.0 and (B) pH 7.4. The Tm1, Tm2, and Tm3 values indicate the first, second, and third thermal melting transitions for the 2 mAbs.
YTE mutation increased the aggregation propensity of mAb-E under accelerated storage conditions
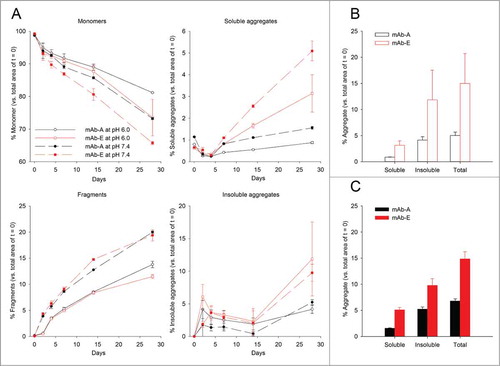
The aggregation propensities of the 2 mAbs at pH 6.0 and 7.4 under accelerated storage conditions were measured by SEC at 50°C over 28 d. shows the loss of IgG monomer and formation of fragments, soluble, and insoluble aggregates for the mAb samples. Peaks in the SEC chromatograms were assigned based on molecular weight as described previously.Citation34 Both mAbs had greater than 99% monomer content at time zero and small amounts of fragments and soluble aggregates. Quantitation of the various mAb species after storage was determined relative to the respective peak areas at time 0. Loss in total integrated area of the chromatogram was attributed to formation of insoluble aggregates. The YTE mutation caused faster monomer loss at 50°C at both pH 6.0 and 7.4, but had no effect on the rate of fragment formation. In addition, the YTE mutant produced higher amounts of soluble aggregates at either pH value, which became evident after 14 d at 50°C. Although minimal amounts were observed until 14 d, the YTE mutant (mAb-E) also produced significantly higher amounts of insoluble aggregates (∼9–11%) compared to mAb-A (∼4–5%) after storage for 28 d at 50°C. To better display these differences in soluble, insoluble, and total aggregate content after incubation for 28 d, the data are shown as bar charts in , respectively. Both mAbs produced higher amounts of insoluble aggregates than soluble aggregates after 28 d storage. At both pH 6.0 and 7.4, the YTE mutant produced higher amounts of soluble and insoluble aggregates. The total aggregate content for the YTE mutant after 28 d of storage is roughly 2-fold higher than the original mAb at both pH values.
Figure 2. Accelerated storage stability of mAb-A and mAb-E after incubation at 50°C for up to 28 d as measured by SEC. The mAbs were formulated in 50 mM sodium phosphate and 150 mM sodium chloride at pH 6.0 and 7.4. (A) The percentage of monomer, fragments, soluble aggregates, and insoluble aggregates of mAb-A and mAb-E analyzed by SEC after incubation at 50°C for 0, 2, 4, 7, 14, and 28 d relative to day zero. Error bars represent one standard deviation for duplicate analyses of duplicate vials. Bar charts representing the percentage of soluble, insoluble, and total aggregate content in mAb-A and mAb-E after incubation for 28 d at 50°C are shown at (B) pH 6.0 and at (C) pH 7.4.
Identifying the effects of YTE mutation on the backbone flexibility
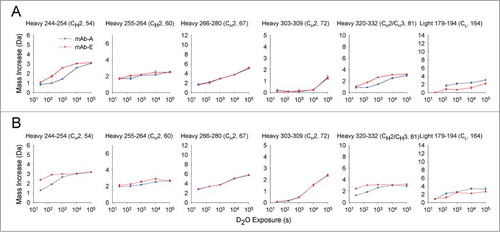
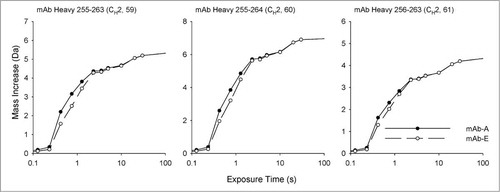
Amide H/D exchange with mass spectrometric detection was used to measure the effects of the YTE mutation on protein amide backbone flexibility. As an initial step in the analysis of both mAbs by H/D-exchange mass spectrometry, a peptic peptide map was developed. A total of 167 common peptides were reproducibly obtained by pepsin digestion of both mAb-A and mAb-E, resulting in 92% and 96% sequence coverage in the light chain and heavy chain, respectively, as shown in Figure S1. The 2 mAbs were incubated in deuterium-containing solutions, quenched at various time points and passed through a pepsin column. The deuterium content of the peptides was determined by LC-MS (see Methods section). Examples of deuterium uptake plots for 6 different segments from mAb-A and mAb-E at pH 6.0 and 7.4 are shown in , respectively. The shapes of the different deuterium uptake profiles illustrate the different degrees of flexibility in different regions of the mAb. Similar deuterium uptake profiles for all 167 common peptides found in both mAb-A and mAb-E at pH 6.0 and 7.4 are presented in Figures S2 and S3. Differences in deuterium uptake between mAb-A and mAb-E at various exchange times were found in 4 of the 6 peptides shown in (HC 244–254, HC 255–264, HC 320–332, and LC 179–194) at both pH 6.0 and 7.4. However, not all of these differences exceed the 99% confidence interval for significance (see below). The segment locations in the primary sequence of mAb-A or mAb-E corresponding to peptide numbers are tabulated in Table S1.
Figure 3. Effect of the YTE triple mutation on deuterium uptake of 6 peptide segments from mAb-A and mAb-E at (A) pH 6.0, and (B) pH 7.4. Domain location and peptide number of the segment are shown in parentheses. The error bars represent one standard deviation from 3 independent experiments.
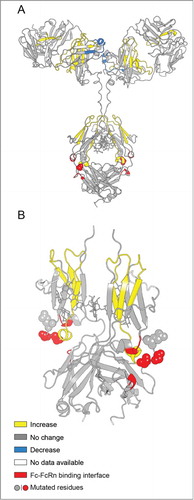
To more clearly display the effects of the YTE mutation on deuterium uptake for all peptide segments, the data are presented as differential deuterium uptake as described previously.Citation33 The differential deuterium uptake, i.e., ΔΔm(t)= ΔmmAb-E(t)−ΔmmAb-A(t) where Δm represents the measured mass increase upon deuteration for each peptide, is plotted as a vertical bar ( for pH 6.0 and for pH 7.4) and t denotes the labeling time. A positive value for ΔΔm indicates that the YTE mutation caused faster exchange, corresponding to increased flexibility, while a negative value indicates slower exchange, corresponding to decreased flexibility. The dotted lines denote the 99% confidence interval (±0.59 Da) for a statistically significant difference in exchange. The 99% confidence interval was determined by pooling all standard deviation values for triplicate measurements in our earlier studies with another IgG1 mAbCitation33,Citation34 and this study. Differential exchange that exceeds the 99% confidence interval is mapped onto a homology model for the mAb in , and in more detail for the Fc portion only in . The YTE mutation-induced increases in local flexibility are colored in yellow, decreases in blue, and no changes in gray. The absence of H/D exchange data is shown in white. The H/D exchange results are discussed in detail in the next section.
Figure 4. Differential deuterium uptake at 5 exposure times for 167 common peptide segments of mAb-E relative to mAb-A at pH 6.0. Average mass corresponding to each exposure time for each segment is calculated based on 3 independent measurements. The horizontal axes denote the ordinal peptide numbers assigned based on peptide midpoints spread in ascending order from the N-to-C termini of the heavy chain followed by the light chain of mAb-A or mAb-E. Positive and negative vertical bars imply increased or decreased deuterium uptake, respectively, for a segment in mAb-E compared to mAb-A. The dashed lines at ±0.59 Da indicate the 99% confidence limits for significant differences. Domain locations shown on the top of the figure are approximate as some segments span 2 neighboring domains. Alternate shades of white and gray in the background demarcate domain boundaries. Shades in pink demarcate segments with residues of Fc epitopes of Fc-FcRn binding interfaces. The red circles denote segments that contain the YTE mutations. Segment locations in the mAb-A/mAb-E sequence corresponding to peptide numbers can be found in Table S1 in the supporting information.
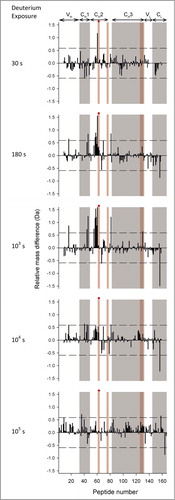
Figure 5. Differential deuterium uptake at 5 exposure times for 167 common peptide segments of mAb-E relative to mAb-A at pH 7.4. Refer to the legend for for description of the figure.
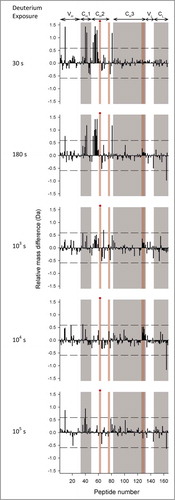
Figure 6. Effect of the YTE mutation (mAb-E) on the local flexibility of the native mAb (mAb-A) at pH 6.0 as measured by H/D-MS plotted on the homology models of (A) intact mAb-A and (B) Fc domain of mAb-A. Changes in flexibility of particular peptide segments are colored as shown in the legend and are derived from the differential exchange data shown in .
The YTE mutation caused localized increases in backbone flexibility at pH 6.0
At pH 6.0, nearly all of the significant differences in exchange were positive and localized to narrow regions, indicating that the YTE mutation increases flexibility in only a limited number of segments (see ). The highest positive deuterium uptake differences were observed in the HC 244–255 region of the CH2 domain at 103 s followed by 180 s, a region covered by the overlapping peptides HC 238–254, HC 244–254, HC 244–255, HC 245–254, HC 247–254 and HC 247–255 (corresponding to peptide numbers 52, 54–58 in ). The mutation also caused 2 other segments in the CH1 domain (HC 174–188 corresponding to peptide 42 in ) and the CH2-CH3 interface (HC 320–332 corresponding to peptide 81 in ) to exchange significantly faster. In addition, the YTE mutation caused several other segments (HC 28–46, HC 144–168, HC 159–177, and LC 147–174 corresponding to peptides 12, 36, 40, and 159 in ) to exchange faster than mAb-A. Only one segment, LC 179–194 (corresponding to peptide 165 in ), exchanged more slowly in the YTE-mutant.
Mutation-induced differences in local flexibility at pH 7.4 were similar to differences at pH 6.0
Deuterium uptake by the representative peptides was faster at pH 7.4 than at pH 6.0 (see ), as expected from the known pH dependence of intrinsic deuterium exchange.Citation45 Looking across all of the peptides in , it can be seen that most of the differences in deuterium uptake were at early exchange times (30s and 180s) at pH 7.4 rather than later times (180s and 103s) at pH 6.0. The shift arises from faster intrinsic exchange at pH 7.4.Citation45 Essentially all of the peptide segments that had significant differences in deuterium uptake at pH 6.0 also had significant differences at pH 7.4 (), with only 2 exceptions noted. One segment in the CL domain (LC 147–174 corresponding to peptide 159 in ) had increased deuteration at 105 s in the mutant mAb-E at pH 6.0, but not at pH 7.4. Another segment in the CH2 domain (HC 269–280 corresponding to peptide 68 in ) had increased deuteration at 103 s at pH 7.4, but not at pH 6.0.
Backbone flexibility of the peptide segments containing the YTE mutation
Three overlapping peptide segments covering the YTE mutation sites were detected in the peptic peptide maps of both mAb-A and mAb-E. The H/D exchange kinetics of one of the 3 segments (HC 255–264) is shown in , while data for the 2 others are shown in Supplemental Figures S2 and S3. The point mutations resulted in trends showing slightly faster deuterium exchange in these 3 segments in mAb-E, but observed differences in deuterium uptake at every exchange time were less than the 99% confidence interval for a significant difference. Under typical exchange conditions (i.e., the EX2 kinetic limit), the kinetics of exchange depend on both backbone dynamics and on intrinsic exchange.Citation47,Citation48 When comparing homologous backbone segments with different amino acid sequences, the rate of intrinsic exchange must be considered. We used tabulated values for intrinsic exchangeCitation45,Citation46 to calculate the intrinsic exchange by these segments at pD 6, as shown in . All 3 segments in mAb-A have slightly faster intrinsic exchange compared to mAb-E. The differences in the calculated intrinsic exchange rates oppose the trend observed experimentally in the 2 mAbs. Therefore, the differences in backbone flexibility in the mutation region are likely somewhat larger than they appear in . Given the complex, multi-exponential nature of H/D exchange kinetics, no suitable method has yet been developed to directly correct the experimental results for these differences. It remains possible that the small differences in backbone flexibility induced by the YTE mutation at the mutation sites would be statistically significant if they could be corrected for intrinsic exchange effects.
Figure 7. Calculated intrinsic deuterium exchange rates of 3 peptide segments of mAb-A and mAb-E at pD 6.0 at 25°C. The segment identity and domain location are shown on top of each graph.
Discussion
Previous work has shown that the YTE mutations in the CH2 domain of IgG1 mAbs resulted in ten-fold higher FcRn binding and four-fold longer serum half-life in animal models.Citation23 In-house formulation work (data not shown) and characterization studies,Citation31 however, have shown a relative decrease in physical stability of various mAbs containing the YTE mutations. The purpose of this study was to probe the potential mechanisms of this destabilization by examining the YTE mutation-induced changes in backbone flexibility of an IgG1 mAb and to correlate results to DSC and SEC analysis of physical stability. To accomplish this purpose, 2 IgG1 mAbs were generated with identical primary sequences in the Fab domains, one molecule containing the YTE triple mutations in the Fc domain (mAb-E), while the other molecule had the native IgG1 sequence for the Fc domain (mAb-A). The N-linked glycosylation patterns in the Fc region of mAb-A and mAb-E were overall similar, containing primarily G0F and G1F oligosaccharides (see Figure S4 and Table S2).
DSC is a robust and widely utilized technique to assess the thermal stability of mAbs.Citation49 The endothermic unfolding transitions have been found to be independent of each other and generally irreversible for mAbs.Citation50 In the case of 3 distinct transitions, the peaks can be attributed to unfolding of the CH2 domain followed by the Fab and then the CH3 domain in order of increasing melting temperatures.Citation42 Although both mAbs displayed high thermal stability as measured by DSC, typical for IgG molecules, the mutant mAb-E had relatively lower Tm1 values at both pH 6.0 and 7.4 ( and ). The YTE mutant had ∼7°C lower Tonset value and ∼6.7°C lower Tm1 value compared to mAb-A. There were no differences in the other thermal melting transition temperatures (Tm2 and Tm3) between mAb-A and mAb-E. In addition, accelerated stability studies monitoring mAb dimer and multimer formation by SEC analysis showed that the YTE mutant has a higher aggregation propensity (). Despite these observed relative differences in physical stability, the YTE molecules can be formulated as biopharmaceuticals to be sufficiently stable during manufacturing and long-term storage by appropriate design of formulation conditions, including solution pH, excipients, and dosage form selection.
An examination of the X-ray crystal structures of Fc-YTE of mAb-E (PDB ID 3FJT) and the Fc of mAb-A (PDB ID 3AVE) indicated that there is little structural difference between the 2.Citation14,Citation30 However several adjacent as well as distant segments from the mutation site in the CH2 domain were shown in the current work to have increased flexibility due to the YTE mutations. Earlier reports indicated that single as well as concerted mutations far from the Fc binding epitopes in the Fc region enhanced the IgG1/FcRn binding.Citation25,Citation27 Using the residue numbering scheme of mAb-A or mAb-E, these mutations are P233S/T, F244L, T253Q, V267A/E, N318D, A333V, N364D, A381V/T, M431L).Citation25,Citation27 Several of these previously reported mutations (e.g., F244L, T253Q, V267A/E, N318D, and A333V) are in the peptide segments (HC 244–255, HC 269–280, HC 320–332) that showed increased local flexibility due to the YTE-mutations in our work. Hence, it can be inferred that residues in the segments with increased flexibility in the CH2 domain and the CH2-CH3 interface may have indirect interactions with the conformation of the 255–259 segment, which is the location for YTE-mutations as well as one of the FcRn binding epitopes of Fc.
Additional segments in the Fab region (HC 28–46, HC 144–168, HC 159–177, HC 174–188, and LC 147–174 corresponding to peptide 9, 36, 40, 42 and 158 in ) had increased flexibility in the YTE mutant and the LC 179–194 had decreased flexibility. It is surprising that the YTE mutations in the CH2 domain caused flexibility changes at distant sites in different domains. Molecular dynamics simulations have shown that the 2 arms of the Fab can have polar and non-specific interactions with regions of the Fc not far from the FcRn binding sites.Citation51 Furthermore, recent studies have shown that mAbs with identical Fc but differing Fab sequences, Citation52 as well as mAbs and Fc fusion proteins with the same Fc sequences,Citation53 can bind FcRn differentially with varying pK properties. The H/D exchange data in our study further support the notion that certain segments of the Fab sequence may have some yet-to-be-defined indirect interactions with the 255–259 region in the CH2 domain of the Fc, one of the FcRn binding epitopes. At the same time, the YTE mutation did not cause any changes in the thermal unfolding temperatures of the Fab region measured by DSC ( and ). These results further highlight the complex interrelationships between protein flexibility and conformational stability.Citation32
The YTE mutation increased the flexibility of the 244–255 region of the CH2 domain at both pH 6.0 and 7.4. This region, covered by 6 overlapping segments (peptide numbers 52, 54–58 in ), had the largest magnitude of increase among all differences detected by H/D-MS. This segment is adjacent to the 255–259 segment containing the YTE mutations. A visual comparison of the deuterium uptake kinetic profiles of segments covering the 244–255 region at pH 6.0 show very similar overall shapes across 3 different IgG1 mAbs (mAbs A and E in this study and mAb-B in previous studies) examined in our laboratories, with the midpoint of deuterium uptake at ∼103 s.Citation33,Citation34 Moreover, similar kinetic profiles are evident in H/D-MS studies at pH ∼6 with other IgG1 mAbs in other laboratories. Citation35,Citation38,Citation54 Hence, it can be concluded that this region has similar dynamic behavior across all of these distinct IgG1 mAbs.
Increased flexibility of the 244–255 sequence caused by the YTE mutation (mAb-E vs. mAb-A) correlates with decreased thermal stability of the CH2 domain and increased aggregation propensity. Significant increases in flexibility of this same segment have been correlated previously in our labs in another IgG1 mAb with arginine and sodium thiocyanate-induced decreases in conformational stability, and concomitant increases in the aggregation propensity.Citation33,Citation34 Furthermore, several reports by others have correlated increased flexibility of this same primary sequence segment in the CH2 domain with methionine oxidation,Citation38,Citation39,Citation54 destabilization by deglycosylation,Citation35 changes in glycosylationCitation38 and even decreased stability due to drug conjugation to free cysteine residues.Citation41 The 244–255 segment in the CH2 domain is relatively apolar in nature, with 2 valine residues and 2 phenylalanine residues, and its phenyl rings pack closely with the glycans in crystal structures.Citation30 It is possible that the increased flexibility of the peptide backbone disrupts the packing interactions between the peptide backbone and the glycan chains, leading to unfolding of this hydrophobic segment. This unfolded apolar segment, in turn, may act as a hotspot for subsequent structural alterations that could lead to irreversible aggregation in IgG1 mAbs,Citation55-Citation57 for example, as observed by SEC analysis in this study.
Limiting the flexibility of this particular segment may therefore serve as a good indicator for designing mAbs (and mAb-related products such as IgG-Fc, fusion proteins, or antibody drug conjugates) with higher thermostability and resistance to aggregation. In fact, it has been reported that engineering an additional disulfide bond at the Leu (L) 245 residue between 2 Phe (F) residues in this segment (L245C mutation), and the Lys (K) 337 residue to Cys (C) residues (K337C mutation) in an isolated IgG1 CH2 domain results in an ∼20°C increase in thermal stability, possibly by limiting the flexibility of the segment.Citation58 Furthermore soluble IgG1 CH2 and CH3 domains with engineered disulfides have been shown to have increased thermostability and binding to FcRn.Citation59 Therefore it appears that this particular segment in the CH2 domain, whose sequence is conserved across all human IgG1 mAbs, can act as a destabilizing motif or aggregation hotspot and thus can play a crucial role in modulating the overall physical stability in many IgG1 mAbs.68
Materials and Methods
Materials
Two highly purified IgG1 mAbs, mAb-A and the corresponding YTE (M255Y/S257T/T259E) mutant of the same IgG1, designated mAb-E, were supplied by MedImmune, Gaithersburg, MD. The residue number is slightly different from numbering reported elsewhereCitation14,Citation23 due to the presence of 3 extra amino acids in the sequence of mAb-A/mAb-E. Residue numbers of other IgG1 mAbs mentioned in the Discussion section of this report are adjusted according to the sequence numbering scheme for mAb-A/mAb-E by adding +3 to the residue numbers. Both mAbs were produced in the same cell line and had overall similar N-linked glycosylation patterns in the CH2 domain containing primarily G0F and G1F oligosaccharides (see Fig. S4 and Table S2). In addition, mAb-E had ∼50% C-terminal lysine heterogeneity while mAb-A had little to no C-terminal lysine. The relatively elevated levels of C-terminal lysine heterogeneity of mAb-E was not considered while interpreting our results, as it has been shown previously to have no effect on the pK, stability or conformational dynamics of mAbs.Citation60,Citation61
Both mAb-A and mAb-E showed ∼99% purity as measured by SDS-PAGE analysis (data not shown), and greater than 99% monomer content as measured by SEC (see Results). The mAbs were provided at 100 mg/mL and were buffer exchanged into 50 mM sodium phosphate, 150 mM sodium chloride at pH 6.0 or 7.4. The protein concentration was adjusted to 10 mg/mL based on absorbance at 280 nm measured with an Agilent 8453 UV-visible spectrophotometer. Extinction coefficient values of 1.47 (mg/mL)−1 cm−1 and 1.42 (mg/mL)−1 cm−1 were used for calculation of concentrations of mAb-A and mAb-E, respectively. Anhydrous sodium phosphate dibasic (code number 42437), and monobasic (code number 389870010) were purchased from Acros Organics. Sodium chloride (product number M-11628), LC-MS grade water, acetonitrile, and isopropanol were purchased from Fisher Scientific. TCEP (Catalog # C4706), guanidine hydrochloride (Catalog # 50933), porcine pepsin, acetic acid, deuterium oxide (99+%D; catalog number 151882) were purchased from Fluka/Sigma Aldrich. All chemicals used were of the highest purity grade commercially available from these vendors.
Differential scanning calorimetry
DSC experiments and corresponding data analysis were performed as described previously.Citation34 The mAb-A and mAb-E samples were diluted to 0.5 mg/mL in buffers containing 50 mM sodium phosphate and 150 mM sodium chloride, either at pH 6.0 or 7.4, using the appropriate dilution buffer and filtered by 0.22 μm filter before analysis. All analyses were done in triplicate.
Accelerated storage stability study and analysis by size exclusion chromatography
Both mAb-A and mAb-E were prepared at 0.5 mg/mL in 50 mM sodium phosphate, 150 mM sodium chloride at both pH 6.0 and 7.4. The stock mAb formulations were filtered by passing through 0.22 μm filters (Millipore, Billerica, Massachusetts), aliquoted, 0.5 mL each, into separate 3 mL type 1 glass vials (West Pharmaceutical Services, Exton, Pennsylvania), stoppered with rubber stoppers (West Pharmaceutical Services, Exton, Pennsylvania), crimped, and then stored in a 50°C incubator. Sample filtration, aliquoting, and vial sealing were performed in a pre-sanitized laminar flow hood. Samples were taken out of the incubator and analyzed by SEC at days 0, 2, 4, 7, 14, and 28. SEC was performed and data were analyzed in the same manner as described in our earlier work Citation34 with the following exception. Duplicate vials were analyzed 2 times each by SEC for each incubation time and condition. Hence, the error values for the amounts of mAb monomer, soluble aggregates and fragments measured by SEC were derived from 4 different measurements. The error values for insoluble aggregate content were calculated by propagating the variances in the measurements of monomers, soluble aggregates and fragments.
Preparation of deuterated labeling buffers
Calculated weights of anhydrous sodium phosphate monobasic, dibasic and sodium chloride were added to 90 atom % D2O to prepare 50 mM sodium phosphate, 150 mM sodium chloride at pH 6.0 and 7.4. (90 atom % D was used for consistency with our previous workCitation33,Citation34). Addition of the chemicals did not result in any appreciable change in volume and hence concentrations of buffer components are accurate to 1% of their reported molarities. The pH values reported are directly from pH meter readings without correction for the deuterium isotope effect on pH measurement. Citation62
Hydrogen/deuterium-exchange mass spectrometry
Sample preparation for hydrogen/deuterium exchange experiments followed by LC-MS analyses were performed as described in detail elsewhere.Citation33 H/D exchange sample preparations were performed using the H/DX PAL robot (LEAP Technologies, Carrboro, NC) equipped with temperature-controlled sample drawers. The mAb samples at 10 mg/mL in 50 mM sodium phosphate and 150 mM sodium chloride at either pH 6.0 or 7.4 were diluted 20-fold in 90% deuterated buffer at the same pH at 25°C to initiate deuterium exchange. Exchange reactions were quenched after 30, 180, 103, 104 and 105 s using quench buffer (0.5 M TCEP, 4 M guanidine hydrochloride, and 0.2 M phosphate, pH = 2.4) held at 1°C resulting in a final pH of ∼2.5. Immediately following quench, samples were digested by passing through an immobilized pepsin column prepared in-house,Citation63,Citation64 desalted and concentrated on a reversed phase trap (Peptide Concentration and Desalting Microtrap; Bruker-Michrom, Auburn, CA, USA), separated on a C-18 reversed phase column and mass analyzed (Agilent 6220 time-of-flight LC-MS system). All the columns and tubing were housed inside a refrigerated compartment maintained at 0°C to minimize back-exchange. Deuterium recovery measured separately using fully deuterated peptides ranged from 64–85%.
Mass spectrometry data analysis
A peptic peptide map shown in Figure S1 covering 96% of the heavy chain and 92% of the light chain was constructed from common peptic peptides generated by digestion of both mAb-A and mAb-E. Peptide identities were confirmed using a combination of accurate mass measurement (±10 ppm) and tandem mass spectrometry data from a time-of-flight mass spectrometer and a linear ion trap mass spectrometer, respectively.Citation65 Three replicate sets of H/D-exchange data were processed using HDExaminer (Sierra Analytics, California). Each set of data was manually curated independently to minimize bias by the analyst. Deuterium uptake data averaging and plotting were achieved using an R script. The 99% confidence interval was calculated by combining all of the standard deviations from earlier studies in our laboratories with another IgG1 mAbCitation33,Citation34 and from this study with mAb-A and mAb-E. The newly calculated value for the 99% confidence levels based on approximately 9600 triplicate measurements, with error propagation for the differential measurement, is the same as our previously-established value of ± 0.59 Da. All significant differences in deuterium content between the 2 mAbs were mapped onto the homology model of mAb-A.
Construction of the homology model
The homology model for the Fab and hinge regions of mAb-A were produced with the in silico KOL-Padlan structureCitation66 as a template, using Modeller version 9.12.Citation67 The Fc domain was derived from PDBID: 3AVE, Citation30 which has the same amino acid sequence as mAb-A. Mutations were introduced into this model to represent the YTE residues. Very few changes were observed in the structure after the mutations. Hence, the same homology model was used to represent both mAb-A and mAb-E. Of note, the Fc domain of YTE has been crystallized (3FJT), and the secondary and tertiary structure folds of 3FJT are highly homologous with 3AVE.Citation14 However, the 3FJT structure contains 2 extra residues not present in mAb-A or mAb-E. Therefore, it was not used as a starting structure. The glycan structures in 3AVE were maintained, containing homodimeric G0F sequences, which represent a high population of carbohydrate species found in mAb-A and mAb-E by intact mass spectrometry measurements (Fig. S4).
Disclosure of Potential Conflicts of Interest
RE, SMB, and HSS are employees of MedImmune. RM is a graduate student and CRM, DDW and DBV are professors at The University of Kansas.
Supporting_Information.zip
Download Zip (1.5 MB)Acknowledgments
We thank Dr. Newton Wahome at University of Kansas for his assistance with building homology models for mAb-A and mAb-E. We also thank Dr. Hasige A Sathish from MedImmune for his critical review of this manuscript.
Funding
This study was financially supported by MedImmune and the Kansas Biosciences Authority.
Supplemental Material
Supplemental data for this article can be accessed on the publisher's website.
References
- Beck A, Wurch T, Bailly C, Corvaia N. Strategies and challenges for the next generation of therapeutic antibodies. Nat Rev Immunol 2010; 10:345-52; PMID:20414207; http://dx.doi.org/10.1038/nri2747
- Nelson AL, Dhimolea E, Reichert JM. Development trends for human monoclonal antibody therapeutics. Nat Rev Drug Discov 2010; 9:767-74; PMID:20811384; http://dx.doi.org/10.1038/nrd3229
- Cohen-Solal JFG, Cassard L, Fridman W-H, Sautès-Fridman C. Fc γ receptors. Immunol Lett 2004; 92:199-205; PMID:15081612; http://dx.doi.org/10.1016/j.imlet.2004.01.012
- Raghavan M, Bjorkman PJ. Fc receptors and their interactions with immunoglobulins. Annu Rev Cell Dev Biol 1996; 12:181-220; PMID:8970726; http://dx.doi.org/10.1146/annurev.cellbio.12.1.181
- Ravetch JV, Bolland S. IgG Fc receptors. Annu Rev Immunol 2001; 19:275-90; PMID:11244038; http://dx.doi.org/10.1146/annurev.immunol.19.1.275
- Albanesi M, Daeron M. The interactions of therapeutic antibodies with Fc receptors. Immunol Lett 2012; 143:20-7; PMID:22553779; http://dx.doi.org/10.1016/j.imlet.2012.02.005
- Chen A, McKinley Scott A, Wang S, Shi F, Mucha Peter J, Forest MG, Lai Samuel K. Transient antibody-mucin interactions produce a dynamic molecular shield against viral invasion. Biophys J 2014; 106:2028-36; PMID:24806935; http://dx.doi.org/10.1016/j.bpj.2014.02.038
- Jiang XR, Song A, Bergelson S, Arroll T, Parekh B, May K, Chung S, Strouse R, Mire-Sluis A, Schenerman M. Advances in the assessment and control of the effector functions of therapeutic antibodies. Nat Rev Drug Discov 2011; 10:101-11; PMID:21283105; http://dx.doi.org/10.1038/nrd3365
- Igawa T, Tsunoda H, Kuramochi T, Sampei Z, Ishii S, Hattori K. Engineering the variable region of therapeutic IgG antibodies. mAbs 2011; 3:243-52; PMID:21406966; http://dx.doi.org/10.4161/mabs.3.3.15234
- Nimmerjahn F, Ravetch JV. Translating basic mechanisms of IgG effector activity into next generation cancer therapies. Cancer Immun 2012; 12:13; PMID:22896758
- Strohl WR. Optimization of Fc-mediated effector functions of monoclonal antibodies. Curr Opin Biotechnol 2009; 20:685-91; PMID:19896358; http://dx.doi.org/10.1016/j.copbio.2009.10.011
- Kuo TT, Aveson VG. Neonatal Fc receptor and IgG-based therapeutics. mAbs 2011; 3:422-30; PMID:22048693; http://dx.doi.org/10.4161/mabs.3.5.16983
- Roopenian DC, Akilesh S. FcRn: the neonatal Fc receptor comes of age. Nat Rev Immunol 2007; 7:715-25; PMID:17703228; http://dx.doi.org/10.1038/nri2155
- Oganesyan V, Damschroder MM, Woods RM, Cook KE, Wu H, Dall’Acqua WF. Structural characterization of a human Fc fragment engineered for extended serum half-life. Mol Immunol 2009; 46:1750-5; PMID:19250681; http://dx.doi.org/10.1016/j.molimm.2009.01.026
- Robbie GJ, Criste R, Dall'acqua WF, Jensen K, Patel NK, Losonsky GA, Griffin MP. A novel investigational Fc-modified humanized monoclonal antibody, motavizumab-YTE, has an extended half-life in healthy adults. Antimicrob Agents Chemother 2013; 57:6147-53; PMID:24080653; http://dx.doi.org/10.1128/AAC.01285-13
- Ghetie V, Ward ES. Multiple roles for the major histocompatibility complex class I- related receptor FcRn. Annu Rev Immunol 2000; 18:739-66; PMID:10837074; http://dx.doi.org/10.1146/annurev.immunol.18.1.739
- Zhu X, Meng G, Dickinson BL, Li X, Mizoguchi E, Miao L, Wang Y, Robert C, Wu B, Smith PD, et al. MHC class I-related neonatal Fc receptor for IgG is functionally expressed in monocytes, intestinal macrophages, and dendritic cells. J Immunol 2001; 166:3266-76; PMID:11207281; http://dx.doi.org/10.4049/jimmunol.166.5.3266
- Raghavan M, Bonagura VR, Morrison SL, Bjorkman PJ. Analysis of the pH dependence of the neonatal Fc receptor/immunoglobulin G interaction using antibody and receptor variants. Biochemistry 1995; 34:14649-57; PMID:7578107; http://dx.doi.org/10.1021/bi00045a005
- Kim J-K, Firan M, Radu CG, Kim C-H, Ghetie V, Ward ES. Mapping the site on human IgG for binding of the MHC class I-related receptor, FcRn. Eur J Immunol 1999; 29:2819-25; PMID:10508256; http://dx.doi.org/10.1002/(SICI)1521-4141(199909)29:09%3c2819::AID-IMMU2819%3e3.0.CO;2-6
- Martin WL, West AP, Gan L, Bjorkman PJ. Crystal structure at 2.8 Å of an FcRn/Heterodimeric Fc complex: mechanism of pH-dependent binding. Mol Cell 2001; 7:867-77; PMID:11336709; http://dx.doi.org/10.1016/S1097-2765(01)00230-1
- Vaughn DE, Milburn CM, Penny DM, Martin WL, Johnson JL, Bjorkman PJ. Identification of critical IgG binding epitopes on the neonatal Fc receptor. J Mol Biol 1997; 274:597-607; PMID:9417938; http://dx.doi.org/10.1006/jmbi.1997.1388
- Hinton PR, Johlfs MG, Xiong JM, Hanestad K, Ong KC, Bullock C, Keller S, Tang MT, Tso JY, Vasquez M, et al. Engineered human IgG antibodies with longer serum half-lives in primates. J Biol Chem 2004; 279:6213-6; PMID:14699147; http://dx.doi.org/10.1074/jbc.C300470200
- Dall'Acqua WF, Kiener PA, Wu H. Properties of human IgG1s engineered for enhanced binding to the neonatal Fc receptor (FcRn). J Biol Chem 2006; 281:23514-24; PMID:16793771; http://dx.doi.org/10.1074/jbc.M604292200
- Shields RL, Namenuk AK, Hong K, Meng YG, Rae J, Briggs J, Xie D, Lai J, Stadlen A, Li B, et al. High resolution mapping of the binding site on human IgG1 for Fc gamma RI, Fc gamma RII, Fc gamma RIII, and FcRn and design of IgG1 variants with improved binding to the Fc gamma R. J Biol Chem 2001; 276:6591-604; PMID:11096108; http://dx.doi.org/10.1074/jbc.M009483200
- Monnet C, Jorieux S, Souyris N, Zaki O, Jacquet A, Fournier N, Crozet F, de Romeuf C, Bouayadi K, Urbain R, et al. Combined glyco- and protein-Fc engineering simultaneously enhance cytotoxicity and half-life of a therapeutic antibody. mAbs 2014; 6:422-36; PMID:24492301; http://dx.doi.org/10.4161/mabs.27854
- Petkova SB, Akilesh S, Sproule TJ, Christianson GJ, Al Khabbaz H, Brown AC, Presta LG, Meng YG, Roopenian DC. Enhanced half-life of genetically engineered human IgG1 antibodies in a humanized FcRn mouse model: potential application in humorally mediated autoimmune disease. Int Immunol 2006; 18:1759-69; PMID:17077181; http://dx.doi.org/10.1093/intimm/dxl110
- Hinton PR, Xiong JM, Johlfs MG, Tang MT, Keller S, Tsurushita N. An engineered human IgG1 antibody with longer serum half-life. J Immunol 2006; 176:346-56; PMID:16365427; http://dx.doi.org/10.4049/jimmunol.176.1.346
- Kenanova V, Olafsen T, Crow DM, Sundaresan G, Subbarayan M, Carter NH, Ikle DN, Yazaki PJ, Chatziioannou AF, Gambhir SS, et al. Tailoring the pharmacokinetics and positron emission tomography imaging properties of anti-carcinoembryonic antigen single-chain Fv-Fc antibody fragments. Cancer Res 2005; 65:622-31; PMID:15695407
- Oganesyan V, Damschroder MM, Cook KE, Li Q, Gao C, Wu H, Dall'Acqua WF. Structural insights into neonatal Fc receptor-based recycling mechanisms. J Biol Chem 2014; 289:7812-24; PMID:24469444; http://dx.doi.org/10.1074/jbc.M113.537563
- Matsumiya S, Yamaguchi Y, Saito J-i, Nagano M, Sasakawa H, Otaki S, Satoh M, Shitara K, Kato K. Structural comparison of fucosylated and nonfucosylated Fc fragments of human immunoglobulin G1. J Mol Biol 2007; 368:767-79; PMID:17368483; http://dx.doi.org/10.1016/j.jmb.2007.02.034
- Tavakoli-Keshe R, Phillips JJ, Turner R, Bracewell DG. Understanding the relationship between biotherapeutic protein stability and solid-liquid interfacial shear in constant region mutants of IgG1 and IgG4. J Pharm Sci 2014; 103:437-44; PMID:24357426; http://dx.doi.org/10.1002/jps.23822
- Kamerzell TJ, Middaugh CR. The complex inter-relationships between protein flexibility and stability. J Pharm Sci 2008; 97:3494-517; PMID:18186490; http://dx.doi.org/10.1002/jps.21269
- Majumdar R, Manikwar P, Hickey JM, Samra HS, Sathish HA, Bishop SM, Middaugh CR, Volkin DB, Weis DD. Effects of salts from the Hofmeister series on the conformational stability, aggregation propensity, and local flexibility of an IgG1 monoclonal antibody. Biochemistry 2013; 52:3376-89; PMID:23594236; http://dx.doi.org/10.1021/bi400232p
- Manikwar P, Majumdar R, Hickey JM, Thakkar SV, Samra HS, Sathish HA, Bishop SM, Middaugh CR, Weis DD, Volkin DB. Correlating excipient effects on conformational and storage stability of an IgG1 monoclonal antibody with local dynamics as measured by hydrogen/deuterium-exchange mass spectrometry. J Pharm Sci 2013; 102:2136-51; PMID:23620222; http://dx.doi.org/10.1002/jps.23543
- Houde D, Arndt J, Domeier W, Berkowitz S, Engen JR. Characterization of IgG1 conformation and conformational dynamics by hydrogen/deuterium exchange mass spectrometry. Anal Chem 2009; 81:2644-51; PMID:19265386; http://dx.doi.org/10.1021/ac802575y
- Chen G, Warrack BM, Goodenough AK, Wei H, Wang-Iverson DB, Tymiak AA. Characterization of protein therapeutics by mass spectrometry: recent developments and future directions. Drug Discov Today 2011; 16:58-64; PMID:21093608; http://dx.doi.org/10.1016/j.drudis.2010.11.003
- Rose RJ, van Berkel PHC, van den Bremer ETJ, Labrijn AF, Vink T, Schuurman J, Heck AJR, Parren PWHI. Mutation of Y407 in the CH3 domain dramatically alters glycosylation and structure of human IgG. mAbs 2013; 5:0-1; PMID:23406897; http://dx.doi.org/10.4161/mabs.23532
- Houde D, Peng Y, Berkowitz SA, Engen JR. Post-translational modifications differentially affect IgG1 conformation and receptor binding. Mol Cell Proteomics 2010; 9:1716-28; PMID:20103567; http://dx.doi.org/10.1074/mcp.M900540-MCP200
- Zhang A, Hu P, Macgregor P, Xue Y, Fan H, Suchecki P, Olszewski L, Liu A. Understanding the conformational impact of chemical modifications on monoclonal antibodies with diverse sequence variation using hydrogen/deuterium exchange mass spectrometry and structural modeling. Anal Chem 2014; 86:3468-75; PMID:24597564; http://dx.doi.org/10.1021/ac404130a
- Zhang A, Singh S, Shirts M, Kumar S, Fernandez E. Distinct aggregation mechanisms of monoclonal antibody under thermal and freeze-thaw stresses revealed by hydrogen exchange. Pharm Res 2012; 29:236-50; PMID:21805212; http://dx.doi.org/10.1007/s11095-011-0538-y
- Pan LY, Salas-Solano O, Valliere-Douglass JF. Conformation and dynamics of interchain cysteine-linked antibody-drug conjugates as revealed by hydrogen/deuterium exchange mass spectrometry. Anal Chem 2014; 86:2657-64; PMID:24512515; http://dx.doi.org/10.1021/ac404003q
- Ionescu RM, Vlasak J, Price C, Kirchmeier M. Contribution of variable domains to the stability of humanized IgG1 monoclonal antibodies. J Pharm Sci 2008; 97:1414-26; PMID:17721938; http://dx.doi.org/10.1002/jps.21104
- Iacob RE, Bou-Assaf GM, Makowski L, Engen JR, Berkowitz SA, Houde D. Investigating monoclonal antibody aggregation using a combination of H/DX-MS and other biophysical measurements. J Pharm Sci 2013; 102:4315-29; PMID:24136070; http://dx.doi.org/10.1002/jps.23754
- Hawe A, Wiggenhorn M, van de Weert M, Garbe JHO, Mahler H-c, Jiskoot W. Forced degradation of therapeutic proteins. J Pharm Sci 2012; 101:895-913; PMID:22083792; http://dx.doi.org/10.1002/jps.22812
- Bai Y, Milne JS, Mayne L, Englander SW. Primary structure effects on peptide group hydrogen exchange. Proteins: Struct Funct Bioinform 1993; 17:75-86; PMID:8234246; http://dx.doi.org/10.1002/prot.340170110
- Connelly GP, Bai Y, Jeng MF, Englander SW. Isotope effects in peptide group hydrogen exchange. Proteins: Struct Funct Bioinform 1993; 17:87-92; PMID:8234247; http://dx.doi.org/10.1002/prot.340170111
- Hvidt A, Nielsen SO. Hydrogen exchange in proteins. Adv Protein Chem 1966; 21:287-386; PMID:5333290; http://dx.doi.org/10.1016/S0065-3233(08)60129-1
- Englander SW, Kallenbach NR. Hydrogen exchange and structural dynamics of proteins and nucleic acids. Q Rev Biophys 1983; 16:521-655; PMID:6204354; http://dx.doi.org/10.1017/S0033583500005217
- Vermeer AW, Norde W. The thermal stability of immunoglobulin: unfolding and aggregation of a multi-domain protein. Biophys J 2000; 78:394-404; PMID:10620303; http://dx.doi.org/10.1016/S0006-3495(00)76602-1
- Vermeer AW, Norde W, van Amerongen A. The unfolding/denaturation of immunogammaglobulin of isotype 2b and its F(ab) and F(c) fragments. Biophys J 2000; 79:2150-4; PMID:11023918; http://dx.doi.org/10.1016/S0006-3495(00)76462-9
- Kortkhonjia E, Brandman R, Zhou JZ, Voelz VA, Chorny I, Kabakoff B, Patapoff TW, Dill KA, Swartz TE. Probing antibody internal dynamics with fluorescence anisotropy and molecular dynamics simulations. mAbs 2013; 5:306-22; PMID:23396076; http://dx.doi.org/10.4161/mabs.23651
- Wang W, Lu P, Fang Y, Hamuro L, Pittman T, Carr B, Hochman J, Prueksaritanont T. Monoclonal antibodies with identical Fc sequences can bind to FcRn differentially with pharmacokinetic consequences. Drug Metab Disposition 2011; 39:1469-77; PMID:21610128; http://dx.doi.org/10.1124/dmd.111.039453
- Suzuki T, Ishii-Watabe A, Tada M, Kobayashi T, Kanayasu-Toyoda T, Kawanishi T, Yamaguchi T. Importance of neonatal FcR in regulating the serum half-life of therapeutic proteins containing the Fc domain of human IgG1: a comparative study of the affinity of monoclonal antibodies and Fc-fusion proteins to human neonatal FcR. J Immunol 2010; 184:1968-76; PMID:20083659; http://dx.doi.org/10.4049/jimmunol.0903296
- Burkitt W, Domann P, O'Connor G. Conformational changes in oxidatively stressed monoclonal antibodies studied by hydrogen exchange mass spectrometry. Protein Sci 2010; 19:826-35; PMID:20162626; http://dx.doi.org/10.1002/pro.362
- Alsenaidy MA, Kim JH, Majumdar R, Weis DD, Joshi SB, Tolbert TJ, Middaugh CR, Volkin DB. High-throughput biophysical analysis and data visualization of conformational stability of an IgG1 monoclonal antibody after deglycosylation. J Pharm Sci 2013; 102:3942-56; PMID:24114789; http://dx.doi.org/10.1002/jps.23730
- Kayser V, Chennamsetty N, Voynov V, Forrer K, Helk B, Trout BL. Glycosylation influences on the aggregation propensity of therapeutic monoclonal antibodies. Biotechnol J 2011; 6:38-44; PMID:20949542; http://dx.doi.org/10.1002/biot.201000091
- Alsenaidy MA, Okbazghi SZ, Kim JH, Joshi SB, Middaugh CR, Tolbert TJ, Volkin DB. Physical stability comparisons of IgG1-Fc variants: effects of N-glycosylation site occupancy and Asp/Gln residues at site Asn 297. J Pharm Sci 2014; 103:1613-27; PMID:24740840; http://dx.doi.org/10.1002/jps.23975
- Gong R, Vu BK, Feng Y, Prieto DA, Dyba MA, Walsh JD, Prabakaran P, Veenstra TD, Tarasov SG, Ishima R, et al. Engineered human antibody constant domains with increased stability. J Biol Chem 2009; 284:14203-10; PMID:19307178; http://dx.doi.org/10.1074/jbc.M900769200
- Ying T, Chen W, Feng Y, Wang Y, Gong R, Dimitrov DS. Engineered soluble monomeric IgG1 CH3 domain: generation, mechanisms of function, and implications for design of biological therapeutics. J Biol Chem 2013; 288:25154-64; PMID:23867459; http://dx.doi.org/10.1074/jbc.M113.484154
- Tang L, Sundaram S, Zhang J, Carlson P, Matathia A, Parekh B, Zhou Q, Hsieh MC. Conformational characterization of the charge variants of a human IgG1 monoclonal antibody using H/D exchange mass spectrometry. mAbs 2013; 5:114-25; PMID:23222183; http://dx.doi.org/10.4161/mabs.22695
- Khawli LA, Goswami S, Hutchinson R, Kwong ZW, Yang J, Wang X, Yao Z, Sreedhara A, Cano T, Tesar D, et al. Charge variants in IgG1: isolation, characterization, in vitro binding properties and pharmacokinetics in rats. mAbs 2010; 2:613-24; PMID:20818176; http://dx.doi.org/10.4161/mabs.2.6.13333
- Glasoe P, Long F. Use of glass electrodes to measure acidities in deuterium oxide. J Phys Chem 1960; 64:188-190; http://dx.doi.org/10.1021/j100830a521
- Wang L, Pan H, Smith DL. Hydrogen exchange-mass spectrometry: optimization of digestion conditions. Mol Cell Proteomics 2002; 1:132-8; PMID:12096131; http://dx.doi.org/10.1074/mcp.M100009-MCP200
- Busby SA, Chalmers MJ, Griffin PR. Improving digestion efficiency under H/D exchange conditions with activated pepsinogen coupled columns. Int J Mass spectrom 2007; 259:130-9; http://dx.doi.org/10.1016/j.ijms.2006.08.006
- Majumdar R, Manikwar P, Hickey JM, Arora J, Middaugh CR, Volkin DB, Weis DD. Minimizing carry-over in an online pepsin digestion system used for the H/D exchange mass spectrometric analysis of an IgG1 monoclonal antibody. J Am Soc Mass Spectrom 2012; 23:2140-8; PMID:22993047; http://dx.doi.org/10.1007/s13361-012-0485-9
- Padlan EA. Anatomy of the antibody molecule. Mol Immunol 1994; 31:169-217; PMID:8114766; http://dx.doi.org/10.1016/0161-5890(94)90001-9
- Šali A, Blundell TL. Comparative protein modelling by satisfaction of spatial restraints. J Mol Biol 1993; 234:779-815; PMID:8254673; http://dx.doi.org/10.1006/jmbi.1993.1626
- Majumdar R, Middaugh CR, Weis DD, Volkin DB. Hydrogen–deuterium exchange mass spectrometry as an emerging analytical tool for stabilization and formulation development of therapeutic monoclonal antibodies. J Pharm Sci 2014; PMID:25354868; http://dx.doi.org/10.1002/jps.24224