
Abstract
Cationic lipid DNA complex (CLDC) is an immunostimulatory preparation that has significant anti-leukemic effects in multiple murine models of leukemia: BCR-ABL+ myelogenous leukemia in C3H/HeJ animals, and myelomonocytic leukemia in BALB/c mice. Following leukemic challenge, CLDC treatment inhibits tumor cell growth in vivo and extends survival, sometimes resulting in apparent eradication of tumor cells. CLDC induces multiple cytokines including interferon-gamma (IFN-γ), and intravenous treatment results in a more rapid and robust response than subcutaneous treatment. IFN-γ is induced in a dose-dependent manner, and tachyphylaxis results from repeated doses of CLDC. Tachyphylaxis of therapeutic effects is exacerbated at higher doses, thus the optimal survival benefits are seen at intermediate doses. Animals whose leukemia has been successfully treated with CLDC exhibit a survival advantage when faced with a secondary leukemic challenge, suggesting the existence of an adaptive anti-leukemic response. This work demonstrates the effectiveness of CLDC in multiple experimental leukemias and is consistent with a stimulation of a lasting TH1 anti-leukemic immune response.
Acknowledgements
We thank Nate Sheaffer and David Stanford of the Flow Cytometry Core Facility at Penn State Hershey Cancer Institute/Milton S. Hershey Medical Center for their help with acquisition and analysis of flow cytometry data. We thank the faculty and staff of the Penn State Comparative Medicine Department at Penn State College of Medicine for their care of animals used in this work. This work was funded in part by The Penn State University Kiesendahl Family Endowed Leukemia Research Fund and The Kenneth Noel Memorial Fund.
Financial Disclosure
Supported by NCI SBIR R41 CA114803-01 A1, The Penn State University Kiesendahl Family Endowed Leukemia Research Fund and The Kenneth Noel Memorial Fund.
Figures and Tables
Figure 1 Single IV doses of CLDC were associated with accumulation within the splenic marginal zones of numerous pale-staining macrophages, consistent with innate immune activation (7 days post IV administration).
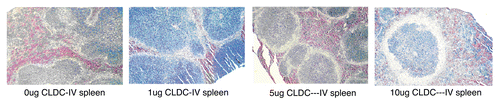
Figure 2 IFNγ is induced following IV CLDC treatment. Unchallenged BALB/c mice (n = 5 per group) were treated with 5 µg CLDC by IV injection (A) and serum was collected at indicated time points for ELISA analysis. Unchallenged BALB/c mice (n = 5 per group) were given 5 µg CLDC by IV injection (B). The IV dose was repeated 1, 3, 7, 10 or 14 days later and IFNγ levels were measured from serum samples taken 6 hours later.
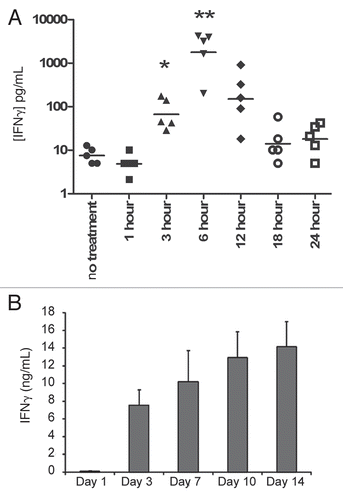
Figure 3 CLDC administration results in a dose-dependent induction of IFNγ that exhibits tachyphylaxis. (A) IFNγ levels of 32D/BA-GFP-challenged C3H/HeJ mice display a dose-dependent induction. Serum samples were drawn six hours after the indicated IV dose of CLDC. Individual measurements are displayed for each mouse following the day 3 treatment. p < 0.01 for 0 µg vs. 10 µg, 0 µg vs. 30 µg and 10 µg vs. 30 µg. p < 0.05 for 0 µg vs. 20 µg and 10 µg vs. 20 µg. 20 µg vs. 30 µg not significantly different. (B) Average and standard deviation values from treatments on days 3, 10, 18 and 24 are graphed, revealing a decrease in IFNγ levels following repeated CLDC treatment. Significant differences are noted: 10 µg Day 3 vs. 18: p < 0.01. 20 µg Day 3 vs. 18, 10 vs. 18, 3 vs. 24 and 10 vs. 24, p < 0.01. 30 µg Day 3 vs. 10 and 3 vs. 24: p < 0.05, Day 3 vs. 18 p < 0.001.
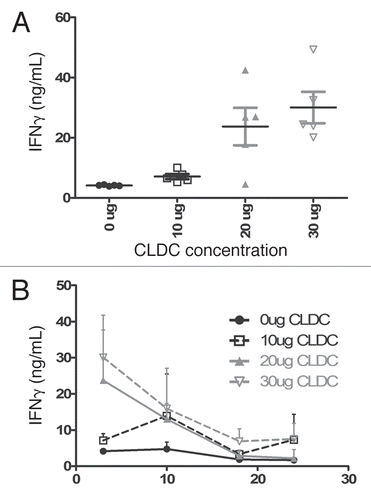
Figure 4 CLDC therapy shows dose dependent anti-leukemic effects. Animals received IV CLDC at doses of 0.1 µg, 1 µg or 5 µg on days 2 and 9 following 32D/BA-GFPchallenge. p < 0.05 for control vs. 0.1 µg and 1 µg vs. 5 µg. p < 0.01 for all other pair-wise comparisons.
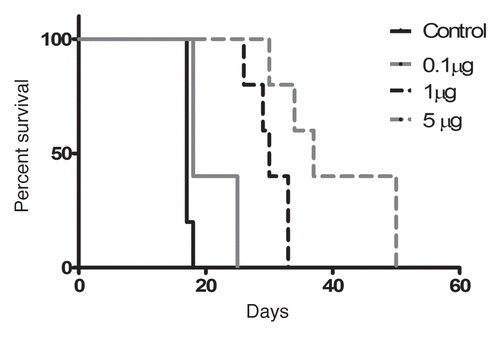
Figure 5 CLDC treatment inhibits tumor burden growth and extends survival. Mice were challenged with 32D/BA-GFP and treated with weekly IV injections of 0, 10, 20 or 30 µg CLDC from days 3 through 24 after challenge. Mice were periodically monitored for circulating tumor burden by flow cytometry. (A) Flow cytometric analysis of a representative mouse is shown from each treatment group. GFP-positive cells are displayed in green, with % GFP-positive cells noted for each plot. (B) Percent GFP-positive cells in individual mouse is graphed versus time (n = 5 per group). (C) Survival of CLDC-treated mice depends on IV dose administered; p < 0.01 for control vs. 10 µg, control vs. 20 µg and 10 µg vs. 20 µg.
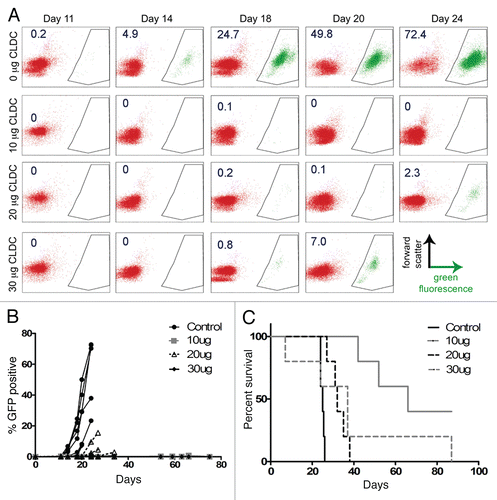
Figure 6 CLDC extends survival in BALB/c mice in a dose-dependent manner. WEHI-3B-challenged BALB/c mice were treated on days 3, 10, 17 and 24 with IV injections of 0, 10 or 20 µg CLDC and followed for survival. Control vs. 20 µg and 10 µg vs. 20 µg, p < 0.01.
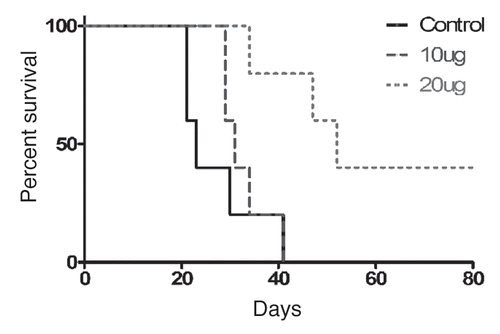
Figure 7 Successful treatment with CLDC provides benefit during secondary challenge. Mice challenged with 32D/BCR-ABL die within 34 days if left untreated (upper right corner insert, n = 10). Group 1 mice received 32D/BA-GFP challenge on Day 0 and died by day 19 (n = 5 per group). Group 2 mice were treated with 10 µg IV CLDC on Day-46 and Day-32 relative to 32D/BA-GFP and also died by day 19. Group 3 mice received an initial challenge with 32D/BCR-ABL on day-60, were treated with CLDC as in Group 2 and survived significantly longer in response to 32D/BA-GFP challenge (10–17 day increase in survival, p < 0.01).
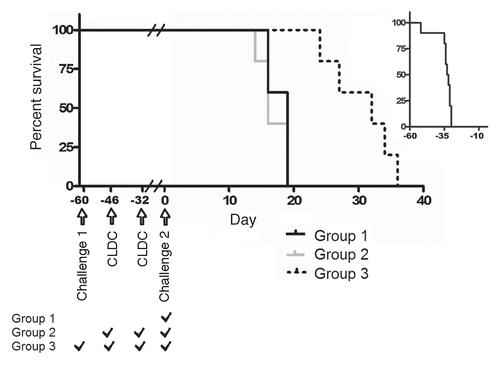
Table 1 Cytokine levels following IV or SC CLDC treatment