Abstract
D-glucuronyl C5-epimerase (GLCE) is a potential tumor-suppressor gene involved in heparan sulfate biosynthesis. GLCE expression is significantly decreased in breast tumors; however, the underlying molecular mechanisms remain unclear. This study examined the possible epigenetic mechanisms for GLCE inactivation in breast cancer. Very little methylation of the GLCE promoter region was detected in breast tumors in vivo and in breast cancer cells (MCF7 and T47D) in vitro and GLCE expression in breast cancer cells was not altered by 5-deoxyazacytidine (5-aza-dC) treatment, suggesting that promoter methylation is not involved in regulating GLCE expression. Chromatin activation by Trichostatin A (TSA) or 5-aza-dC/TSA treatment increased GLCE expression by two to 3-fold due to an increased interaction between the GLCE promoter and the TCF4/β-catenin transactivation complex, or H3K9ac and H3K4Me3 histone modifications. However, ectopic expression of TCF4/β-catenin was not sufficient to activate GLCE expression in MCF7 cells, suggesting that chromatin structure plays a key role in GLCE regulation. Although TSA treatment significantly repressed canonical WNT signaling in MCF7 cells, it did not influence endogenous TCF4/β-catenin mRNA levels and activated TCF4/β-catenin-driven transcription from the GLCE promoter, indicating GLCE as a novel target for TCF4/β-catenin complex in breast cancer cells. A correlation was observed between GLCE, TCF4 and β-catenin expression in breast cancer cells and primary tumors, suggesting an important role for TCF4/β-catenin in regulating GLCE expression both in vitro and in vivo. Taken together, the results indicate that GLCE expression in breast cancer is regulated by a combination of chromatin structure and TCF4/β-catenin complex activity.
Introduction
Human D-glucuronyl C5-epimerase (GLCE, NM_015554) is one of the key enzymes involved in the biosynthesis of heparan sulfate proteoglycans (HSPGs), which play an integral role in cell-cell and cell-matrix interactions and signaling.Citation1-Citation4 GLCE catalyzes the epimerization of D-glucuronic acid residues in the heparan sulfate (HS) polysaccharide chains into L-iduronic acid residues, which impart flexibility to the HS chains and facilitate their interaction with numerous extracellular ligands, including extracellular matrix (ECM) components and growth factors.Citation5-Citation7
GLCE activity is important for physiological processes such as B-cell maturation and differentiation,Citation8 lymphangiogenesis,Citation9 heparin biosynthesis by mast cells,Citation10 development of zebra fishCitation11 and neuronal development.Citation12 Despite fragmentary knowledge regarding the biological functions of GLCE under normal physiological conditions, a crucial role of the gene is supported by data on the neonatal lethality of Glce (−/−) knockout mice.Citation9,Citation13 These results suggest that functional disturbance of GLCE expression/activity and the consequent changes in composition and structure of cell surface HSPGs may be related to different pathological states, including cancer.Citation14
We recently showed that GLCE is involved in malignant transformation and that GLCE expression is significantly decreased in breast tumorsCitation15,Citation16 and small-cell lung cancer cell lines.Citation17 It was also shown that the ectopic expression of GLCE inhibits cancer cell proliferation in vitro and tumor growth in vivo, suggesting a potential tumor-suppressor function for GLCE in breast and lung tissues.Citation17-Citation19 However, the molecular mechanism(s) underlying downregulation of GLCE in cancer remains unclear.
Previous studies show that the β-catenin-TCF4 transactivation pathway plays a major role in modulating GLCE expression in human colon carcinoma cell lines in vitro,Citation20 overexpression of the EJ-ras oncogene decreases D-glucuronosyl C-5 epimerase mRNA levels in rabbit endothelial cells,Citation21 and that miR-218 represses expression of GLCE in DLD colon cancer cells.Citation22 To date, only these three papers have been published on this matter, and it is still unknown whether GLCE is regulated in a similar manner in other cancers, whether the mechanisms involved are applicable in vivo, and what other molecular mechanisms may be involved in the process.
Therefore, the present study examined the possible involvement of epigenetic mechanisms, as well as the β-catenin-TCF4 activating complex, in the downregulation of GLCE in breast cancer.
Results
The GLCE promoter is not methylated in human breast tumors
To check whether promoter hypermethylation could be responsible for changes in GLCE expression in breast tumors, 18 breast cancer clinical samples and appropriate control tissues with different GLCE expression levels were selected (18 matched pairs). GLCE expression level in the samples was determined by multiplex RT-PCR analysis with GAPDH gene as an internal control ().
Figure 1.GLCE expression in the human breast tumors. (A) Representative RT-PCR electropherogram, (B) GLCE expression in tumor samples T, related to the match control breast tissue samples C, 1 – similar expression in both samples, upper and down – upregulation or downregulation of GLCE expression, respectively, 301–328 - patients.
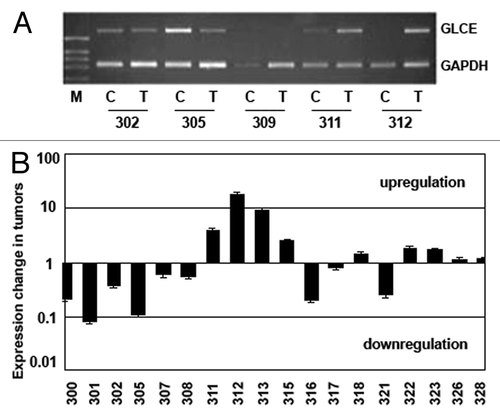
Among the samples under investigation, there were both breast tumors with normal or elevated epimerase expression (compared with the matched control sample) and tumors with significantly decreased or lost GLCE expression.
The methylation status of GLCE promoter-associated CpG islands in the clinical samples and breast cancer cell lines (MCF7 and T47D) was analyzed using methylation-specific PCR (MSP) and bisulphite sequencing ().
Figure 2. Methylation of GLCE promoter-associated CpG islands in human breast tumors and cancer cell lines. (A) Schematic showing the CpG islands in the GLCE promoter region. Location of methylation-specific and bisulphite sequencing PCR primers are indicated by arrows. (B) Methylation-specific PCR for the GLCE promoter region. 300–328 - breast tumors, C and T, control and tumor breast tissues (match pairs from each patient); PC, positive PCR control; NC, negative PCR control; M, DNA marker; M and U, primers for methylated or unmethylated DNA sequences, respectively. (C and D) Bisulphite sequencing of breast tumors (C) and breast cancer cell lines MCF7 and T47D (D) using the BS1 primer pair. 300 and 301 patients, 7 different E. coli clones (1–7) were sequenced for each breast tumor or cell line, open and black circles are non-methylated and methylated CpG dinucleotides, respectively.
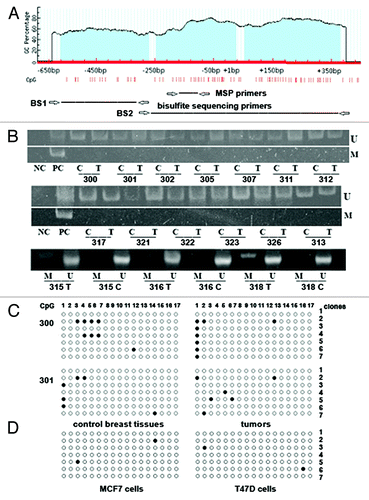
Almost all clinical samples tested were completely unmethylated at the GLCE promoter region according to methylation-specific PCR (). Bisulphite sequencing of 16 samples (eight breast tumors and eight matched non-tumor control tissues) using two different primers pairs confirmed the MSP results (). GLCE promoter methylation in the studied breast tumors was not more than 5–7% and did not show any specific methylation pattern in the different tumors. Also, the GLCE promoter was not methylated in MCF7 and T47D cells ().
GLCE expression in breast cancer cells is activated by TSA but not by 5-aza-deoxyazacytidine treatment in vitro
To confirm the MSP and bisulphite sequencing data and to further study GLCE regulation, MCF7 and T47D cells were treated with the DNA demethylating agent 5-aza-deoxycytidine (5-aza-dC), the histone-deacetylase inhibitor Trichostatin A (TSA), or both. GLCE expression levels were determined by multiplex RT-PCR and qRT-PCR using GAPDH and β-actin, respectively, as a reference ().
Figure 3. Activation of GLCE expression in MCF7 breast carcinoma cells by 5-aza-deoxycytidine or Trichostatin A. The intensity of the amplified GLCE DNA fragments was normalized to that of GAPDH (multiplex RT-PCR) and β-actin (Taqman-based qReal-Time RT-PCR). Bars represent the mean ± SD from triplicate experiments, **p < 0.01 – p values between MCF7 - TSA400-treated MCF7 and MCF7 - aza-TSA400-treated MCF7 data points (OriginPro 8.1). 5-aza-dC, 5-aza-deoxycytidine; TSA, Trichostatin A.
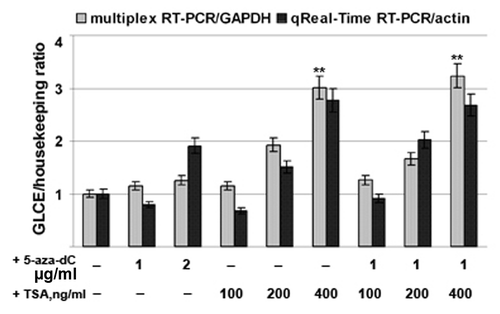
The results showed that treatment with 5-aza-dC had no effect upon GLCE expression both in MCF7 and T47D cancer cells (data not shown), supporting the MSP and bisulphite sequencing results. Taken together, these data suggest that promoter methylation is not involved in the regulation of GLCE expression in human breast cancer cells in vitro or in breast tumors in vivo.
On the other hand, GLCE expression was clearly upregulated by 2–3-fold after TSA treatment, suggesting for the first time the possible involvement of chromatin structure in the regulation of GLCE expression in breast tumors.
Chromatin structure at the GLCE promoter is associated with activation of GLCE in breast cancer cells
A specific action of TSA on experimental breast cancer cells was confirmed by western blot analysis using antibodies to the active chromatin markers acetylated H3 lysine 9 (H3K9ac) and trimethylated H3 lysine 4 (H3K4me3), and the repressive chromatin marker, trimethylated H3 lysine 9 (H3K9me3). TSA treatment caused a marked increase in the histone isoforms H3K9ac and H3K4me3, which are associated with active chromatin, while the repressive histone marker H3K9me3 was not affected by the treatment (). Next, chromatin immunoprecipitation (ChIP) analysis was performed to identify any direct involvement of TSA-activated chromatin in the upregulation of GLCE expression in TSA-treated MCF7 cells. Combined treatment with 5-aza-dC and TSA increased the precipitation of the GLCE promoter region by ChIP-grade antibodies to H3K9ac and H3K4me3, along with an increase in GLCE expression, suggesting the direct involvement of chromatin structure in GLCE regulation (). Surprisingly, TSA treatment alone did not increase the association between the GLCE promoter and the H3K9ac and H3K4me3 histone modifications (whereas GLCE expression was increased in the cells). This suggests the involvement of other unidentified transcription factor(s), which may mediate increased GLCE expression in MCF7 cells upon TSA treatment.
Figure 4. Involvement of chromatin structure in GLCE activation upon TSA treatment. (A) Changes in the expression of different histone modifications in MCF7 cells after 5-aza-dC and TSA treatment. Western blot (WB) analysis with specific antibodies. (B) Chromatin immunoprecipitation assay for the GLCE promoter region. Chromatin DNA was immunoprecipitated with ChIP-grade antibodies and DNA fragments corresponding to 183 bp in the GLCE promoter region were amplified by PCR. The amount of immunoprecipitated DNA was normalized to that of the input DNA. *p < 0.05 – p values between MCF7 - aza-TSA400-treated MCF7 data points.
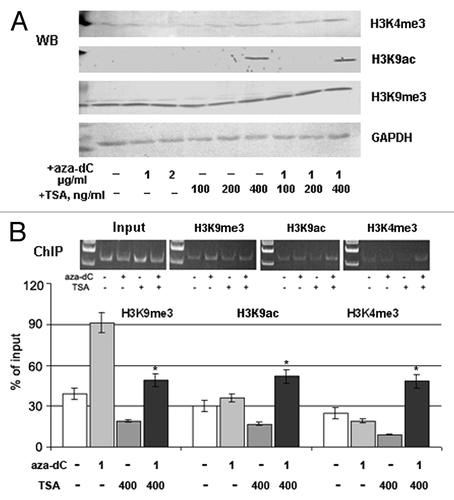
Collectively, these results indicate that chromatin structures associated with histone modifications are involved in the regulation of GLCE expression in breast tissues, along with unknown TSA- or chromatin-activated positive GLCE regulators.
The Wnt/β-catenin pathway in MCF7 cells is repressed by TSA
One of the primary candidates for the transcriptional regulation of GLCE expression in breast cancer cells may be the Wnt/β-catenin pathway, which modulates GLCE expression in colon carcinoma cell lines in vitro (Ghiselli and Agrawal, 2005).
To check the possible activation of Wnt signaling in MCF7 cells upon TSA treatment, we used the Wnt Signaling Pathway PCR Array (SABiosciences), which identifies changes in the expression of 84 Wnt pathway-focused genes. The obtained data were analyzed using a companion scoring algorithm that converts gene expression data into quantitative measurements of pathway activity ().
Figure 5. Wnt pathway repression in TSA-treated MCF7 breast cancer cells. (A) Fold changes in the expression of 84 genes relevant to the Wnt signaling pathway. Fold change in normalized gene expression in the Test Sample (TSA-treated MCF7 cells) divided by the normalized gene expression in the Control Sample (MCF7 cells). The middle line shows similar expression in both groups with 2-fold change boundaries. (B) Pathway activity score for Wnt signaling in experimental samples relative to control samples.
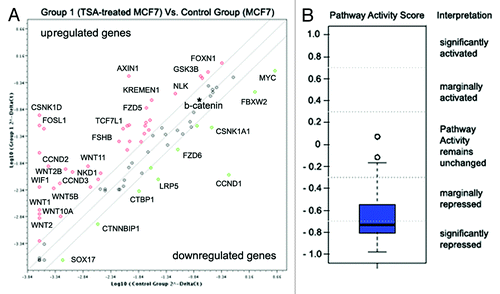
The pathway activity score, based on gene expression changes, identified significant repression of WNT signaling activity in TSA-treated MCF7 cells (-0.73), mainly due to inactivation of the canonical WNT/Ctnn-β signaling pathway (upregulation of WNT inhibitors AXIN, WIF1, and downregulation of Frizzled co-receptor LRP5 and the WNT targets, MYC and CCND1).
Interestingly, the non-canonical WNT-Frizzled signaling pathway did not show any evident repression; to the contrary, increased expression of the characteristic proteins WNT1, WNT5 and WNT11 was detected along with the WNT antagonist, NKD1, which specifically blocks Ctnn-β but stimulates the JNK/WNT/PCP cascade. Taken together, the results suggest that TSA treatment of MCF7 cells causes an imbalance in the canonical and non-canonical WNT signaling pathways in favor of the WNT/PCP or WNT/ Ca2+ cascades.
Considering that previous data suggest that GLCE expression in human colon carcinoma cell lines is regulated via the β-catenin-TCF4 transactivation complex,Citation20 we analyzed the expression of the genes more carefully. According to the array, β-catenin (CTNNB1) expression was not changed in TSA-treated MCF7 cells (fold change, +1.08); however, TCF4 was not included in the array. Therefore, to further clarify the involvement of TCF4 and β-catenin in regulating GLCE expression in breast cancer cells, we studied the expression levels of these genes in breast cancer cells in vitro and in primary breast tumors in vivo.
TCF4, β-catenin, and GLCE expression correlate in breast tumors in vivo
TCF4, β-catenin (CTNNB1) and GLCE expression was determined in primary breast tumors (matched tumor/control tissues) and MCF7 breast carcinoma cells both before and after 5-aza-dC and/or TSA treatment by multiplex RT-PCR ( and ).
Figure 6.GLCE, TCF4 and β-catenin expression in human breast tumors in vivo. (A) The intensity of the amplified DNA fragments was normalized to that of GAPDH (multiplex RT-PCR). Bars represent the mean ± SD from triplicate experiments; Pearson's correlation coefficients are shown (OriginPro 8.1). (B) A tumor/control ratio for GLCE, TCF4 and β-catenin expression calculated for each clinical sample. 300–326, breast tumors; C and T, control and tumor breast tissues (match pairs from each patient).
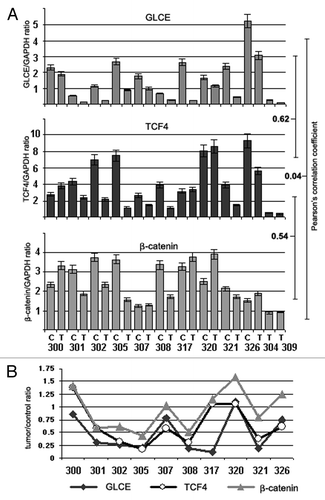
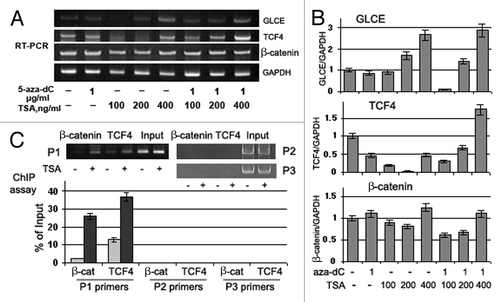
Figure 7. Effects of Trichostatin A on GLCE, TCF4 and β-catenin expression and GLCE transcriptional activation in MCF7 breast carcinoma cells in vitro. (A) GLCE, TCF4 and β-catenin expression upon treatment with 5-aza-deoxycytidine (5-aza-dC) and/or Trichostatin A (TSA). Representative multiplex RT-PCR electropherogram with GAPDH gene as an internal control. (B) Intensity of the amplified DNA fragments normalized to that of GAPDH. Bars represent the mean ± SD of triplicate experiments (OriginPro 8.1). (C) ChIP assay for the GLCE promoter region with anti-TCF4 or anti-β-catenin antibodies. DNA fragments corresponding to TCF4-responsive region of the GLCE promoter were amplified using P1 primers, TCF4-non-responsive promoter regions were amplified with P2 and P3 primers as control. The amount of immunoprecipitated DNA was normalized to that of the input DNA, TSA concentration was 400 ng/ml.
In the breast cancer clinical samples (tumors and appropriate control tissues), a moderate positive correlation was found between GLCE and TCF4 expression (r = 0.62, p < 0.01) and between TCF4 and β-catenin expression (r = 0.54, p < 0.01) (). This was even more evident when a tumor/control ratio (calculated for each matched pair) was used for correlation analysis (Pearson correlation coefficients GLCE/TCF4 = 0.86, p < 0.05; GLCE/β-catenin = 0.68, p < 0.05; and TCF4/β-catenin = 0.81, p < 0.01) ().
The data clearly showed a positive correlation between GLCE, TCF4 and β-catenin expression changes in breast tumor tissues, supporting the involvement of the TCF4/β-catenin complex in GLCE regulation in breast cancer in vivo.
TSA treatment induces the interaction between the TCF4/β-catenin complex and the GLCE promoter in MCF7 cells in vitro
The multiplex RT-PCR data for TCF4 and β-catenin expression in MCF7 cells confirmed the WNT array results and showed constitutive β-catenin and TCF4 expression in these cells ().
5-aza-dC or TSA treatments did not affected β-catenin expression significantly whereas TCF4 expression was downregulated in 5-aza-dC- or TSA-treated MCF7 cells. Combined treatment with 5-aza-dC and TSA increased TCF4 expression by up to 2-fold and GLCE expression by up to 1.7-fold. A moderate positive correlation between GLCE, TCF4 and β-catenin changes expression was observed in treated breast carcinoma cells in vitro (Pearson correlation coefficients GLCE/TCF4 = 0.61, p < 0.07; GLCE/β-catenin = 0.71, p < 0.05; and TCF4/β-catenin = 0.50, p < 0.1), which supported the in vivo results ().
To confirm the direct involvement of the TCF4/β-catenin transactivation complex in GLCE regulation in breast cancer cells, chromatin immunoprecipitation was performed with anti-TCF4 or anti-β-catenin antibodies on control (low GLCE expression) and TSA-treated (increased GLCE expression) MCF7 cells. Although TSA treatment did not influence β-catenin mRNA level and even decreased TCF4 mRNA (), the interaction between TCF4 and β-catenin and the GLCE promoter sequence was significantly increased at the TCF4-responsive region (). Specificity of the interaction was confirmed using primer pairs for TCF4-non-resposive promoter regions (primers P2 and P3).
All together, the results indicate an important role for chromatin structure in the formation of active TCF4/β-catenin transcriptional complex at GLCE promoter.
Upregulation of TCF4 and β-catenin expression alone is not sufficient to activate GLCE expression in MCF7 cells in vitro
To study the effects of TCF4/β-catenin activation on GLCE expression in breast cancer in more detail, MCF7 breast carcinoma cells were transfected with TCF4- and/or β-catenin-expressing plasmids followed by GLCE expression analysis. Immunofluorescent staining showed that TCF4 and β-catenin expression was significantly increased in the transfected cells with high co-transfection efficiency. Surprisingly, ectopic overexpression of TCF4 and β-catenin did not increase GLCE expression in transfected MCF7 cells, suggesting that the TCF4/β-catenin complex alone was not sufficient to activate GLCE in breast cancer cells (data not shown). However, chromatin activation by TSA () was sufficient to recruit the TCF4/β-catenin transactivation complex to the GLCE promoter region () and increase expression of the gene (). Taken together, these results indicate that chromatin structures associated with H3K9ac and H3K4me3 histone modifications, together with the TCF4/β-catenin complex, contribute to the regulation of GLCE expression in human breast cancer tissues.
Discussion
Epigenetic regulation is one of the fundamental ways of organizing and coordinating the activity of numerous genes and cellular pathways.Citation23,Citation24 Since inactivation of tumor-suppressor genes often occurs as a consequence of hypermethylation within the promoter regions,Citation25 and GLCE is a potential tumor-suppressor gene,Citation17,Citation18 hypermethylation of the GLCE promoter was our primary candidate for GLCE inactivation in breast cancer. The hypothesis was supported by the fact that hypermethylation is also involved in regulating the expression of a number of HSPGs and HS biosynthetic enzymes, such as the tumor-suppressor gene glycosyltransferase EXT1,Citation26 the 3-OST sulfotransferase genes (3-OST1, 3-OST2 and 3-OST3A) in H-EMC-SS chondrosarcoma cellsCitation27 and 3-OST-2 in human breast cancer cell lines and in breast, colon, lung and pancreatic cancers.Citation28 Promoter hypermethylation was identified as one of the mechanisms underlying HS sulfatase-1 (HSulf-1) gene silencing in human breast and gastric cancersCitation29 and HSPG glypican-3 (GPC3) silencing in human breast cancer.Citation30 Surprisingly, no methylation of the GLCE promoter was found in breast tumors or breast cancer cell lines, identifying GLCE as the first gene belonging to the HSPG biosynthetic machinery that is not regulated by promoter methylation.
According to the results of the present study, a complex combination of chromatin structure, TCF4 expression and, possibly, other TSA- or chromatin-activated positive GLCE regulators, controls the transcriptional regulation of GLCE expression in breast cancer. Of these, chromatin remodeling appears to be the key factor that keeps expression under control because only the TSA-activated TCF4/β-catenin complex (but not ectopic TCF4/β-catenin expression) upregulated GLCE expression in breast cancer cells. This is in line with published data regarding the involvement of chromatin structure/histone modifications in regulating the expression of some glycosyltransferases and tumor-suppressor genes. It was shown that N-acetylglucosaminyltransferase IX and several other neural glycosyltransferase genes are regulated by epigenetic histone modifications.Citation31 Promoter methylation-associated gene silencing of the TMS1 tumor-suppressor gene is accompanied by H3K9 hypoacetylation and trimethylation, which are reversed after 5-aza-dC and/or TSA treatment. Interestingly, TSA is more efficient than 5-aza-dC in inducing TMS1 expression, and the combination of 5-aza-dC and TSA results in marked synergistic reactivation of the gene.Citation32 Similar data were shown for the RIZ1 tumor-suppressor gene; neither 5-aza-dC nor TSA reversed promoter methylation, but contributed to the dynamic conversion of trimethylated to acetylated H3K9 at the promoter, and restored RIZ1 expression with a marked synergistic effect.Citation33 A complex interplay between promoter hypermethylation and chromatin activation is supported further by data showing that, despite CpG dinucleotide hypermethylation in TCF4 exon 1 (strongly associated with gene silencing), treatment with TSA restored TCF4 expression in TCF4-silenced gastric cancer cell lines.Citation34
Chromatin regulation was shown for the tumor-suppressor gene DKK1 (a potent inhibitor of the Wnt signal transduction pathway), which did not show significant levels of methylation in the promoter region; however, its expression was increased significantly upon TSA treatment due to increased histone acetylation and chromatin accessibility.Citation35
Collectively, these data strongly suggest an involvement for chromatin structure in regulation of the expression of tumor-suppressor genes along with promoter hypermethylation.
A pivotal role for chromatin remodeling in GLCE activation in breast cancer cells is supported by our results regarding TSA-induced TCF4/β-catenin activation () or ectopic TCF4/β-catenin expression in breast cancer cells. Specific overexpression of the TCF4/β-catenin complex (transient transfection with the appropriate plasmids) was not sufficient to increase GLCE expression in MCF7 cells, whereas chromatin activation by TSA facilitated the interaction between endogenous TCF4/β-catenin complex and the GLCE promoter, which successfully induced GLCE expression. The synergistic action of 5-aza-dC/TSA suggests also the possible involvement of some other transcriptional co-factor(s), which is indirectly activated by 5-aza-dC/TSA or chromatin remodeling.Citation36
Another important aspect to be discussed is the functional role of the TCF4/β-catenin complex and WNT signaling in modulating GLCE expression in cancer cells. A major role for the β-catenin-TCF4 transactivation pathway in modulating GLCE expression was identified in human colon cancer cells.Citation20 Interestingly, GLCE expression in these cells was highly correlated with the degree of β-catenin-transcription complex activation; co-transfection with excess TCF4 and β-catenin activated the GLCE promoter in the reporter assay and increased GLCE expression in HCT116 cells constitutively expressing low levels of β-catenin and TCF4. By contrast, neither β-catenin nor β-catenin/TCF4 were able to upregulate GLCE expression in SW480 cells, which constitutively express higher levels of the β-catenin/TCF4 complex and GLCE, although TCF4 alone did increase GLCE promoter activity in a reporter assay.Citation20 In this study, TCF4/β-catenin-expressing MCF7 breast cancer cells were used, and no GLCE upregulation was observed upon co-transfection of β-catenin and TCF4. Dependence of the TCF4 effect on target gene expression from the overall WNT pathway activity in experimental cells was also shown for osteopontin expression in MCF10AT and Rama37 breast cancer cells, which possess differential Wnt signaling competency.Citation37 Taken together, the results of the present study underline the importance of endogenous TCF4/β-catenin expression levels in the TCF4/β-catenin-related experiments, and identify GLCE as a novel downstream target of WNT/β-catenin signaling in breast cancer cells.Citation38
On the other hand, a feedback loop may exist between GLCE expression and Wnt signaling through GLCE substrates, such as HSPGs. It was shown that HSPGs are involved in the activation of specific Wnt pathways:Citation39 the HSPG glypican-4 (GPC4) regulates β-catenin-dependent and -independent Wnt signaling by concentrating Wnt3a and Wnt5a close to their specific receptors within different membrane microdomainsCitation40 and the HSPG biosynthetic enzyme, 2-OST, is an essential component of the canonical Wnt signaling pathway during zebrafish development.Citation41 Our observations that ectopic GLCE expression in stably-transfected MCF7 cell clones decreases β-catenin, but not TCF4, expression in cells suggests the possible involvement of GLCE in the regulation of WNT signaling in breast cancer cells (unpublished data).
Interestingly, TSA treatment significantly repressed WNT signaling activity in MCF7 cells (mainly due to selective inactivation of the canonical WNT/Ctnn-β signaling pathway) and activated the expression of its downstream target, GLCE, due to chromatin remodeling. Possibly, simultaneous repression of canonical WNT signaling pathway and upregulation of the tumor-suppressor gene, GLCE, in breast cancer cells may be one of the potential molecular mechanisms underlying the anti-tumor effects of TSA.Citation42-Citation44
Taken together, the presented data show complex transcriptional regulation of GLCE expression in breast cancer cells, in which the combined effects of chromatin structure and TCF4/β-catenin complex activity are necessary to maintain GLCE expression. Possibly, low GLCE expression in breast cancer cells is due to the fact that the GLCE promoter is inaccessible to the TCF4/β-catenin transactivation complex because of a change in the chromatin structure in cancer cells.
Materials and Methods
Patients and tissue samples
All tissue samples were obtained from primary breast tumors during radical surgery at the Central Municipal Hospital N1, Novosibirsk, Russia. Tissues were “snap-frozen” in liquid nitrogen and stored at –70°C. Regions were manually dissected from the frozen blocks to provide a consistent tumor cell content of more than 70% for analysis. The prevalent histological type of the tumors was duct infiltrating cancer, with different degrees of malignancy. Most patients were at the second stage of malignancy progression according the TNM formula. All patients provided written informed consent and the study protocol was approved by the Local Ethics Committee in accordance with the Helsinki Declaration of 1975.
Cell lines, cell culture and 5-aza-dC/TSA treatment
The human breast cancer cell lines, MCF7 and T47D, were obtained from the Karolinska Institute (Stockholm, Sweden). Cells were maintained in IMDM medium supplemented with 2 mM L-glutamine, 100 units penicillin, 100 µg/ml streptomycin, and 10% (v/v) fetal bovine serum at 37°C in a humidified 5% CO2. For analysis, cells were harvested using trypsin/EDTA (Sigma). Treatment with deoxyazacytidine (5-aza-dC, 1 or 2 µg/ml) or Trichostatin A (TSA, 100, 200 or 400 ng/ml) was performed by incubating the cells with the drugs for 72 h or 24 h, respectively. For combined treatment, the cells were incubated with 5-aza-dC (1 µg/ml) for 48 h followed by TSA (100, 200 or 400 ng/ml) for an additional 24 h. Cells were harvested using trypsin/EDTA.
Analysis of GLCE, CTNNB1 and TCF4 expression using multiplex RT-PCR
Multiplex RT-PCR analysis of GLCE expression was performed as described previously.Citation17,Citation18 Briefly, total RNA was extracted from the cells using the PureLink Total RNA Purification System (Invitrogen), cDNA was synthesized from 1–2 µg of total RNA using a First Strand cDNA Synthesis kit (Fermentas), and 1/10th of the product was subjected to PCR analysis. The following conditions were used for multiplex RT-PCR for GLCE: 95°C for 10 min, 95°C for 15 sec, 59°C for 15 sec, and 72°C for 1 min, with a final elongation step at 72°C for 10 min using a Tercik PCR machine (DNA-technology, Russia). The total reaction volume was 20 µl. GLCE and GAPDH (housekeeping gene) were amplified for 32 and 20 cycles, respectively. The PCR primers used were: GLCE-F, 5′-AAGGGAGACGAGAGGGGAACGAA-3′; GLCE-R, 5′-GCCACCTTTCTCATCCTGGTTC-3′; GAPDH-F, 5′-GGGCGCCTGGTCACAA-3′; GAPDH-R, 5′-AACATGGGGGCATCAGCAGA-3′. The following conditions were used for multiplex RT-PCR for TCF4 and CTNNB1: 95°C for 10 min, 95°C for 15 sec, 59°C for TCF4 or 61°C for CTNN1 for 20 sec, 72°C for 1 min, and 72°C for 10 min using a Tercik PCR machine (DNA-technology, Russia). The total reaction volume was 20 µl. TCF4, CTNN1 and GAPDH were amplified for 32, 29 and 20 cycles, respectively. The PCR primers were: TCF4-F: 5′- CCAGTGAAGGTGTATCCTTGCAACT-3′; TCF4-R: 5′-GCCACCTTTCTCATCCTGGTTCC-3′; CTNN1-F: 5′- CCAGTGAAGGTGTATCCTTGCAACT-3′; CTNN1-R: 5′- CTACCGGTGTGCTTTGCCCTGCTGC -3′. The amplified products were separated on 1.2% agarose gels. The gels were scanned using the “DNA Analyzer” system (Vilber Lourmat) and GLCE, TCF4 or CTNNB1 expression levels were estimated from the intensity of the amplified DNA fragments normalized against the intensity of GAPDH using the TotalLab program (Nonlinear Dynamics, UK).
Analysis of GLCE expression by quantitative TaqMan-based Real-Time RT-PCR
Quantitative real-time RT-PCR (qRT-PCR) was performed using the BioRad IQ5 Multicolor Real-Time PCR Detection System (BioRad) and the GLCE TaqMan Custom Assay (Applied Biosystems) under the following conditions: 95°C for 3 min, followed by 40 cycles at 95°C for 10 sec and 60°C for 30 sec. The total reaction volume was 25 µl. β-actin (ACTB) was used as the housekeeping gene. The PCR primers and TaqMan probes used were: GLCE-F, 5′-TTCCAAAGTCTATGCACAGAGAGC-3′; GLCE-R, 5′-TCCACATTGTAGCCTTCAAAAGACA-3′; GLCE-probe, 5′-FAM-CCCCTATCACCCCGATGGT-TAMRA-3′; β-actin-F, 5′-GGCACCCAGCACAATGAAG-3′, β-actin-R, 5′-GCCGATCCACACGGAGTACT-3′, β-actin-probe, 5′-FAM-TCAAGATCATTGCTCCTCCTGAGCGC-TAMRA-3′.
Genomic DNA isolation and bisulphite conversion
Genomic DNA was isolated from the tissue samples using the E.Z.N.А. DNA isolation kit and bisulphite conversion of the genomic DNA was performed using an E.Z.N.A. DNA methylation kit (Zymo Research) according to the manufacturer’s instructions.
Methyl-specific PCR
Methyl-specific PCR for GLCE fragment amplification was performed with primers specific for the methylated (M) and unmethylated (U) DNA sequences within GLCE CpG islands. Blood genomic (g)DNA, treated with SssI methyltransefrase (New England Biolabs), was used as a positive control for the Met-primers. The following conditions were used for PCR: 95°C for 4 min, followed by 45 cycles of 95°C for 30 sec, 60–65°C for 30 sec, and 72°C for 30 sec, with a final elongation step at 72°C for 7 min. The reaction mixture contained 1 × DreamTaq buffer, 0.2 mM dNTP’s, 0.4 µM primers, 3.5% DMSO, 50–100ng of bisulphite-converted DNA and 1.25 U of DreamTaq DNA-polymerase (Fermentas). The total reaction volume was 30 µl; 10 µl of the amplified products were separated on 10% polyacrylamide (PAGE) and visualized by ethidium bromide staining. The PCR primers were: GLCE-M-F, 5-TTGGTCGTAGTAGATTTCGAGTTTTGTC-3′; GLCE-M-R, 5-CGCGCAACCGAAAAACCG-3′; GLCE-U-F, 5-TTGAGTTTTGTTGTTTGTTTTGTAGTT-3′; GLCE-U-R, 5-TATAAAAAAAACCCTCCCACTCCA-3′.
Bisulphite sequencing
Amplification of the GLCE DNA fragment for bisulphite sequencing was performed using bisulphite-treated gDNA and primers specific for two overlapping GLCE CpG-island sequences, BS1 and BS2 (GLCE-BS1-F, 5′-GTATTTTAATAATGGTGTTTTGTTTGAG-3′; GLCE-BS1-R, 5′- CCAAAAATAATAAAAAACAATAAACTTTC-3′; GLCE-BS2-F, 5′- GAAAGTTTATTGTTTTTTATTATTTTTGGT-3′; GLCE-BS2-R, 5′- ACCCCCAAAATCCCTAATACATTAC-3′). The following conditions were used for PCR: 94°C for 2 min, followed by 35 cycles of 94°C for 30 sec, 56°C for 30 sec and 72°C for 1 min, with a final elongation step at 72°C for 10 min. The total reaction volume was 30 µl. The PCR products were purified using a DNA Clean and Concentrator Kit (Zymo Research) and cloned into a TOPO-vector using a TOPO TA Cloning Kit for Sequencing (Invitrogen) according to the manufacturer’s instructions. Plasmid DNA was isolated using a Zyppy Plasmid Miniprep Kit (Zymo Research) according to the manufacturer’s protocol. Sequencing was performed using a BigDye Terminator Cycle Sequencing Ready Reaction kit v1.1 and ABI Prism 3100 Genetic Analyzer (Applied Biosystems) according to the manufacturer’s protocol (8–10 clones were analyzed for each sample).
Western blotting
Cells were lysed with RIPA-buffer (1% Nonidet P-40, 150 mM NaCl, 0.1% SDS, 50 mM Tris, pH 7.4) containing “Complete” Protease Inhibitor Cocktail (Roche), sonicated and centrifuged for 10 min at 12 000 g. The protein concentration was quantified using Quant-iT Protein Assay Kit (Invitrogen). Total proteins (30 μg) were treated with NuPAGE LDS Sample Buffer (Invitrogen) containing 10% β-mercaptoethanol for 5 min at 100°C, resolved in 10% SDS-PAGE gels and transferred to PVDF membranes. The membranes were blocked with 5% milk for 1 h and incubated with primary antibodies [rabbit anti-GLCE polyclonal serum (GenScript Corporation), 1:2000; mouse anti-H3K4Me3 (Abcam), 1:500; mouse anti-H3K9Me3 (Abcam), 1:500 or rabbit anti-H3K9ac (Invitrogen), 1:500] overnight at 4°C followed by secondary peroxidase-conjugated antibodies [goat anti-Mouse IgG (Abcam) or polyclonal goat anti-rabbit (Pierce)] for 1 h at RT. Proteins were detected with an Opti-4CN Substrate Kit (Bio-Rad) according to the manufacturer's instructions.
Chromatin immunoprecipitation (ChIP) assay
ChIP was performed using a MAGnify Chromatin Immunoprecipitation System (Invitrogen) according to the manufacturer's instructions. Briefly, cells were rinsed in cold PBS and treated with 1% formaldehyde at RT for 10 min and lysed in lysis buffer containing protease inhibitors for 5 min on ice. Lysates were sonicated on ice in a MicrosonTM Ultrasonic Liquid Processor XL-2000 cell disrupter, yielding chromatin fragments of 500–1000 bp. Samples were centrifuged at 13000 × g for 10 min and the supernatants were collected. To provide a positive control (Input), 20 µl of the supernatants were retained. The supernatants were diluted 10-fold with dilution buffer. Protein A/G mix Dynabeads were incubated with 3 µg of monoclonal antibodies against modified histones, H3K9ac, H3K9me3, H3K4me3, and TCF4 and β-catenin, or with normal rabbit or mouse IgG for 1 h at 4°C followed by precipitation with a DynalMPC-S magnet (Invitrogen). Precipitates were incubated with 100 µl of diluted cell lysate for 2 h at 4°C. The Dynabeads were then washed with IP1 and IP2 washing buffers and incubated with Stock Reverse Crosslinking buffer containing proteinase K for 15 min at 55°C. The supernatant was transferred into fresh Eppendorf tubes and incubated for 15 min at 95°C. PCR amplification was performed using three primer pairs specific for the GLCE promoter site: TCF4-binding region-specific primers P1-F 5′ - TCC CAA GAA GTG TGA TTC CTA GGA GA – 3′, P1-R 5′ - TCA CCC ACA GCA AGA AGT GCC CT – 3′; P2-F 5′-GCCACCCCTTCTCTGCTGTC-3′, P2-R 5′-GCTCCGGGCTTTCTAACCTG-3′ and P3-F 5′-GCACTTCTTGCTGTGGGTGAG-3′, P3-R 5′-TTCCTAGCCTTTCCTCTATAATGTGAG-3′. The PCR products were analyzed by PAGE electrophoresis. The gels were scanned using the ”DNA Analyzer” system (Vilber Lourmat) and the interaction between histones and the GLCE promoter sequence was estimated from the intensity of the amplified GLCE fragment normalized against the intensity of the input control (TotalLab program, Nonlinear Dynamics).
Wnt Signaling Pathway RT2 Profiler PCR Array
The WNT Signaling Pathway PCR Array (SABioscience) was used to determine changes in the expression of 84 Wnt pathway-focused genes upon TSA treatment in MCF7 cells. Briefly, total RNA was isolated using an RNAqueous Micro Kit (Applied Biosystems). The RNA concentration was determined using a Quant-iT Assay Kit (Invitrogen) and was verified by electrophoresis. cDNA was synthesized from 1–2 μg of total RNA using a First Strand cDNA Synthesis kit (Fermentas). Real-Time PCR was performed using a WNT Signaling Pathway PCR Array with SYBR Green PCR Master Mix (Fermentas) and an iCycler iQ5 Multicolor Detection System (Bio-Rad) according to the manufacturer's instructions. All data were analyzed using Excel-based PCR Array Data Analysis Software (SABioscience). This integrated web-based software package automatically calculates the ΔΔCt-based -fold changes in gene expression from the uploaded raw threshold cycle data. Each replicate cycle threshold (Ct) was normalized to the average Ct of five endogenous controls (B2M, HPRT1, RPL13A, GAPDH and ACTB) on a per plate basis. The obtained data were analyzed using a companion scoring algorithm that converts gene expression data into quantitative measurements of pathway activity.
Immunocytochemistry
For immunofluorescence analysis, cells were grown on glass coverslips and then transfected with human TCF4 and/or β-catenin pcDNA3-expressing plasmids and the appropriate control plasmids using Lipofectamine Plus Reagent (Invitrogen) according to the manufacturer's instructions. pcDNA/Myc TCF4 and pcDNA/Myc DeltaN TCF4 were kindly provided by Dr B. Vogelstein (Johns Hopkins University and the Howard Hughes Medical Institute), human β-catenin pcDNA3 was kindly provided by Dr E.R. Fearon (Regents of the University of Michigan), pcDNA3-EGFP was kindly provided by Dr D.Golenbock (University of Massachusetts, Worcester). After 36 h, the transfected cells were fixed with phosphate-buffered 4% formaldehyde. Anti-GLCE custom rabbit polyclonal serum (GenScript Corporation; 1:100), mouse monoclonal anti-TCF4 (Abcam; 1:100) and rabbit monoclonal anti-β-catenin (Abcam; 1:500) were used for immunostaining. Staining patterns were visualized with Alexa 488-conjugated goat anti-mouse IgG and Alexa 546-conjugated goat anti-rabbit IgG (Invitrogen; 1:1000) antibodies. The cells were mounted and counterstained with DAPI using SlowFade Gold and DAPI mounting medium (Invitrogen) and observed under a fluorescence microscope (Axio Imager, Carl Zeiss).
Statistical analysis
Pearson’s correlation was used to determine the association between GLCE, TCF4 and β-catenin expression. Correlation coefficients (r) were calculated using a computer program ORIGIN Pro 8.0, p < 0.05 was considered statistically significant.
Acknowledgments
The authors thank Dr Bystrov A.A. and Grigoriev A.D. for the help with statistical analysis. The work was supported by the research grants from Russian Foundation for Basic Research (11–04–90400-Ukr_f_а); Ukranian State Foundation of Fundamental Research (F40/146–2011, F46/457–2011); Swedish Institute (2011/00888); UICC International Cancer Technology Transfer Fellowship (TYP, ICRETT-09–069); FEBS Short-term Fellowship (TYP); Karolinska Institute; ERZ was supported by the Swedish Cancer Society and Swedish Research Council.
Disclosure of Potential Conflicts of Interest
No potential conflicts of interest were disclosed.
References
- Sarrazin S, Lamanna WC, Esko JD. Heparan sulfate proteoglycans. Cold Spring Harb Perspect Biol 2011; 3; http://dx.doi.org/10.1101/cshperspect.a004952; PMID: 21690215
- Kim SH, Turnbull J, Guimond S. Extracellular matrix and cell signalling: the dynamic cooperation of integrin, proteoglycan and growth factor receptor. J Endocrinol 2011; 209:139 - 51; http://dx.doi.org/10.1530/JOE-10-0377; PMID: 21307119
- Ori A, Wilkinson MC, Fernig DG. The heparanome and regulation of cell function: structures, functions and challenges. Front Biosci 2008; 13:4309 - 38; http://dx.doi.org/10.2741/3007; PMID: 18508513
- Malavaki CJ, Theocharis AD, Lamari FN, Kanakis I, Tsegenidis T, Tzanakakis GN, et al. Heparan sulfate: biological significance, tools for biochemical analysis and structural characterization. Biomed Chromatogr 2011; 25:11 - 20; http://dx.doi.org/10.1002/bmc.1536; PMID: 21204109
- Jia J, Maccarana M, Zhang X, Bespalov M, Lindahl U, Li JP. Lack of L-iduronic acid in heparan sulfate affects interaction with growth factors and cell signaling. J Biol Chem 2009; 284:15942 - 50; http://dx.doi.org/10.1074/jbc.M809577200; PMID: 19336402
- Catlow KR, Deakin JA, Wei Z, Delehedde M, Fernig DG, Gherardi E, et al. Interactions of hepatocyte growth factor/scatter factor with various glycosaminoglycans reveal an important interplay between the presence of iduronate and sulfate density. J Biol Chem 2008; 283:5235 - 48; http://dx.doi.org/10.1074/jbc.M706589200; PMID: 18156180
- Chua CC, Rahimi N, Forsten-Williams K, Nugent MA. Heparan sulfate proteoglycans function as receptors for fibroblast growth factor-2 activation of extracellular signal-regulated kinases 1 and 2. Circ Res 2004; 94:316 - 23; http://dx.doi.org/10.1161/01.RES.0000112965.70691.AC; PMID: 14684627
- Reijmers RM, Groen RW, Kuil A, Weijer K, Kimberley FC, Medema JP, et al. Disruption of heparan sulfate proteoglycan conformation perturbs B-cell maturation and APRIL-mediated plasma cell survival. Blood 2011; 117:6162 - 71; http://dx.doi.org/10.1182/blood-2010-12-325522; PMID: 21471524
- Reijmers RM, Vondenhoff MF, Roozendaal R, Kuil A, Li JP, Spaargaren M, et al. Impaired lymphoid organ development in mice lacking the heparan sulfate modifying enzyme glucuronyl C5-epimerase. J Immunol 2010; 184:3656 - 64; http://dx.doi.org/10.4049/jimmunol.0902200; PMID: 20208005
- Feyerabend TB, Li JP, Lindahl U, Rodewald HR. Heparan sulfate C5-epimerase is essential for heparin biosynthesis in mast cells. Nat Chem Biol 2006; 2:195 - 6; http://dx.doi.org/10.1038/nchembio777; PMID: 16532012
- Ghiselli G, Farber SA. D-glucuronyl C5-epimerase acts in dorso-ventral axis formation in zebrafish. BMC Dev Biol 2005; 5:19; http://dx.doi.org/10.1186/1471-213X-5-19; PMID: 16156897
- Bülow HE, Hobert O. Differential sulfations and epimerization define heparan sulfate specificity in nervous system development. Neuron 2004; 41:723 - 36; http://dx.doi.org/10.1016/S0896-6273(04)00084-4; PMID: 15003172
- Li JP, Gong F, Hagner-McWhirter A, Forsberg E, Abrink M, Kisilevsky R, et al. Targeted disruption of a murine glucuronyl C5-epimerase gene results in heparan sulfate lacking L-iduronic acid and in neonatal lethality. J Biol Chem 2003; 278:28363 - 6; http://dx.doi.org/10.1074/jbc.C300219200; PMID: 12788935
- Iozzo RV, Zoeller JJ, Nyström A. Basement membrane proteoglycans: modulators Par Excellence of cancer growth and angiogenesis. Mol Cells 2009; 27:503 - 13; http://dx.doi.org/10.1007/s10059-009-0069-0; PMID: 19466598
- Eshchenko TY, Rykova VI, Chernakov AE, Sidorov SV, Grigorieva EV. Expression of different proteoglycans in human breast tumors. Biochemistry (Mosc) 2007; 72:1016 - 20; http://dx.doi.org/10.1134/S0006297907090143; PMID: 17922662
- Grigorieva E, Eshchenko T, Rykova VI, Chernakov A, Zabarovsky ER, Sidorov SV. Decreased expression of human D-glucuronyl C5-epimerase in breast cancer. Int J Cancer 2008; 122:1172 - 6; http://dx.doi.org/10.1002/ijc.23203; PMID: 17985344
- Grigorieva EV, Prudnikova TY, Domanitskaya NV, Mostovich LA, Pavlova TV, Kashuba VI, et al. D-glucuronyl C5-epimerase suppresses small-cell lung cancer cell proliferation in vitro and tumour growth in vivo. Br J Cancer 2011; 105:74 - 82; http://dx.doi.org/10.1038/bjc.2011.170; PMID: 21654676
- Prudnikova TY, Mostovich LA, Domanitskaya NV, Pavlova TV, Kashuba VI, Zabarovsky ER, et al. Antiproliferative effect of D-glucuronyl C5-epimerase in human breast cancer cells. Cancer Cell Int 2010; 10:27; http://dx.doi.org/10.1186/1475-2867-10-27; PMID: 20723247
- Mostovich LA, Prudnikova TY, Domanitskaya NV, Verzhbitskaya NE, Kharchenko OV, Nepomnyaschikh GI, et al. Molecular mechanisms of anti-tumor effect of D-glucuronyl C5-epimerase in lung cancer experimental model in vivo.. Siber J Oncol 2010; 2:24 - 9
- Ghiselli G, Agrawal A. The human D-glucuronyl C5-epimerase gene is transcriptionally activated through the beta-catenin-TCF4 pathway. Biochem J 2005; 390:493 - 9; http://dx.doi.org/10.1042/BJ20050152; PMID: 15853773
- Lopes CC, Toma L, Pinhal MA, Porcionatto MA, Sogayar MC, Dietrich CP, et al. EJ-ras oncogene transfection of endothelial cells upregulates the expression of syndecan-4 and downregulates heparan sulfate sulfotransferases and epimerase. Biochimie 2006; 88:1493 - 504; http://dx.doi.org/10.1016/j.biochi.2006.04.009; PMID: 16793191
- Small EM, Sutherland LB, Rajagopalan KN, Wang S, Olson EN. MicroRNA-218 regulates vascular patterning by modulation of Slit-Robo signaling. Circ Res 2010; 107:1336 - 44; http://dx.doi.org/10.1161/CIRCRESAHA.110.227926; PMID: 20947829
- Sandoval J, Esteller M. Cancer epigenomics: beyond genomics. Curr Opin Genet Dev 2012; 22:50 - 5; http://dx.doi.org/10.1016/j.gde.2012.02.008; PMID: 22402447
- Mazzio EA, Soliman KF. Basic concepts of epigenetics: impact of environmental signals on gene expression. Epigenetics 2012; 7:119 - 30; http://dx.doi.org/10.4161/epi.7.2.18764; PMID: 22395460
- Kulis M, Esteller M. DNA methylation and cancer. Adv Genet 2010; 70:27 - 56; http://dx.doi.org/10.1016/B978-0-12-380866-0.60002-2; PMID: 20920744
- Ropero S, Setien F, Espada J, Fraga MF, Herranz M, Asp J, et al. Epigenetic loss of the familial tumor-suppressor gene exostosin-1 (EXT1) disrupts heparan sulfate synthesis in cancer cells. Hum Mol Genet 2004; 13:2753 - 65; http://dx.doi.org/10.1093/hmg/ddh298; PMID: 15385438
- Bui C, Ouzzine M, Talhaoui I, Sharp S, Prydz K, Coughtrie MW, et al. Epigenetics: methylation-associated repression of heparan sulfate 3-O-sulfotransferase gene expression contributes to the invasive phenotype of H-EMC-SS chondrosarcoma cells. FASEB J 2010; 24:436 - 50; http://dx.doi.org/10.1096/fj.09-136291; PMID: 19812376
- Miyamoto K, Asada K, Fukutomi T, Okochi E, Yagi Y, Hasegawa T, et al. Methylation-associated silencing of heparan sulfate D-glucosaminyl 3-O-sulfotransferase-2 (3-OST-2) in human breast, colon, lung and pancreatic cancers. Oncogene 2003; 22:274 - 80; http://dx.doi.org/10.1038/sj.onc.1206146; PMID: 12527896
- Chen Z, Fan JQ, Li J, Li QS, Yan Z, Jia XK, et al. Promoter hypermethylation correlates with the Hsulf-1 silencing in human breast and gastric cancer. Int J Cancer 2009; 124:739 - 44; http://dx.doi.org/10.1002/ijc.23960; PMID: 19006069
- Xiang YY, Ladeda V, Filmus J. Glypican-3 expression is silenced in human breast cancer. Oncogene 2001; 20:7408 - 12; http://dx.doi.org/10.1038/sj.onc.1204925; PMID: 11704870
- Kizuka Y, Kitazume S, Yoshida M, Taniguchi N. Brain-specific expression of N-acetylglucosaminyltransferase IX (GnT-IX) is regulated by epigenetic histone modifications. J Biol Chem 2011; 286:31875 - 84; http://dx.doi.org/10.1074/jbc.M111.251173; PMID: 21771782
- Zhang C, Li H, Zhou G, Zhang Q, Zhang T, Li J, et al. Transcriptional silencing of the TMS1/ASC tumour suppressor gene by an epigenetic mechanism in hepatocellular carcinoma cells. J Pathol 2007; 212:134 - 42; http://dx.doi.org/10.1002/path.2173; PMID: 17471463
- Zhang C, Li H, Wang Y, Liu W, Zhang Q, Zhang T, et al. Epigenetic inactivation of the tumor suppressor gene RIZ1 in hepatocellular carcinoma involves both DNA methylation and histone modifications. J Hepatol 2010; 53:889 - 95; http://dx.doi.org/10.1016/j.jhep.2010.05.012; PMID: 20675009
- Kim SK, Jang HR, Kim JH, Kim M, Noh SM, Song KS, et al. CpG methylation in exon 1 of transcription factor 4 increases with age in normal gastric mucosa and is associated with gene silencing in intestinal-type gastric cancers. Carcinogenesis 2008; 29:1623 - 31; http://dx.doi.org/10.1093/carcin/bgn110; PMID: 18635522
- Foltz G, Yoon JG, Lee H, Ma L, Tian Q, Hood L, et al. Epigenetic regulation of wnt pathway antagonists in human glioblastoma multiforme. Genes Cancer 2010; 1:81 - 90; http://dx.doi.org/10.1177/1947601909356103; PMID: 21779426
- Heinz S, Glass CK. Roles of lineage-determining transcription factors in establishing open chromatin: lessons from high-throughput studies. Curr Top Microbiol Immunol 2012; 356:1 - 15; http://dx.doi.org/10.1007/82_2011_142; PMID: 21744305
- Ravindranath A, Yuen HF, Chan KK, Grills C, Fennell DA, Lappin TR, et al. Wnt-β-catenin-Tcf-4 signalling-modulated invasiveness is dependent on osteopontin expression in breast cancer. Br J Cancer 2011; 105:542 - 51; http://dx.doi.org/10.1038/bjc.2011.269; PMID: 21772333
- Wöhrle S, Wallmen B, Hecht A. Differential control of Wnt target genes involves epigenetic mechanisms and selective promoter occupancy by T-cell factors. Mol Cell Biol 2007; 27:8164 - 77; http://dx.doi.org/10.1128/MCB.00555-07; PMID: 17923689
- Kikuchi A, Yamamoto H, Sato A, Matsumoto S. New insights into the mechanism of Wnt signaling pathway activation. Int Rev Cell Mol Biol 2011; 291:21 - 71; http://dx.doi.org/10.1016/B978-0-12-386035-4.00002-1; PMID: 22017973
- Sakane H, Yamamoto H, Matsumoto S, Sato A, Kikuchi A. Localization of glypican-4 in different membrane microdomains is involved in the regulation of Wnt signaling. J Cell Sci 2012; 125:449 - 60; http://dx.doi.org/10.1242/jcs.091876; PMID: 22302992
- Cadwalader EL, Condic ML, Yost HJ. 2-O-sulfotransferase regulates Wnt signaling, cell adhesion and cell cycle during zebrafish epiboly. Development 2012; 139:1296 - 305; http://dx.doi.org/10.1242/dev.078238; PMID: 22357927
- Rodríguez-Paredes M, Esteller M. Cancer epigenetics reaches mainstream oncology. Nat Med 2011; 17:330 - 9; http://dx.doi.org/10.1038/nm.2305; PMID: 21386836
- Lustberg MB, Ramaswamy B. Epigenetic targeting in breast cancer: therapeutic impact and future direction. Drug News Perspect 2009; 22:369 - 81; http://dx.doi.org/10.1358/dnp.2009.22.7.1405072; PMID: 19890494
- Kristensen LS, Nielsen HM, Hansen LL. Epigenetics and cancer treatment. Eur J Pharmacol 2009; 625:131 - 42; http://dx.doi.org/10.1016/j.ejphar.2009.10.011; PMID: 19836388