Abstract
Rac1, a ubiquitously expressed member of the Rho GTPase family, plays a pivotal role in the regulation of multiple cellular processes including cytoskeleton reorganization, cell growth, differentiation and motility. Here we show that the tumor-specific splice variant of Rac1, Rac1b, negatively regulates Rac1 activity. The expression of Rac1b in HeLa cells interferes with Rac1 activation by PDGF, leads to a reduction in membrane-bound Rac1 and promotes an increase in Rho activity. The antagonistic relationship between Rac1 and Rac1b perturbs the regulatory circuitry that controls actin cytoskeleton dynamics thereby leading to tumor-linked alterations in cell morphology and motility.
Acknowledgements
We would like to thank Dr. Chen Zhao for help with initial experiments. We are grateful to the members of the Bar-Sagi laboratory for comments and discussions. This work was supported by National Institutes of Health Grants CA055360 (D.B.S.) and CA123592A (A.S.N.).
Figures and Tables
Figure 1 Rac1b inhibits Rac1 activation. (A) HeLa cells were transfected with vector or HA-tagged Rac1b, serum-starved and then stimulated with PDGF (30 ng/ml) for the indicated intervals. GTP-bound Rac1 was isolated by the PBD pull-down assay and detected by immunoblotting (IB) with anti-Rac1 antibody. Total Rac1 and expression of Rac1b in whole cell lysates (WCL) were detected by IB with anti-Rac1 antibody. To calculate fold change, the levels of activated Rac1 were quantified by densitometry scanning and normalized to the levels of total Rac1. The results are representative of three independent experiments. Quantification of active Rac1 immunoblots of the 0 and 10 minute timepoints from three independent experiments are also shown (bottom). Results are the mean ± SD and are presented as the levels of active Rac1 relative to the respective time 0. (B and C) HeLa cells were transfected with pSuper constructs expressing scrambled shRNA (shControl) or shRNA targeting Rac1b (shRac1b). Cells were selected with blasticidin for 3 days, transfected with HA-tagged Rac1b wobble (Rac1b wobble) and serum-starved. (B) GTP-bound Rac1 was isolated by the PBD pull-down assay and immunoblotting (IB) and quantification (bottom) were done as in (A). Results are the mean ± SD and are presented as the levels of active Rac1 relative to the shControl at time 0. (C) Rac1b knockdown was determined by semi-quantitative PCR. RPLP1 was used as a control.
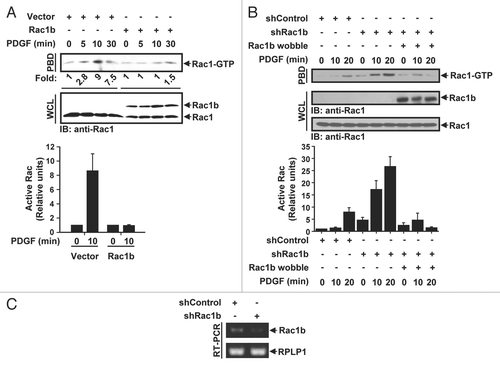
Figure 2 Rac1b inhibits Rac1 membrane recruitment. (A) HeLa cells transfected with vector or HA-tagged Rac1bV12 were serum-starved and PDGF-stimulated, then subjected to subcellular fractionation. Membrane-bound Rac1 and Rac1b were detected by immunoblotting (IB) with anti-Rac1 and anti-HA antibodies, respectively. Flotillin is a plasma membrane marker. Total Rac1 in whole cell lysates (WCL) was detected by IB with anti-Rac1 antibody. The levels of membrane-bound Rac1 were quantified by densitometry scanning and normalized to the levels of total Rac1. Quantification of membrane-associated Rac1 immunblots from three independent experiments are also shown (right). Results are the mean ± SD and are presented as the fold increase in membrane bound Rac1 relative to unstimulated vector. (B) Serum starved HeLa cells were co-microinjected with EGFP-Rac1 and vector (-Rac1bV12) or Rac1bV12. After 3 hours, cells were stimulated with PDGF (30 ng/mL) for 10 min, fixed and analyzed by fluorescence microscopy. Images shown represent a single 0.25 µm optical section. Plasma membrane localization is reflected by the relative increase in fluorescence intensity at the cell periphery. The entire cell periphery was observed and cells were scored as positive if at least 50% of the membrane periphery contained Rac1. The number of cells displaying plasma membrane localization of Rac1 is expressed as the percentage of the total number of cells expressing GFP-Rac1. Results are the mean ± SD of three independent experiments with at least 25 cells scored for each condition in each experiment. Scale bar represents 20 µm. (C) HeLa cells were transfected with pSuper constructs expressing scrambled shRNA (shControl) or shRNA targeting Rac1b (shRac1b). Cells were selected with blasticidin for 3 days and membranes were isolated by subcellular partitioning. Immunoblotting and quantification (right) were done as in (A). To detect Rac1 and Rac1b in WCL, 3% and 15%, respectively, of each sample was taken prior to subcellular partitioning and loaded on an SDS gel. Results are the mean ± SD of three independent experiments and are presented as the fold increase in membrane bound Rac1 relative to unstimulated shControl.
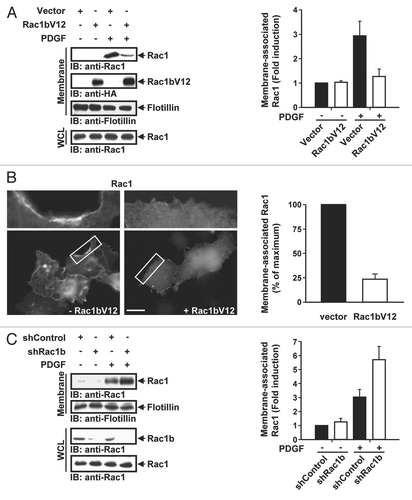
Figure 3 Rac1b modulates Rac1-mediated Rho activity. (A) HeLa Tet-off cells (HTO-Rac1V12),Citation19 were transfected with vector or Rac1bV12, as indicated, in the presence of tetracycline (Tet). Twenty-four hours after transfection, Tet was removed. After 24 hr, GTP-bound Rho was isolated by the RBD pull-down assay and detected by immunoblotting (IB) with anti-RhoA antibody. Total RhoA in whole cell lysates (WCL) was detected by IB with anti-RhoA antibody. Expression of Rac1V12 and Rac1bV12 was detected with anti-Rac1 antibody. The levels of activated Rho were quantified by densitometry scanning and normalized to the levels of total Rho. Quantification of active Rho immunoblots from three independent experiments are also shown (right). Results are the mean ± SD and are presented as the levels of active Rho relative to vector control. (B) HeLa cells were transfected with pSuper constructs expressing scrambled shRNA (shControl) or shRNA targeting Rac1b (shRac1b). Cells were selected with blasticidin for 3 days and GTP-bound Rho was isolated by the RBD pull-down assay. Immunoblotting (IB) and quantification (bottom) were done as in (A). Results are the mean ± SD and are presented as the levels of active Rho relative to shControl.
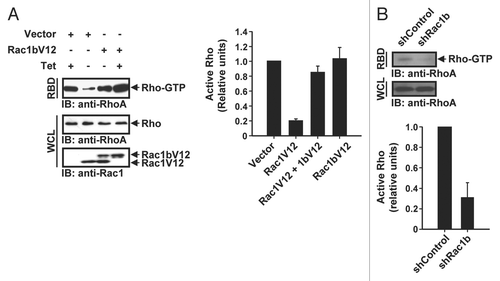
Figure 4 Rac1b modulates the dynamics of the actin cytoskeleton. (A–D) HeLa cells were transfected with EGFP vector (A) or 0.5 µg or 2 µg EGFP-tagged Rac1bV12 (B and C, respectively) or 2 µg Rac1V12 (D) and stained for F-actin using rhodamine-phalloidin. Representative images are shown. The boxed areas are enlarged at the right-hand-side of the corresponding image. Scale bar represents 20 µm. (E) HeLa cells were co-transfected with EGFP and either vector, Rac1bV12 (0.5 µg), RhoAN19 (0.5 µg) or Rac1bV12 + RhoAN19. The graph shows the number of cells with actin-rich protrusions as a percent of GFP-positive cells. Results are the mean ± SD of three independent experiments with at least 500 cells counted per condition. (F) HeLa cells were transfected with EGFP + vector or + Rac1bV12 (2 µg) with or without Y-27632 (10 µM) treatment. The graph shows the number of cells with blebbing morphology as a percent of GFP-positive cells. Results are the mean ± SD of three independent experiments with at least 500 cells counted per condition.
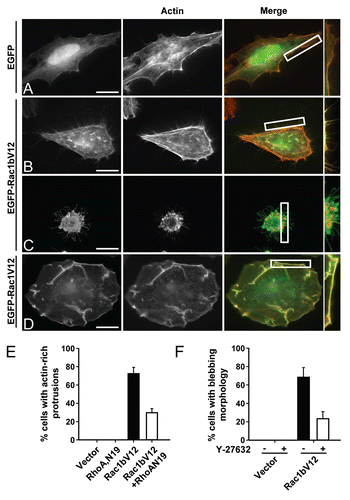
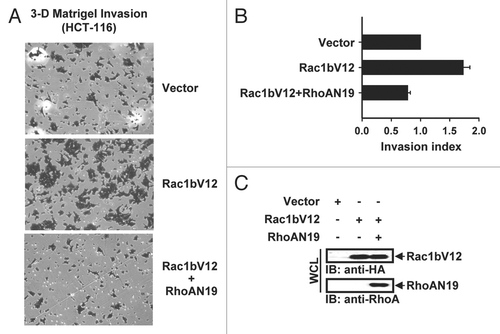
Figure 5 Rac1b promotes Rho-induced invasion of HCT-116 cells. HCT-116 cells transfected with vector, Rac1bV12 or Rac1bV12 + RhoAN19 were applied to the upper chamber of a matrigel-coated transwell with DMEM containing 10% FBS in the lower chamber. Cells migrating through the filter were stained with crystal violet. The stain was subsequently eluted and measured by spectrophotometry at OD 595. (A) Representative images (10x) of the lower surface of the transwell filter are shown. (B) Invasion index represents the light absorbance value relative to the control. Quantification of invaded cells from two independent experiments is shown. Results are the mean ± SD and are presented as the extent of invasion as measured by eluted crystal violet relative to vector. (C) Expression of Rac1bV12 and RhoAN19 were detected by immunoblotting (IB) with anti-HA and anti-RhoA antibodies, respectively, in whole cell lysates (WCL).