Abstract
An important part of the innate immune response of the nematode C. elegans to fungal infection is the rapid induction of antimicrobial peptide gene expression. One of these genes, nlp‑29, is expressed at a low level in adults under normal conditions. Its expression is up-regulated in the epidermis by infection with Drechmeria coniospora, but also by physical injury and by osmotic stress. For infection and wounding, the induction is dependent on a p38 MAP kinase cascade, but for osmotic stress, this pathway is not required. To characterize further the pathways that control the expression of nlp‑29, we carried out a genetic screen for negative regulatory genes. We isolated a number of Peni (peptide expression no infection) mutants and cloned one. It corresponds to fasn‑1, the nematode ortholog of vertebrate fatty acid synthase. We show here that a pathway involving fatty acid synthesis and the evolutionary conserved wnk‑1 and gck‑3/Ste20/GCK‑VI kinases modulates nlp‑29 expression in the C. elegans epidermis, independently of p38 MAPK signaling. The control of the antimicrobial peptide gene nlp‑29 thus links different physiological processes, including fatty acid metabolism, osmoregulation, maintenance of epidermal integrity and the innate immune response to infection.
Acknowledgements
We thank J. Belougne and Y. Duverger for worm sorting using the facilities of the Marseille-Nice Genopole®, M. Fallet for help with confocal microscopy, A. Millet for her participation in the screen and A. Chisholm for discussion. Some nematode strains used in this work were provided by the Caenorhabditis Genetics Center, which is funded by the NIH National Center for Research Resources (NCRR) or by the National Bioresource Project coordinated by S. Mitani. This work was funded by institutional grants from INSERM and the CNRS and a grant from the FRM. The Ewbank group is an Equipe Labellisé of the FRM.
Figures and Tables
Figure 1 Characterization of Peni mutants. Uninfected transgenic worms carrying a pnlp-29::GFP reporter do not express high levels of GFP in the wild-type background (A) while in homozygous fr8 worms there is a strong constitutive expression (B). The transgenic worms also carry a pcol-12::dsRed reporter gene, which is expressed from the L2 stage onwards. Green and red fluorescence are visualized simultaneously. (C) The acute osmotic stress resistance (>15 minutes on NGM agar plates containing 500 mM NaCl) of wild type N2 worms is compared to osm-11(n1604), fr8 and fr10 mutants (left to right). Upper and lower panel shows low and high magnification of the worms. (D) Quantification of fluorescence in the wild-type (yellow) and fr8 (blue) mutant background of a mixed stage population with the COPAS Biosort. Each dot represents an individual worm (n = 2536 and 3349 for WT and fr8, respectively). Red and green fluorescence are shown on an arbitrary logarithmic scale. (E) Survival of fr8 versus WT control worms (both containing the integrated frIs7 reporter transgene) after infection with D. coniospora at 25°C. Data are representative of three independent experiments [n > 100; p < 0.0001, log-rank (Mantel-Cox) test].
![Figure 1 Characterization of Peni mutants. Uninfected transgenic worms carrying a pnlp-29::GFP reporter do not express high levels of GFP in the wild-type background (A) while in homozygous fr8 worms there is a strong constitutive expression (B). The transgenic worms also carry a pcol-12::dsRed reporter gene, which is expressed from the L2 stage onwards. Green and red fluorescence are visualized simultaneously. (C) The acute osmotic stress resistance (>15 minutes on NGM agar plates containing 500 mM NaCl) of wild type N2 worms is compared to osm-11(n1604), fr8 and fr10 mutants (left to right). Upper and lower panel shows low and high magnification of the worms. (D) Quantification of fluorescence in the wild-type (yellow) and fr8 (blue) mutant background of a mixed stage population with the COPAS Biosort. Each dot represents an individual worm (n = 2536 and 3349 for WT and fr8, respectively). Red and green fluorescence are shown on an arbitrary logarithmic scale. (E) Survival of fr8 versus WT control worms (both containing the integrated frIs7 reporter transgene) after infection with D. coniospora at 25°C. Data are representative of three independent experiments [n > 100; p < 0.0001, log-rank (Mantel-Cox) test].](/cms/asset/26cf7ead-0f55-4da5-8644-021de74293db/kvir_a_10910974_f0001.gif)
Figure 2 fr8 is a mutation in the fatty acid synthase gene fasn-1. (A) Structure of the fasn-1 genomic locus. The location of the fr8 mutation is indicated with an arrow. Exons are shown as boxes, introns are represented as lines, the grey region shows the 3′UTR of fasn-1. Several constructs are shown below the gene structure, from top to bottom, respectively: the promoter region used for the GFP reporter construct (pfasn-1::GFP), the overlapping rescuing fragments, the rescuing fragments under the control of the tissue specific promoters of col-12, mtl-2 and rab-3. The length of these promoters is not to scale. (B–D) Confocal fluorescence images of pfasn-1::GFP transgenic worms illustrating expression in multiple neurons in the head and tail region and socket cells (B and D), intestine, spermatheca and epidermis (B) and seam cells (C). (E–G) Expression of fasn-1 in the epidermis is sufficient to rescue the Peni phenotype. Micrographs of fasn-1(fr8) worms carrying the frIs7 transgene with a second transgene driving expression of fasn-1 under the control of the epidermal col-12 promoter (E), of the intestinal mtl-2 promoter (F) and of neuronal rab-3 promoter (G).
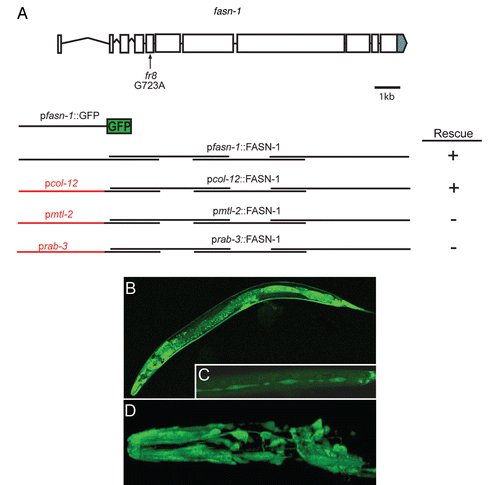
Figure 3 fasn-1 mutants carrying a rescuing extrachromosomal array have an altered FA composition. (A) Gas chromatograms showing the FA composition in wild type worms, as well as rescued fasn-1(fr8);frEx288 worms and their fasn-1(fr8) mutant siblings. Arrows point to the peaks corresponding to C16:0 and C18:0. The FA compositions in wild-type and fasn-1 mutants are comparable suggesting that a decrease in FASN-1 activity does not preferentially affect a specific type of FA. Expression, and presumably overexpresion, of fasn-1 from an extrachromosomal array resulted in an imbalance of FA composition, towards saturated C16 and C18. (B) The graph shows the average levels (with standard deviation) of individual FA species normalized to total FA from analysis of three biological replicates. The difference for C16:0 and C18:0 levels are significant (p = 0.05 and <0.05, respectively, paired Student's t test).
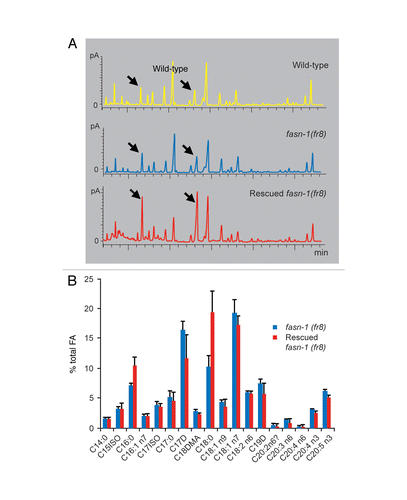
Figure 4 Regulation of pnlp-29::GFP by fasn-1 is independent of the PKC-p38 MAPK pathway. RNAi of tpa-1 (C) and tir-1 (D) in fasn-1(fr8) background does not reduce the constitutive expression of pnlp-29::GFP seen in control worms raised on bacteria containing an empty RNAi vector (A), unlike GFP RNAi (B).
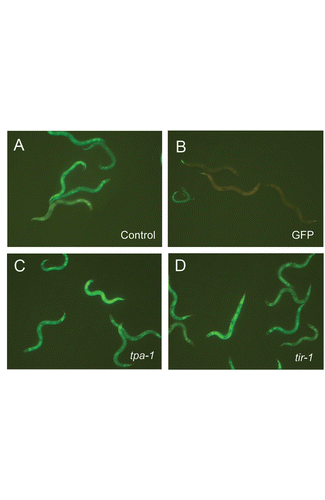
Figure 5 Extra copies of fasn-1 block the osmotic shock-induced expression of pnlp-29::GFP. (A–D) Compared to untreated controls (A), wt;frIs7;frEx288 worms exhibit a high level of pnlp-29::GFP expression after injury (B) or treatment with PMA (C), but not after osmotic stress (D).
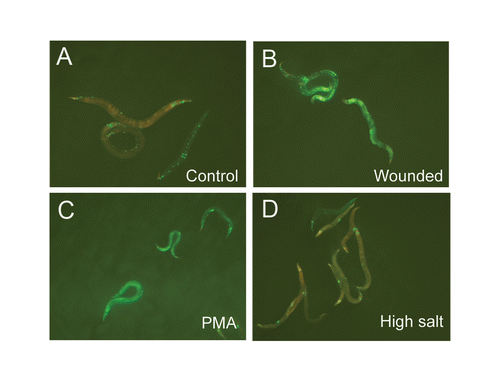
Figure 6 Abrogation of gck-3 or wnk-1 block the elevated level of pnlp-29::GFP expression seen in fasn-1(fr8). Treatment of fasn-1(fr8);frIs7 animals with RNAi for gck-3 (C) and wnk-1 (D) lead to the downregulation of pnlp-29::GFP expression similar to that seen upon worms treated with GFP RNAi (B), compared to an empty RNAi vector control (A). (E) Quantification of the effect of gck-3 and wnk-1 RNAi on pnlp-29::GFP expression in fasn-1(fr8);frIs7 animals with the COPAS Biosort. The normalized average ratio of green fluorescence to time of flight (TOF) is shown. The analysis was restricted to worms with a TOF between 200 and 400. In each sample, data is from, from left to right, 100, 60, 87 and 67 worms. For reasons given elsewhere,Citation9 in this and the subsequent graphs, error bars are not shown. Data are representative of three independent experiments. (F) Treatment of wt;frIs7 animals with RNAi for gck-3 and wnk-1 also lead to the downregulation of pnlp-29::GFP expression after 6 h of hyperosmotic stress, compared to the empty vector control. The number of worms used in each sample was, from left to right, 142, 122, 360 and 309 worms. Data are representative of two independent experiments.
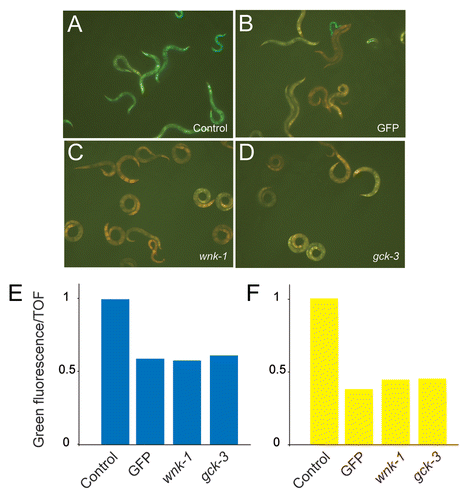
Figure 7 wnk-1 and gck-3 act up-stream or in parallel to the MAP2K sek-1. Overexpression of sek-1 provokes constitutively high pnlp-29::GFP expression, which is reduced by pmk-1(RNAi) but not by wnk-1 nor gck-3 RNAi. The normalized average ratio of green fluorescence to TOF is shown. The analysis was restricted to worms with a TOF between 200 and 400. The number of worms used in each sample was, from left to right, 1381, 754, 371 and 367 worms. Data are representative of two independent experiments.
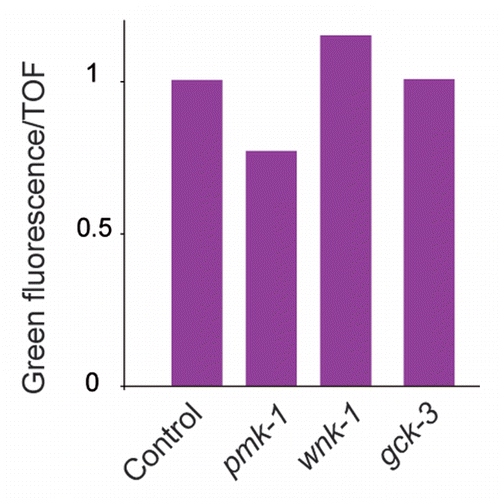
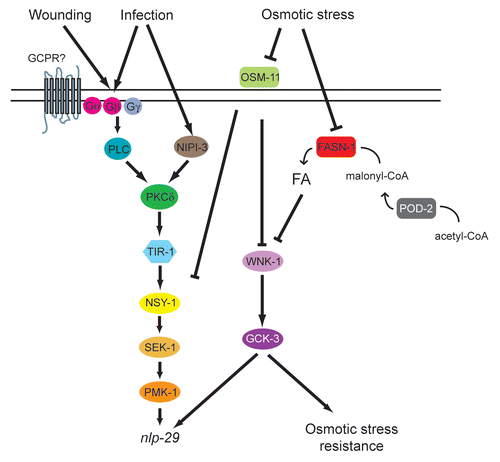
Figure 8 Model of the control of nlp-29 expression. Signals perceived upon D. coniospora infection and injury are transduced by a PKC-p38 MAPK pathway to regulate the expression of nlp-29. OSM-11 acts as a negative regulator of this pathway, intervening at the level of pmk-1, or above. It also acts in a WNK-1- and GCK-3-dependent parallel pathway to negatively regulate nlp-29 expression. The OSM-11/WNK-1/GCK-3 pathway additionally controls the organismal resistance to osmotic stress, and via a separate as yet undefined pathway, the expression of gpdh-1, and thereby glycerol levels (not shown here for the sake of simplicity). Both POD-2 and FASN-1 influence fatty acid (FA) levels, and negatively regulate nlp-29 expression, in a WNK-1- and GCK-3-dependent manner. The exact manner in which FA levels alter nlp-29 expression has yet to be determined. They may act indirectly by affecting the structure of the cuticle or epidermal cell membrane integrity.