New traceability strategies based on a biological Bar Code by PCR-DGGE using bacterial and yeast communities for determining farming type of peach
Ahmed El ShobakyBotany Department, Faculty of Science, Mansoura University, 60 El Gohoureya Street, El Mansoura, El Dakahylea35516, Egypt;Cirad, UMR 95 Qualisud, TA B-95/16, 73, rue Jean-François Breton, Montpellier cedex 5 34398, FranceCorrespondence[email protected]
,
Jean-Christophe MeileCirad, UMR 95 Qualisud, TA B-95/16, 73, rue Jean-François Breton, Montpellier cedex 5 34398, France
&
Didier MontetCirad, UMR 95 Qualisud, TA B-95/16, 73, rue Jean-François Breton, Montpellier cedex 5 34398, France
Pages 327-333
|
Received 05 Apr 2015, Accepted 17 Jun 2015, Published online: 13 Mar 2019
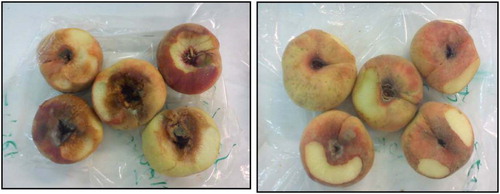
Fig. 1 Mature peach fruits were collected in Jordan from two farming types (on the left side: control fruit from organic farming and on the right side: treated fruits from conventional farming, both were collected in Jordan).
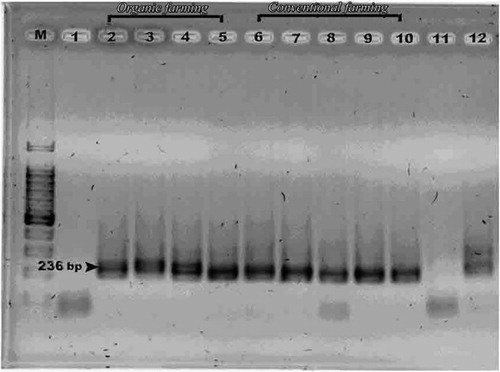
Fig. 2 Amplicons of bacterial communities after PCR using Gc 338f and 518r primers (236 bp). Lanes 2–5 are c2, c3, c4, c5 for organic farming while lanes 6–10 are f1–5 for conventional farming. Lane 12: +ve control Escherichia coli Lane 11: –ve control.
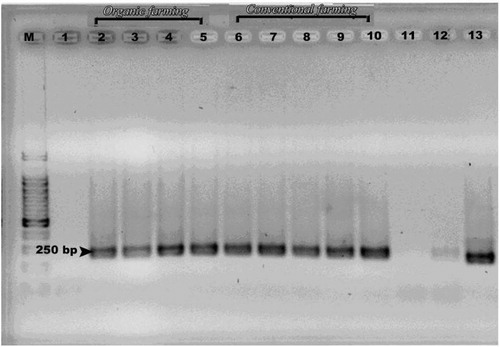
Fig. 3 Amplicons of yeast communities after PCR using NL1 GC and LS2 primers (250 bp). Lanes 2–5 are c2, c3, c4, c5 for organic farming type while lanes 6–10 are f1–5 for conventional farming. Lane 13: +ve control Candida apicola Lane 11: –ve control.
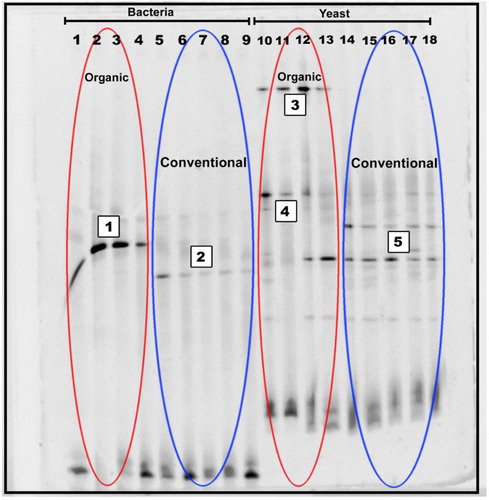
Fig. 4 PCR-DGGE profiles of 16S and 26S rDNA of peach fruits collected in Jordan from two different farming types (organic and conventional) from Jordan Lanes 1–4 are c2, c3, c4, c5 for organic farming type while lanes 5–9 are f1–5 for Conventional farming = bacteria. Lanes 10–13 are c2, c3, c4, c5 for organic farming type while lanes 14–18 are f1–5 for Conventional farming = yeast.
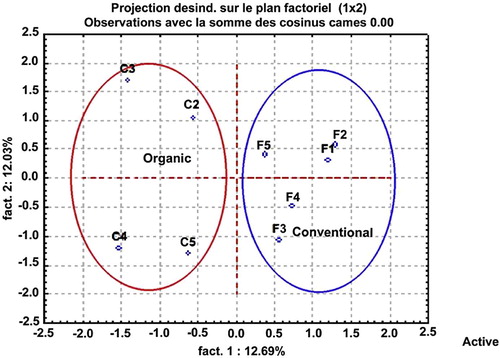
Fig. 5 Factorial variance analysis of 26S rDNA profiles of peach fruits from two different farming types, organic and conventional.
Table 1 Sequencing results of the bands cut from the DGGE gel.