Figures & data
Table 1 Treatments at the two experimental sites including the soil amendments used for basal dressing, top-dressing materials, N-dose(s) applied at anthesis and NDICEA-calculated plant available nitrogen (PAN) values for each treatment.
Table 2 Effect of experimental treatments on grain yield and straw dry matter accumulation during the 2006 and 2007 growing season for the three different soil amendment systems. Means in the same column, followed by a different lower cast letter are statistically different (p < 0.05).
Table 3 Summary statistics (mean, median, minimum and maximum) of the FHB infected seeds (% of all seeds) measured in a blotter test, and the DON contents in the years 2006 and 2007.
Table 4 Results of the ANOVA on the percentage of FHB infected seeds. No statistically significant interactions were found, but between years and between the top-dressing treatments differences were statistically significant as indicated by different lower cast letters following the means (p < 0.05).
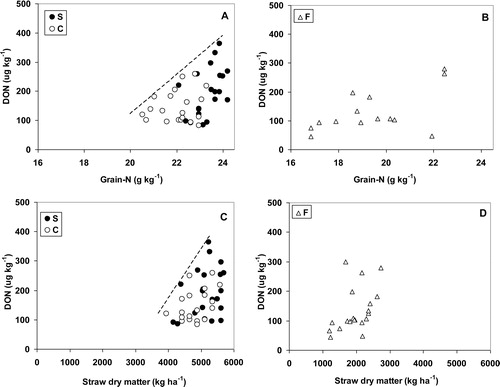
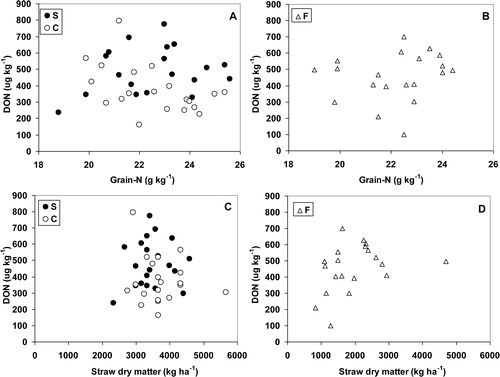
Table 5 Results of the ANOVA on log10DON contents. There was a statistically significant interaction between top-dressing treatment and year, and there were statistically significant differences between years and between basal fertilizer dressings. The other interactions were not statistically significant. Means within the main factors, followed by a different lower cast letter are statistically different (p < 0.05).