
Figures & data
Figure 1 Study flowchart using eight rRT-PCRs to detect human astroviruses in stool and cerebrospinal (CSF) samples sent for viral screening in the laboratory of virology, University Hospitals of Geneva, 2015–2016.
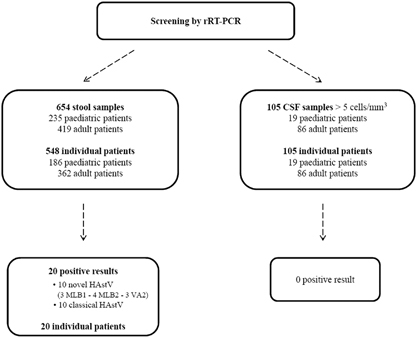
Figure 2 Positive human astroviruses in stool samples. Top: Pie chart showing the prevalence and composition of classical and novel astroviruses among HAstV-positive patients. Bottom: histogram of the temporal distribution of cases. human astrovirus, HAstV.
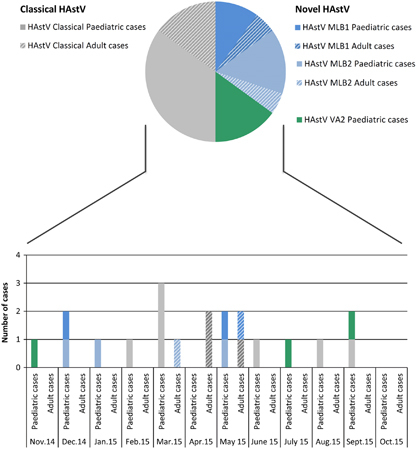
Table 2 HAstV-positive stool samples: overall and stratified (classical and novel) HAstV patient characteristics
Figure 3 Classical and novel human astrovirus viral load in stool samples. The horizontal lines denote median log values. ***P<0.001. human astrovirus, HAstV.
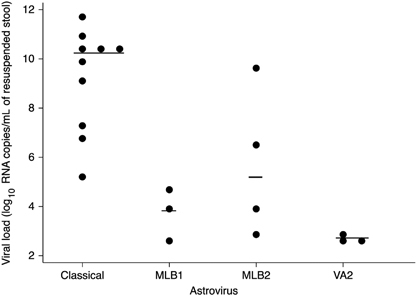
Table 1 Clinical cases of classical and novel HAstV detection in stool samples