
Figures & data
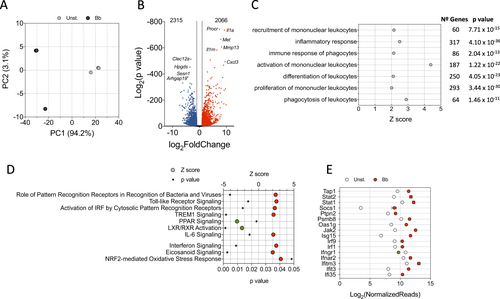
a PCA of BMMs stimulated with B. burgdorferi (black circles) or left unstimulated (gray circles). b Volcano plot showing genes upregulated (red dots) or downregulated (blue dots) upon stimulation of BMMs with B. burgdorferi. Ten of the most regulated genes are identified. c Biological processes that are significantly regulated by the stimulation of BMMs with B. burgdorferi. The Z scores identify those processes that are differentially regulated (Z > 2). The number of genes corresponding to each process and the p-value obtained by IPA is also shown. dZ scores corresponding to genes regulated by B. burgdorferi in BMMs in response to specific PRRs and upstream regulators. Z scores >2 or <−2 were considered significant. e Genes that are differentially regulated by B. burgdorferi in BMMs (red circles = upregulated; green circle = downregulated) corresponding to the interferon signaling pathway according to IPA
Selected upstream upregulators showing a significant overlap with the stimulation of BMM with B. burgdorferia
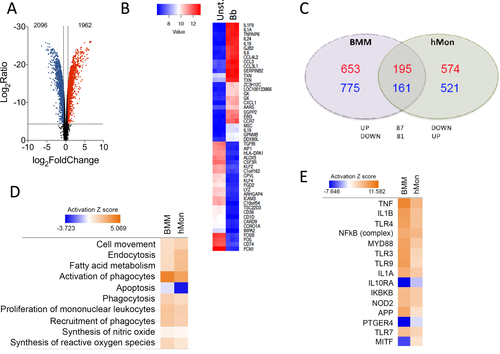
a Volcano plot representing genes that are differentially regulated by stimulation with the spirochete. The red dots represent upregulated genes, whereas the blue dots correspond to those that are differentially downregulated. b Heat map showing the 50 most regulated genes in response to B. burgdorferi stimulation of human monocytes (Bb) compared with unstimulated monocytes (Unst.). c Venn diagram showing the overlap in gene regulation between BMMs and human monocytes stimulated with B. burgdorferi. The number of upregulated genes is represented in red. Downregulated genes are marked in blue. d Comparison of biological processes regulated in BMMs and hMon stimulated with B. burgdorferi. Processes that showed activation are indicated in orange, whereas those that were downregulated are presented in blue. The intensity of the colors is determined by the calculated Z value for each process. e Upstream activator pathways regulated by B. burgdorferi in BMMs and hMon. The colors and intensities are presented according to calculated Z values as in d
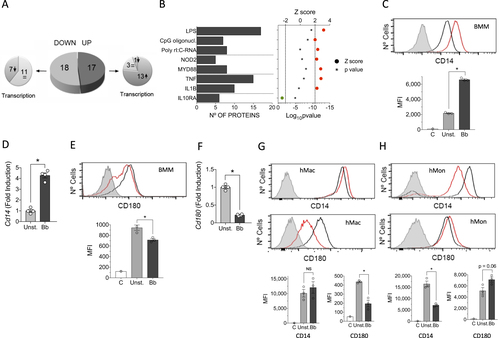
a Pie chart showing the upregulated (dark gray) or downregulated proteins (light gray) in response to stimulation with the spirochete. The smaller pie charts on each side represent the direction of the regulation corresponding to the genes encoding the differentially expressed proteins. b Upstream regulators with significant Z scores (>2, red circles or <−2, green circle) and the number of regulated proteins. c Flow cytometry analysis of CD14 expression in BMMs stimulated with B. burgdorferi (red histogram) compared with unstimulated cells (black histogram). The gray histogram represents the unstained control. The average of the mean fluorescence intensity (MFI) ± SE for three independent mice is represented below. The experiment is representative of three performed. d Upregulation of Cd14 expression levels determined by qRT-PCR of RNA extracted from B. burgdorferi-stimulated BMMs (black bar) or unstimulated controls (gray bar). The results represent the average ± SE of four independent mice and are representative of three experiments performed. e Flow cytometry analysis of CD180 expression in BMMs stimulated with B. burgdorferi (red histogram) compared with unstimulated cells (black histogram). The gray histogram represents the unstained control. The average of the MFI ± SE for three independent mice is shown below and is representative of three experiments. f Downregulation of Cd180 expression levels by qRT-PCR in BMMs stimulated with B. burgdorferi (black bar) or unstimulated controls (gray bar). The results are the mean ± SE of 4 independent mice. g Expression of CD14 (top histograms) and CD180 (bottom histograms) in human monocyte-derived macrophages stimulated with B. burgdorferi (red histograms) and unstimulated controls (black histograms). The gray histogram represents the unstained controls. The average of the mean fluorescence intensity (MFI) ± SE for three independent determinations is represented below. The results are representative of those obtained with six independent samples. h Expression of CD14 (top histograms) and CD180 (bottom histograms) in hMon stimulated with B. burgdorferi (red histograms) and unstimulated controls (black histograms. The gray histogram represents the unstained controls. The average of the mean fluorescence intensity (MFI) ± SE for three independent determinations is represented below. The results are representative of those obtained with nine independent samples
Proteins significantly regulated by B. burgdorferi stimulation of BMMs and their corresponding gene transcription profiles
Proteins significantly regulated by B. burgdorferi stimulation of BMMs that are located in the plasma membrane
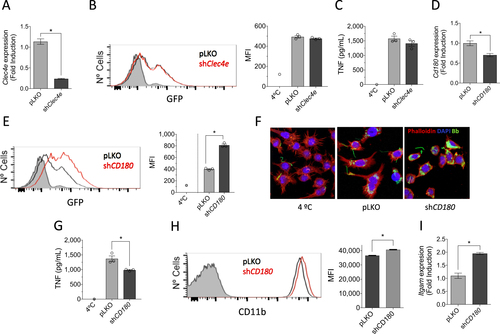
a Downregulation of Clec4e expression in RAW264.7 cells infected with a lentivirus containing specific shRNA (black bar) or an empty vector (pLKO, gray), as determined by qRT-PCR. The results represent the average of three determinations. b Phagocytosis of B. burgdorferi by RAW264.7 cells containing shRNA specific for Clec4a (red histogram) or an empty control (pLKO, black histogram). The gray histogram represents cells incubated at 4 °C (control). The average MFI of three determinations is presented on the right. The results are representative of at least three independent experiments. c TNF production upon stimulation with B. burgdorferi by RAW264.7 cells with silenced Clec4a or controls. d Silencing of CD180 in RAW264.7 cells (black bar) or pLKO controls (gray bar), as determined by qRT-PCR. The values correspond to the average ± SE of three determinations and are representative of three experiments. e. Phagocytosis of B. burgdorferi by shCd180 RAW264.7 cells (red histogram) or pLKO-infected controls (black histogram). The gray histogram represents the 4 °C control. The average of three determinations is presented on the right. The results are representative of at least three independent experiments. f Confocal micrograph of RAW264.7 cells containing shRNA specific for Cd180 (shCD180) or an empty vector (pLKO). The cells were stained with phalloidin (red) and DAPI. B. burgdorferi are shown in green. g TNF production upon stimulation with B. burgdorferi by RAW264.7 cells containing a shRNA specific for Cd180 or a vector control (pLKO). The average ± SE of three determinations is presented and represent at least three independent experiments. h Flow cytometry showing the expression of CD11b in unstimulated RAW264.7 cells containing a shRNA specific for Cd180 (red histogram) or an empty vector (pLKO, black histogram). The gray histogram represents the unstained control. The average of the mean fluorescence intensity (MFI) ± SE for three determinations is represented on the right. i qRT-PCR showing the expression of the Itgam gene in unstimulated RAW264.7 cells containing an shRNA specific for Cd180 (black bar) or the empty vector (pLKO, gray bar). The results represent the average ± SE of three determinations