
Figures & data
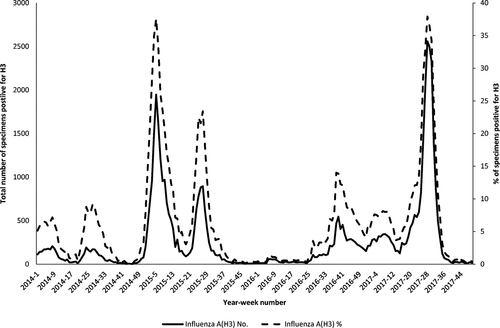
The data were obtained from the Public Health Laboratory Services of Hong KongCitation39
Major amino acid substitutions of A(H3N2) viruses from Hong Kong. Amino acid sequence data were downloaded from Global Initiative on Sharing All Influenza Data (GISAID) EpiFlu database (Supplementary Table 1)
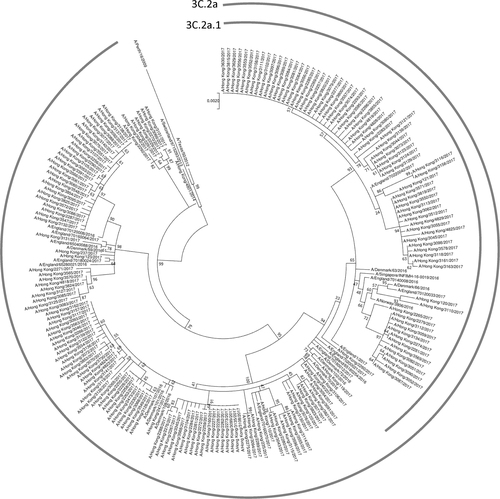
The phylogenetic tree was constructed using the Maximum Likelihood method based on the Hasegawa–Kishino–Yano model. All sequences were obtained from the Global Initiative on Sharing All Influenza Data (GISAID) Database (Supplementary Table S1)
Microneutralization and hemagglutination inhibition titer against the 2017 H3N2 circulating strain (3391/2017) and the 2016/17 influenza vaccine A(H3N2) strain (4801/2014)
Comparison of microneutralization and hemagglutination inhibition titers between 3391/2017 and 4801/2014
Microneutralization and hemagglutination inhibition titers stratified by age group