Figures & data
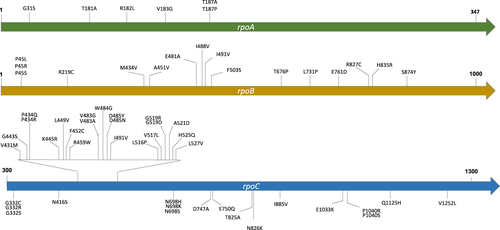
Each putative compensatory mutation was supported by at least two independent evolution events
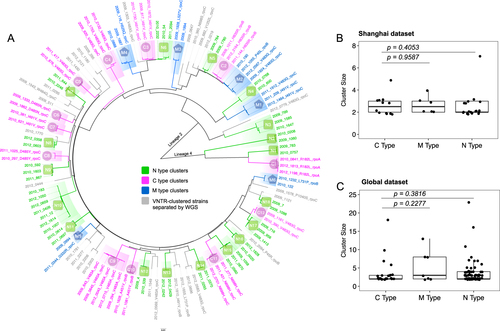
a A maximum likelihood phylogenetic tree showing genomic clusters in the Shanghai dataset. The strain identifiers were “year, strain number, and compensatory mutation type”. The three genomic cluster types are illustrated with different colors, as indicated. The isolate names in gray represent the VNTR-clustered strains that were separated by WGS. Comparison of cluster sizes in C-type, M-type, and N-type clusters in the Shanghai MDR-TB dataset (b) and the Global MDR-TB dataset (c); each dot represents a genomic cluster identified by WGS
Ratios of compensated strains in clustered and nonclustered MDR-TB groups
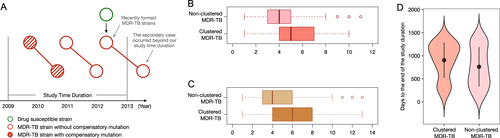
a A theoretical scheme shows that recently formed MDR-TB strains would be included, while the secondary clustered strains resulting from transmission would occur outside of the study’s observation period. Thus, newly formed MDR-TB strains would be assigned to the nonclustered group. This schematic diagram also shows that transmission that occurred within the first 2 years will be captured in our study, while the secondary cases resulting from transmission that occurred during the last 2 years could be beyond the study’s observation period. b Comparison of the number of drugs to which strains are resistant in clustered and nonclustered MDR-TB strains. c Comparison of the number of drug-resistance mutations in clustered and nonclustered MDR-TB strains. d Comparison of collection time distribution between clustered and nonclustered MDR-TB groups; the collection time of each isolate was counted as “days to the end of the study duration (31 December 2012)”