Figures & data
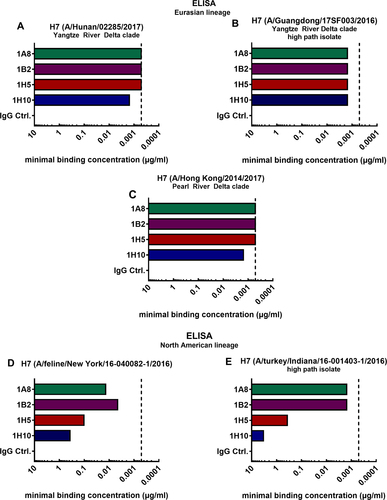
Minimal binding concentrations of mAbs 1A8, 1B2, 1H5, 1H10 and negative IgG control binding to recombinant H7 HAs of Eurasian lineage virus isolates A/Hunan/02285/2017 (a), A/Hong Kong/2014/2017 (b), and A/Guangdong/17SF003/2016 (c). Minimal binding concentrations of mAbs binding to the H7 HAs of North American lineage HAs of virus isolates A/feline/New York/16-040082/2016 (d) and A/turkey/Indiana/16-001403-1/2016 (e). The vertical dashed line represents the minimal binding concentration of all four mAbs to H7 HA of A/Anhui/1/2013, which is antigenically similar to the strain they were raised to
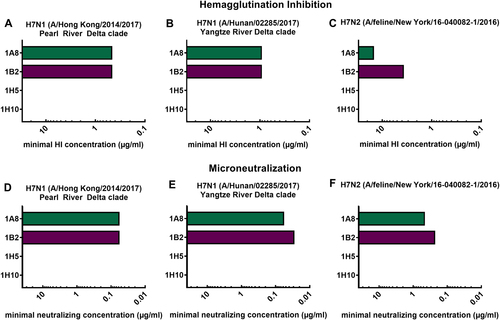
Minimal hemagglutination inhibition concentrations of mAbs 1A8, 1B2, 1H5, and 1H10 in µg/mL against reassortant viruses. a A/Hong Kong/2014/2017 H7N1, (b) A/Hunan/02285/2017 H7N1, and (c) A/feline/New York/16-040082/2016 H7N2. Minimal neutralizing concentrations of mAbs 1A8, 1B2, 1H5, and 1H10 against the same viruses (d–f)
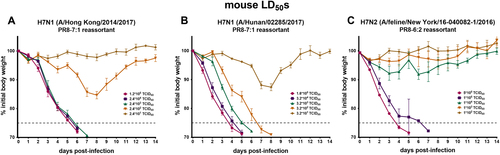
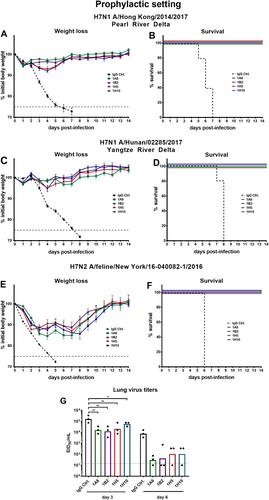
Weight loss curve of 6–8-week-old female BALB/c mice (n = 3 per group) infected with different doses of (a) H7N1 (A/Hong Kong/2014/2017), (b) H7N1 (A/Hunan/02285/2017), and (c) H7N2 (A/feline/New York/16-040082/2016). The error bar indicate the standard error of the mean. The weight loss and survival were monitored for 14 days. The dashed gray line represents 75% initial body weight, which was defined as the humane endpoint
a, c, e show weight loss curves of animals pretreated (n = 5 per group) with monoclonal antibodies at a concentration of 1 mg/kg and challenged with H7N1 A/Hong Kong/2014/2017, H7N1 A/Hunan/02285/2017, or H7N2 A/feline/New York/16-040082/2016 reassortant viruses 2 h post mAb transfer. The error bars represent the standard error of the mean. The dashed black line represents treatment with a negative control IgG and the dashed gray line represents 75% weight loss. b, d, f Survival graphs showing percent survival in the different groups used in the prophylactic mouse challenge model. g The lung viral titers on days 3 and 6 post infection are shown as EID50/mL for IgG control and mAbs 1A8, 1B2, 1H5, and 1H10 (n = 3 per group). The dotted line represents the limit of detection (10 × EID50/mL). Lung virus titers of the IgG control were compared for the same day (3 or 6) in a one-way ANOVA with a Sidak post test for multiple comparison. Significance is indicated as follows: P > 0.05; *P ≤ 0.05; **P ≤ 0.01
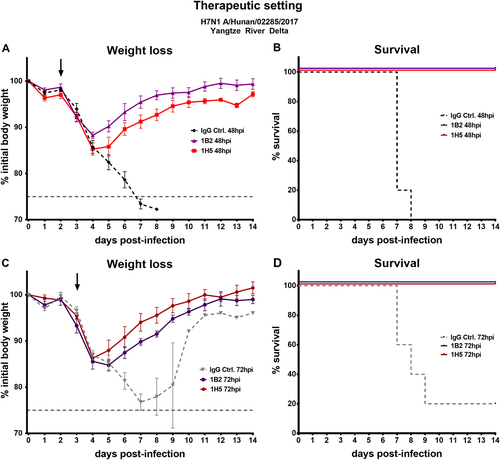
a, c Weight loss curves of animals receiving antibody 1A8, 1B2, 1H5, or 1H10 at a concentration of 5 mg/kg 48 or 72 h post infection. The dashed lines represent negative control groups. The dashed vertical gray line represents 75% weight loss. The black arrows indicate when mAbs were given. c, d Percent survival of mice receiving therapeutic mAb treatment in different groups
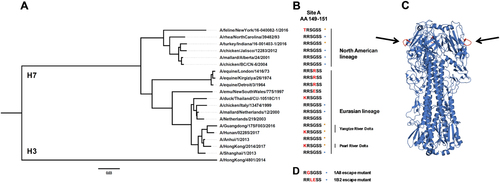
a Phylogenetic tree based on the amino acid sequence of H7 HAs. The amino acid sequence of H3 (A/Hong Kong/4801/2014) was used as an outgroup. The scale bar at the bottom shows a 3% difference in amino acid identity. b Amino acids of H7 HA at position 149 to 151 (antigenic site A; H3 numbering) are shown. Red letters represent differences to A/Anhui/1/2013 (and A/Shanghai/1/2013). Orange stars represent H7 HAs used in this study and blue circles H7 HAs tested in the previous reportCitation27. The different lineages (North American vs. Eurasian) and clades (Pearl River Delta vs. Yangtze River Delta) are indicated. c Graphic representation of the crystal structure of the A/Anhui/1/2013 H7 HA trimer. Black arrows are pointing at the antigenic site A shown in red. The structure is based on PDB # 4R8WCitation48. d Mutations of antigenic site A that resulted in loss of binding of mAbs 1A8 and 1B2 as determined by escape mutagenesis (as previously reported)