Figures & data
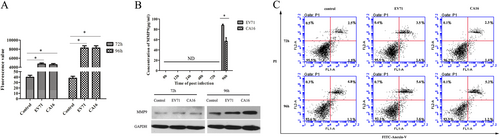
a Permeability of monolayer HUVECs was detected by a paracellular FITC-dextran flux assay. Significant differences among these groups are indicated by *P < 0.05. b Detection of the expression of MMP9 induced by CA16 infection using ELISA and WB. c CA16 infections does not induced HUVECs apoptosis, including early apoptotic and late apoptotic
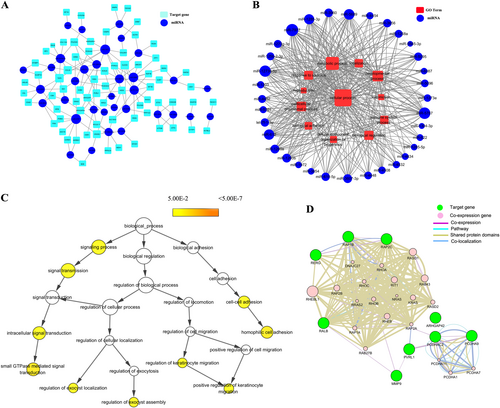
All miRNAs are depicted as a blue colored node among the networks. The larger the area of the nodes, the bigger the number of connections between a miRNA and other nodes in the network.a Predicted network between the same expressed miRNAs and their putative target genes. Putative targets are presented wathet blue rounded rectangles. The width of the line represents the free energy between the miRNAs and their putative target genes. b Predicted network between the same expressed miRNAs and their putative target gene-associated GOs. Red rectangle nodes denote GOs. Edges show the inhibitory effects of miRNAs on GOs. c In total, 71 genes were used to generate the GO tree. Edges represent “parent–child” relationships of GO terms. The sizes of the yellow rounded rectangles are proportional to the number of GO terms annotated to each node. d Co-expression network were constructed by the top ten significantly putative targets. Green nodes are target genes and pink nodes are co-expression genes. Genes with bigger size are more centralized in the network and have a stronger capacity of modulating adjacent genes. Different color lines mean the different interactions between these genes
a Verification of the expression of miR-1303 by qRT-PCR compared to miRNA sequencing. b Detection of the expression of MMP9 induced by CA16 infection using qRT-PCR. c Dual-luciferase reporter analysis verified the targetting relationship between miR-1303 and MMP9. d qRT-PCR and WB analysis of MMP9 expression in miR-1303 transfected cells. Error bars represent the mean ± SEM, and the data are averages from three biological replicates, *P < 0.05
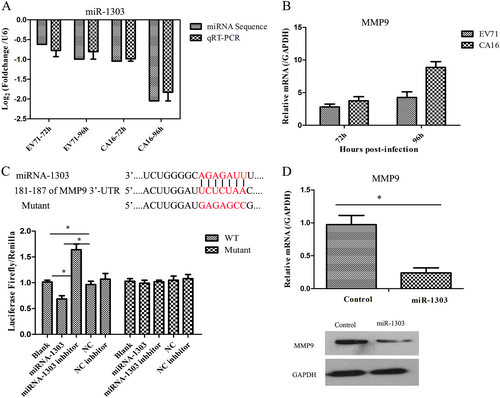
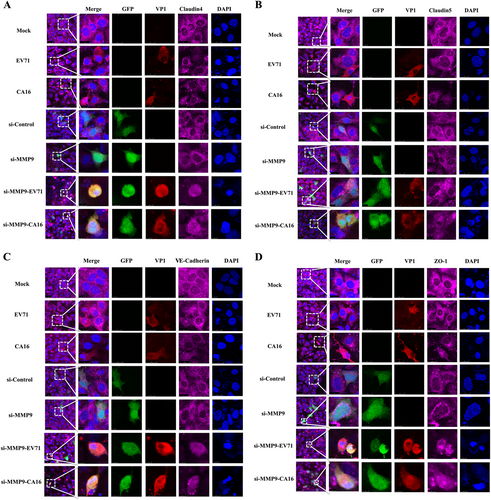
Fig. 4 Confocal imaging showed that the junctional protein including a Claudin4, b Claudin5, c VE-Cadherin, and d ZO-1 were degraded by CA16 infection and knockout MMP9 rescued these degradation. The si-control and si-MMP9 plasmids contain a GFP tag (green color). EV71/CA16-VP1, junctional proteins and the cell nucleus are indicated by red, purple and mazarine, respectively
a Protein expression of junctional proteins in HUVECs with different treatments normalized against GAPDH. b Densitometry of WBs of three independent experiments performed with lysates at 72 and 96 hpi. The signal intensity was normalized to GAPDH levels from the same blots. The results are expressed as the mean ± SEM for three subjects, *P < 0.05
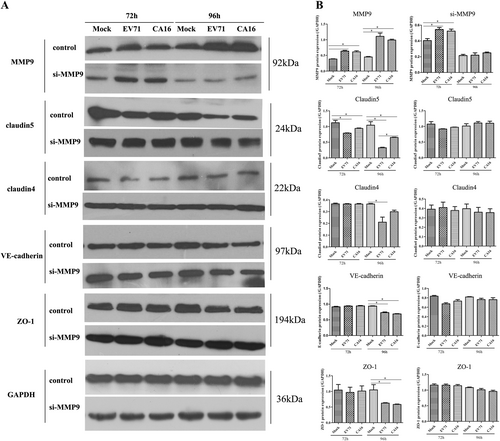
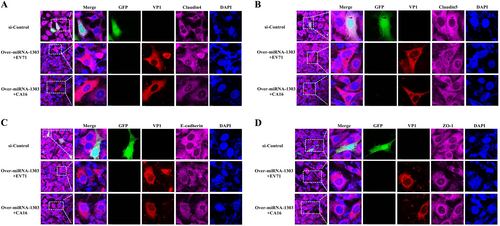
Fig. 6 Overexpression of miR-1303 inhibites the degradation of junctional protein including a Claudin4, b Claudin5, c VE-Cadherin, and d ZO-1. EV71/CA16-VP1, junctional proteins and the cell nucleus are indicated by red, purple and mazarine, respectively
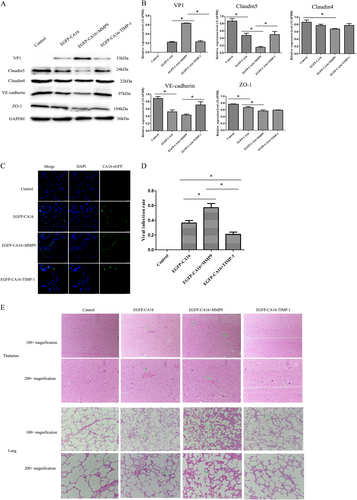
a Junctional protein expression in thalamus of different treated rhesus monkeys. b Statistical analysis of the quantitative value of intensity about the blots. The ratios indicated the intensity of the bands compare to the GAPDH. c The efficacy of CA16 infections in thalamus of different treated rhesus monkeys. CA16-VP1 and the cell nucleus are indicated by green and mazarine, respectively. d Statistical analysis of viral infection rates. The ratios indicated the infected cells compared to the total cells from ten different visual fields. e Histopathological changes in the thalamus and lungs of different treated rhesus monkeys. The green arrow points to a place where pathological changes are obvious
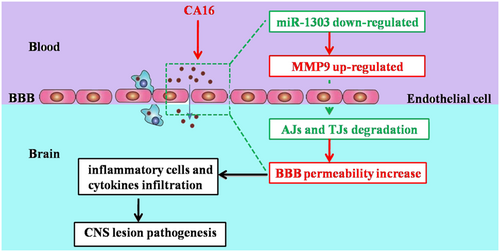
CA16 penetrates the BBB and enter the CNS by downregulating miR-1303, which induced the disruption of junctional complexes by directly regulating MMP9 and ultimately caused the pathological CNS changes