Figures & data
Table 1. Surface tension data for the test liquids used for the contact angle measurements.
Figure 1. Mean for all subjects for changes over time from baseline for the contact angles obtained for each test liquid. Note that the time-line is not linear. p<.05 and p<.01 are denoted as * and **, respectively.
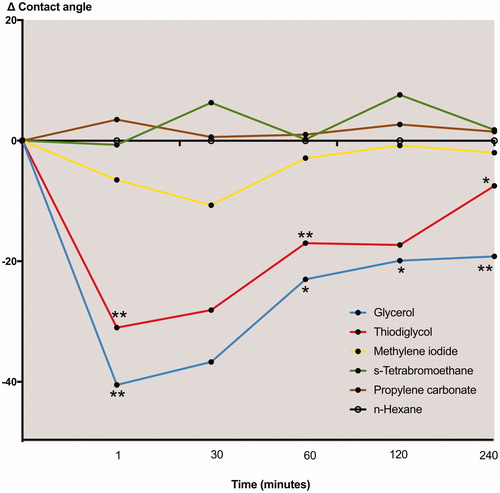
Table 2. Mean, standard deviation (SD) and range for changes over time from baseline for the contact angles obtained for the test liquids applied.
Figure 2. Whole-body autoradiograms of male Sprague-Dawley rats painted with solutions of 14C-delmopinol in the mouth and killed after (A) 1 h, (B) 4 h and (C) 24 h.
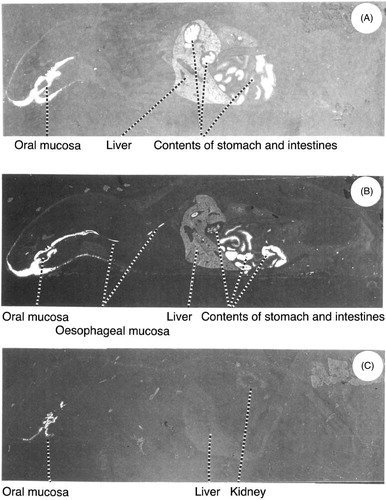
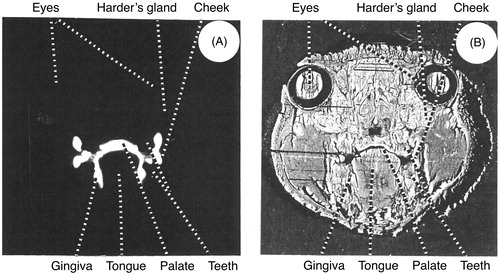
Figure 3. (A) Autoradiogram of a transversal section through the head of a Sprague-Dawley rat killed 1 h after painting of the mouth with a solution of 14C-delmopinol. (B) The corresponding tissue-section.