Figures & data
Figure 1. The GLR and Wilks’s p-value. The gray region shows the possible values of p0 under the ET embedding model given in (Equation3(3)
(3) ), and the solid line the values of Wilks’s p-value, based on the asymptotic distribution of − 2log G01(X) under the null distribution.
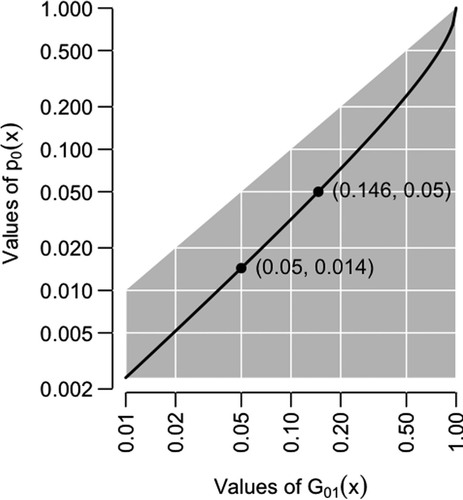
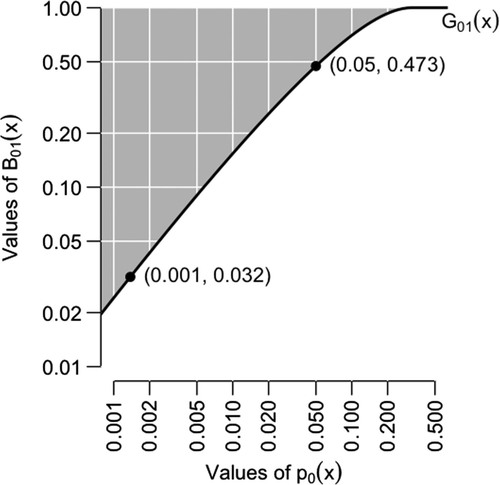
Figure 2. The Generalized Likelihood Ratio G01 and possible Bayes factors B01 (gray region), as functions of the p-value p0, for the null distribution X ∼ N(0, 1) and the test statistic t(x) = x, which is a UMP one-tailed test for location.
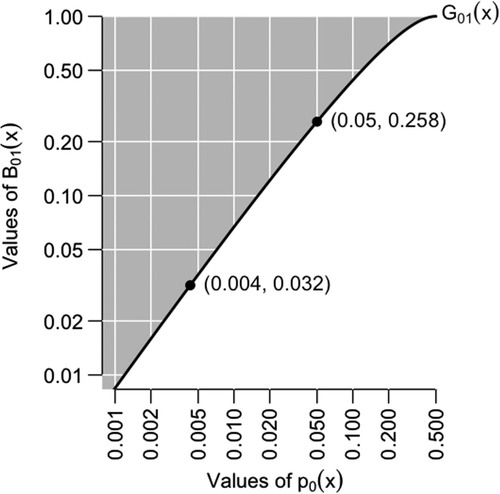
Figure 3. Similar to , except based on the “two-tailed” test statistic t(x) = x2, which is a UMP one-tailed test for dispersion.