Figures & data
Table 1 Bayes factor for all possible results in a clinical trial with two arms of size n = 8 each. Cells in boldface make up the region and the observed Bayes factor is shown in boldface italics. See text.
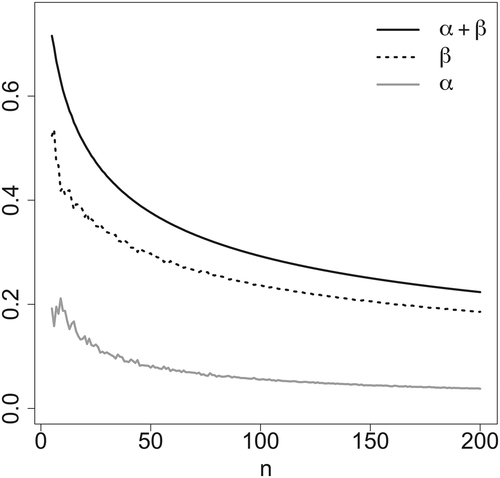
Fig. 1 Optimal averaged type-I (solid gray line), type-II (dotted line), and total (solid black line) error probabilities as functions of the number of patients n in each arm of a two-arm medical study.
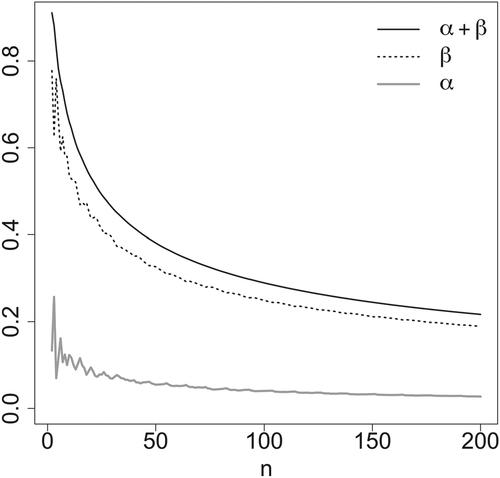
Table 2 Optimal averaged error probabilities and
for comparison of two proportions for various arm sizes n1 and n2 in a two-arm medical study. Calculations were performed with a = b.
Fig. 2 Type-I (solid gray lines), type-II (dashed black lines), and total (dot-dashed black lines) error probabilities as functions of sample size n for tests of on a normally distributed variable with variance 1 and unknown mean
with priors for the mean
with m = 0 (left) and m = 10 (right).
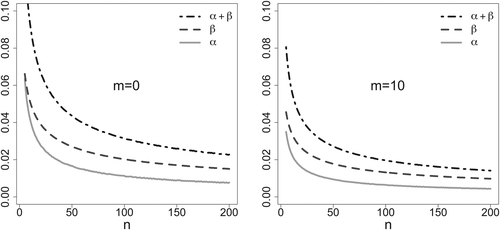
Fig. 3 Bayes factor for vs. Cauchy, arising from a test of a normal variance with hypotheses
vs.
.
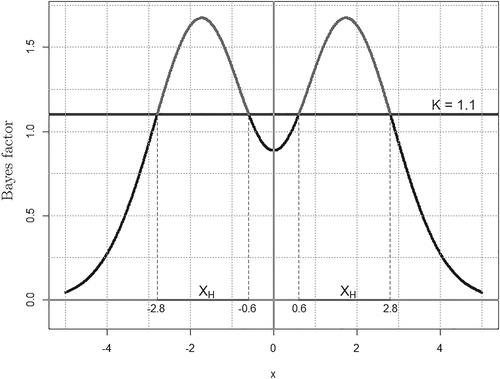
Fig. 4 Type-I (solid gray line), type-II (dotted line), and total (solid black line) error probabilities as functions of the sample size n for the Hardy–Weinberg equilibrium hypothesis.