Figures & data
Fig. 1 Maximum integrated likelihood ratio for one-sided t-test yielding p = 0.05.
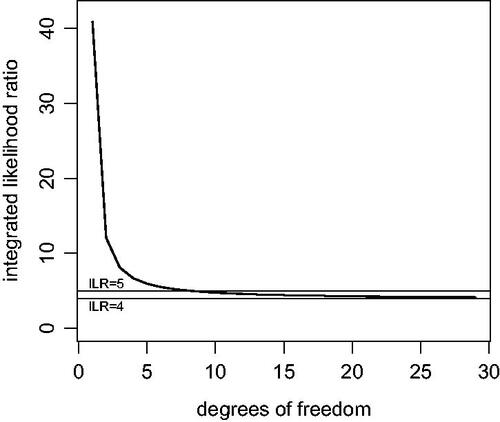
Fig. 2 ILRs for one-sided tests. The black curve represents the integrated likelihood ratio for one-sided t-tests yielding p = 0.05 under the alternative hypothesis specified in (10). The red curve represents the “average” ILR for a one-sided t-test yielding p = 0.05. The red curve was obtained by replacing the marginal density of the t statistic under the alternative hypothesis by its expectation. The blue curve represents the ILR obtained under the alternative hypothesis corresponding to and
in (1).
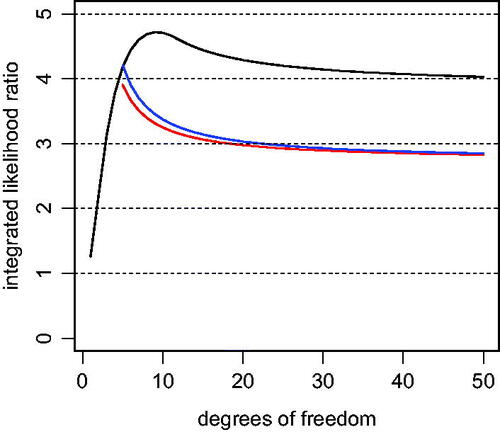
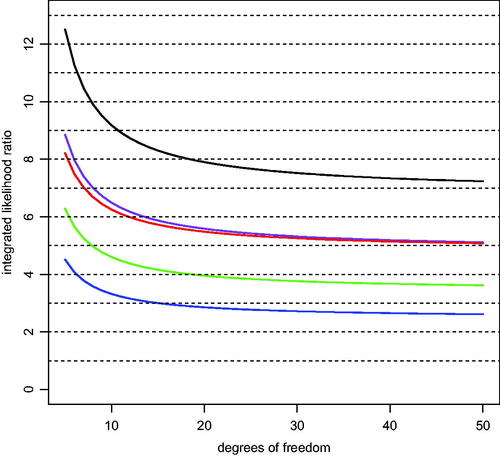
Fig. 3 ILRs for two-sided tests. The black curve depicts the maximum ILR for a two-sided t-test yielding p = 0.05. The alternative hypothesis underlying this curve assumes that , the value of the sample mean that produces a two-sided p-value of 0.05. The green curve represents the ILR for a two-sided t-test yielding p = 0.05 obtained by setting
, each with probability one-half, and g = 0. The blue curve was obtained similarly, except that
to account for variation in the sample mean. The purple curve was obtained by taking
and
in (1). The red curve represents the “average” ILR for two-sided t-tests yielding p = 0.05. The marginal likelihood for this curve was obtained by replacing the marginal density of the data under the alternative hypothesis with its expected value at the true value of μ.