Figures & data
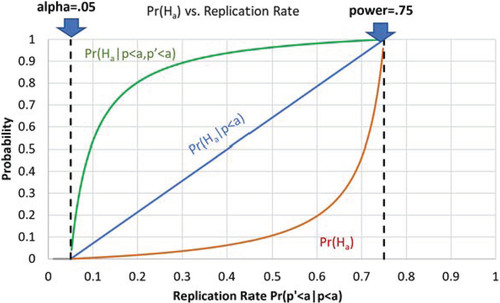
Fig. 1 Probability that the research proposition is true for different levels of replication in the field and number of significant results in independent studies. ,
, and
are shown in the bottom red curve, the middle blue line, and the top green curve, respectively.