
Figures & data
Table 1 Variable names and their description.
Table 2 Cetirizine exposure and birth defects.
Fig. 1 Estimates of the odds of a birth defect when no cetirizine (control) was taken during pregnancy and when cetirizine was taken. Horizontal dashed lines and shaded regions show point estimates and standard errors. The solid line labeled “Cetirizine worst case” shows the upper bound of the one-sided CI as a function of the confidence coefficient (x-axis). The right axis shows the estimated increase in odds of a birth defect for the cetirizine group compared to the control group.
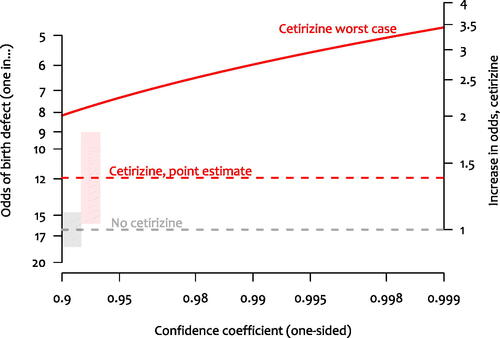
Fig. 2 Frequency representations of the number of birth defects expected under various scenarios. Top: Expected frequency of birth defects when cetirizine was not taken (control). Bottom-left: Point estimate of the expected frequency of birth defects when cetirizine is taken. Bottom-middle (bottom-right): Upper bound of a one-sided 95% (99%) CI for the expected frequency of birth defects when cetirizine was taken. Because the analysis is intended to be comparative, in the bottom panels the no-cetirizine estimate was assumed to be the truth when calculating the increase in frequency.
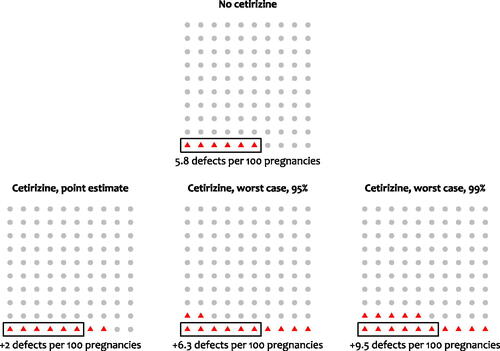
Fig. 3 Gronau, van Doorn, and Wagenmakers’ Bayesian analysis of the cetirizine dataset. The left panel shows the results of estimating the log odds ratio under with a two-sided standard normal prior. For ease of interpretation, results are displayed in the odds ratio scale. The right panel shows the results of testing the one-sided alternative hypothesis
versus the null hypothesis
. Figures inspired by JASP (jasp-stats.org).
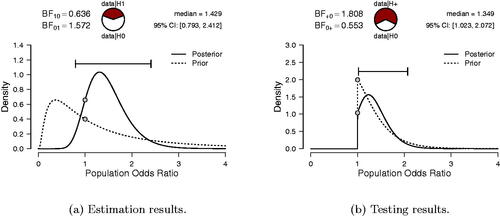
Fig. 4 Sensitivity analysis for the Bayesian one-sided test. The Bayes factor is a function of the prior standard deviation σ. Figure inspired by JASP.
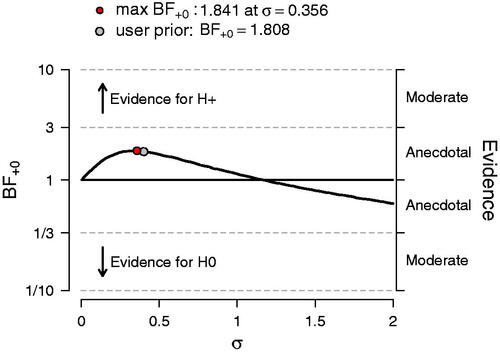
Fig. 5 Scatterplot of amygdalar activity and perceived stress in 13 patients with PTSD. Data extracted from in Tawakol et al. (Citation2017), with help of Jurgen Rusch, Philips Research Eindhoven.
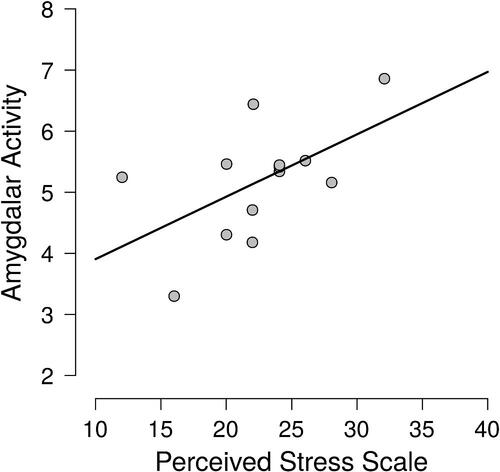
Table 3 Variable names and their description.
Table 4 Raw data as extracted from in Tawakol et al. (Citation2017), with help of Jurgen Rusch, Philips Research Eindhoven.
Fig. 6 Confidence intervals and one-sided tests for the Pearson correlation as a function of the confidence coefficient. The vertical lines represent the confidence intervals (confidence coefficient on lower axis), and the curve represents the value that is just rejected by the one-sided test (α on the upper axis).
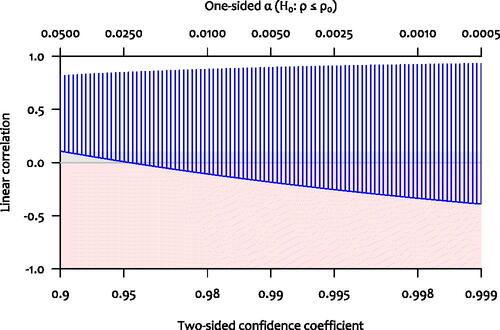
Fig. 7 van Doorn, Gronau, and Wagenmakers’ Bayesian analysis of the amygdala dataset. The left panel shows the result of estimating the Pearson correlation coefficient ρ under with a two-sided uniform prior. The right panel shows the result of testing
versus the one-sided alternative hypothesis
. Figures from JASP.
![Fig. 7 van Doorn, Gronau, and Wagenmakers’ Bayesian analysis of the amygdala dataset. The left panel shows the result of estimating the Pearson correlation coefficient ρ under H1 with a two-sided uniform prior. The right panel shows the result of testing H0:ρ=0 versus the one-sided alternative hypothesis H+:ρ∼U[0,1]. Figures from JASP.](/cms/asset/7926f85f-1610-4eed-a4d0-c527484e30fd/utas_a_1565553_f0007_c.jpg)
Fig. 8 Sensitivity analysis for the Bayesian one-sided correlation test. The Bayes factor is a function of the prior width parameter
from the stretched Beta(a,a) distribution. Figure from JASP.
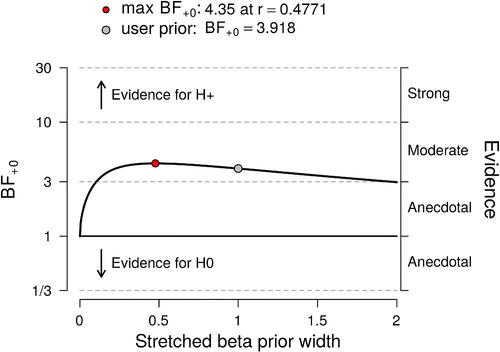
Table 5 Overview of the approaches and results of the research teams.