
Figures & data
Fig. 1 Distributions of treatment responses for placebo and an FDA approved and marketed competitor treatment based on systematic literature review and Bayesian network meta-analysis. For placebo (Pbo), the response rate is 30% with 95% credible interval (20%, 39%); for the competitor treatment (Trt) the response rate is 39% with 95% credible interval (7%, 82%). These are the starting points for developing the priors to be used for the Phase 3 trials of placebo versus the experimental treatment.
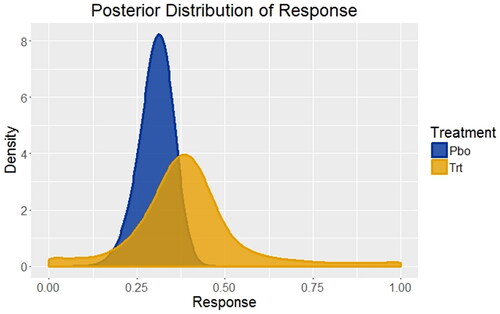
Table 1 Results from two randomized, controlled, double-blind trials of two dose levels (every 4-week dosing—Q4W—and every 2-week dosing—Q2W) of an experimental treatment versus placebo. N = sample size; Responders were defined prospectively based on improvement in a variety of clinical symptoms. P-values were derived from logistic regression, taking prespecified covariates into account.
Fig. 2a Posterior distributions of treatment effect for every 2-week dosing (Q2W) versus placebo (PBO) and every 4-week dosing (Q4W) versus placebo for Study 1.
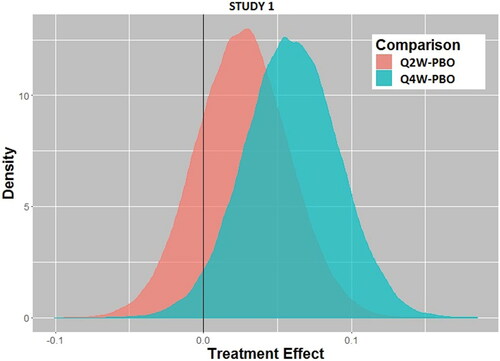
Fig. 2b Posterior distributions of treatment effect for every 2-week dosing (Q2W) versus placebo (PBO) and every 4-week dosing (Q4W) versus placebo for Study 2.
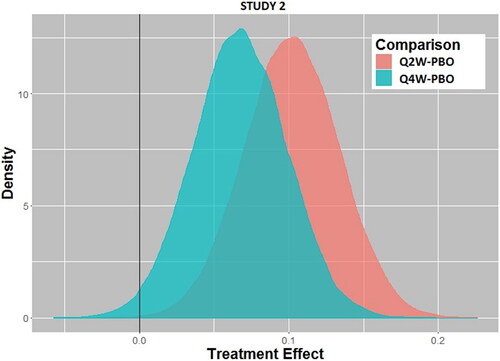
Table 2 Posterior probabilities of a positive treatment effect calculated from the posterior distributions of effect size for Study 1 and Study 2 using the prespecified borrowing factor (ε = 0.4) and sensitivity analysis using smaller borrowing factors (ε = 0.1, 0.2, 0.3).
Fig. 3 Posterior distributions of treatment effect for every 2-week dosing (Q2W) and every 4-week dosing (Q4W) for Study 2 using the posterior distribution of treatment effect from Study 1 as the prior distribution for Study 2 with borrowing factor ε = 0.9.
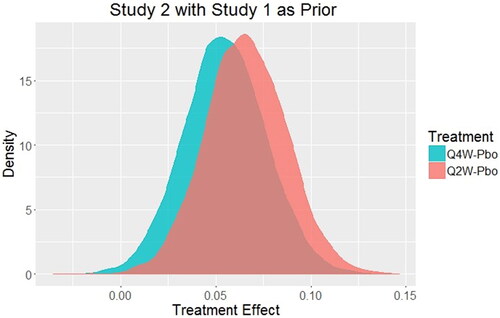
Table 3 The probability of exceeding a treatment effect (E) for each dose group based on the posterior probability distribution for the combined Phase 3 trials.