
Figures & data
Table 1. Triple quadrupole ICP-MS operating conditions.
Figure 1. Schematic of the method for the determination of potassium ethyl xanthate (KEX). EX− is ethyl xanthate anion and (EX)2 is diethyl dixanthogen.
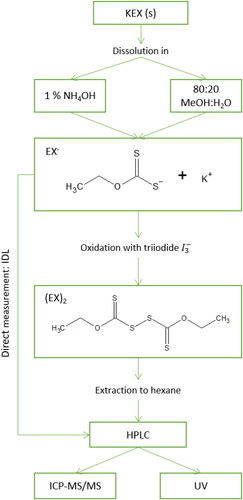
Figure 2. Typical chromatograms and absorption spectra for ethyl xanthate (EX−) in NH4OH, diethyl dixanthogen (EX)2 in hexane, and KEX sample after pretreatment in hexane. The initial KEX and (EX)2 concentrations were 10 mg L−1. The chromatograms employed ultraviolet-detection at 301 nm for EX− and at 240 nm for (EX)2 and the pretreated sample.
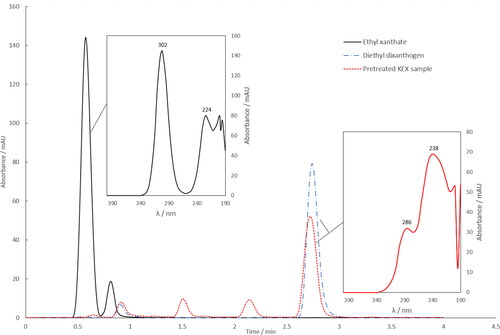
Figure 3. Optimization of ICP-MS/MS cell gas (O2) flow rate. The flow rate is provided as percentage of its maximum value of 1.5 mL min−1. A 50 µg L−1 S standard in 80:20 methanol:H2O (vol/vol) was used for optimization.
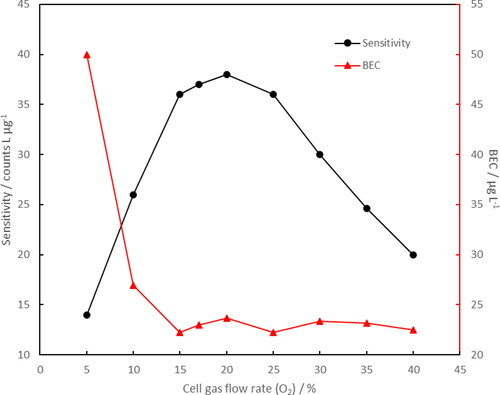
Table 2. Influence of mobile phase flow rate and composition on the retention time, resolution, and peak height of diethyl dixanthogen (EX)2.
Figure 4. Chromatograms of blank, 1 and 10 mg L−1 ethyl xanthate after pretreatment by HPLC-ICP-MS/MS. Intensities of blank and 1 mg L−1 samples are shown in the left y-axis and 10 mg L−1 in the right y-axis. The chromatograms were obtained in the MS/MS-mode using the mass-shift 32 → 48.
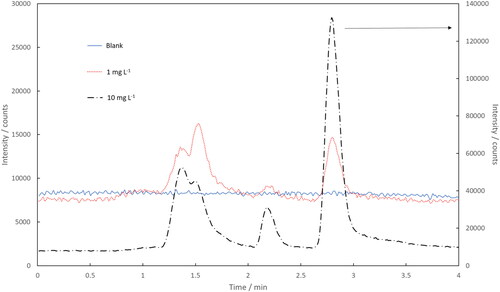
Table 3. Analytical figures of merit for the determination of potassium ethyl xanthate (KEX) and diethyl dixanthogen ((EX)2).
Table 4. Comparison of detection limits for xanthates.
Figure 5. Chromatograms of 500 µg L−1 diethyl dixanthogen (EX)2 and a tailings sample with a 500 µg L−1 (EX)2 spike by HPLC-ICP-MS/MS (mass-shift 32 → 48) following sample pretreatment.
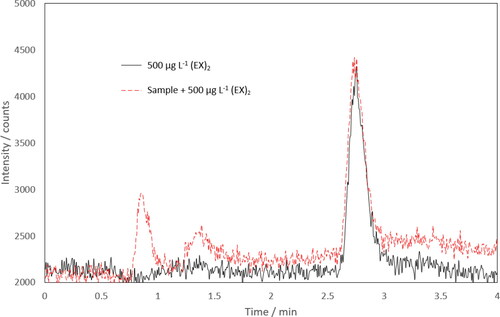
Table 5. Linear equations and their confidence intervals (α = 0.05) for standard addition determination of (EX)2 in ultra-pure water and a tailings sample by HPLC-ICP-MS/MS using peak area.