
Figures & data
Table 1. Apple attribute levels used in the DCE.
Table 2. Socio-demographics of survey respondents (n = 919).
Figure 1. Example choice set.
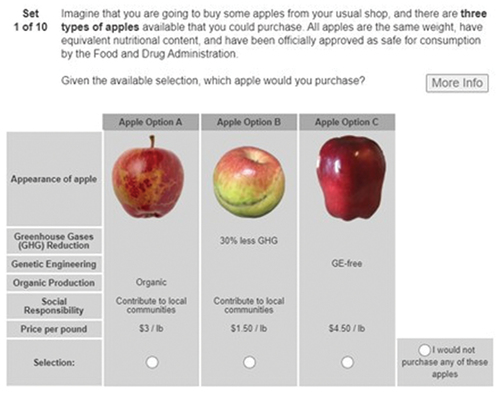
Table 3. Mixed Logit model in WTP-space of apple choices.
Table 4. Latent Class Model of consumers apple choices.
Table 5. Consumer willingness-to-pay estimates from the Latent Class Model of consumers apple choices.