Figures & data
Figure 1. Distribution of 10-km squares occupied by Merlins in the UK between 1968 and 2007. Black squares indicate those surveyed by RSG members, and grey squares indicate those selected randomly for coverage by RSPB staff and volunteers in 2008. The white squares were not covered during the survey.
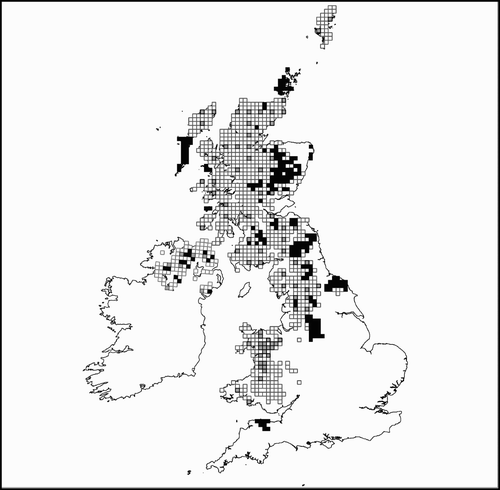
Table 1. Classification criteria for Merlin survey records.
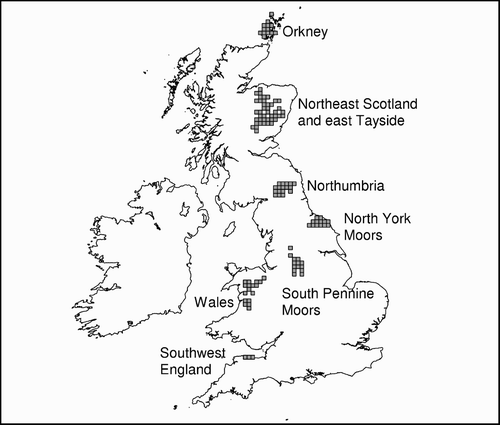
Figure 2. Populations of Merlins in regions with high levels of survey coverage in 1993–94 and 2008. The grey squares indicate the 10-km squares that received full coverage in both national surveys.